Good moment to tighten your stop losses!After market reaction to jobs data, it's a good idea to take a look at the indeces and be prepared for a correction, whatever size it is.
SPIUSD trade ideas

SPX500 Dips Ahead of NFP as Tariff Risks RiseSPX: S&P 500 Dips to Close July — Still Positive for the Month Amid Tariff Tensions & Fed Uncertainty
The S&P 500 retreated in the final session of July, weighed down by renewed tariff concerns and lingering uncertainty around the Fed’s next move. Despite the late pullback, the index remains positive for the month overall.
Looking ahead, non-farm payrolls (NFP) and U.S. jobs data are expected to have a strong impact on market direction. In addition, August 1st marks a key date for potential tariff developments, which could trigger further volatility.
Technical Outlook – SPX500
The index has dropped approximately 2.5% since yesterday and maintains a bearish bias as long as it trades below 6283. If the price continues to slide, the next downside target is 6246, with further support at 6223.
However, if the price manages to close above 6289 on the 1H timeframe, it could trigger a bullish recovery toward 6320 and 6341.
Pivot Line: 6283
Support Levels: 6246 • 6223
Resistance Levels: 6320 • 6341
S&P500 at pivot zone Stocks are climbing higher, with S&P 500 futures up on hopes for interest rate cuts and solid company earnings. The outlook is positive, especially in the finance world—bankers, hedge funds, and asset managers are expected to get higher bonuses this year, reflecting stronger market conditions.
On the global front, the US is looking to tighten control over chip exports to China by adding better tracking in semiconductors. At the same time, Taiwan’s TSMC reported a possible leak of trade secrets, which led to arrests.
Trade talks are also heating up. Japan and Switzerland are sending officials to the US to push for lower tariffs, while India’s government is heading to Moscow just after criticism from the US over its Russian oil purchases.
Conclusion for S&P 500:
The rally has strong backing from earnings and rate-cut hopes, but investors should be alert. Rotation into small-cap stocks could continue, while tech and chip sectors may face headwinds from new trade and security pressures.
Key Support and Resistance Levels
Resistance Level 1: 6380
Resistance Level 2: 6400
Resistance Level 3: 6436
Support Level 1: 6295
Support Level 2: 6256
Support Level 3: 6214
This communication is for informational purposes only and should not be viewed as any form of recommendation as to a particular course of action or as investment advice. It is not intended as an offer or solicitation for the purchase or sale of any financial instrument or as an official confirmation of any transaction. Opinions, estimates and assumptions expressed herein are made as of the date of this communication and are subject to change without notice. This communication has been prepared based upon information, including market prices, data and other information, believed to be reliable; however, Trade Nation does not warrant its completeness or accuracy. All market prices and market data contained in or attached to this communication are indicative and subject to change without notice.
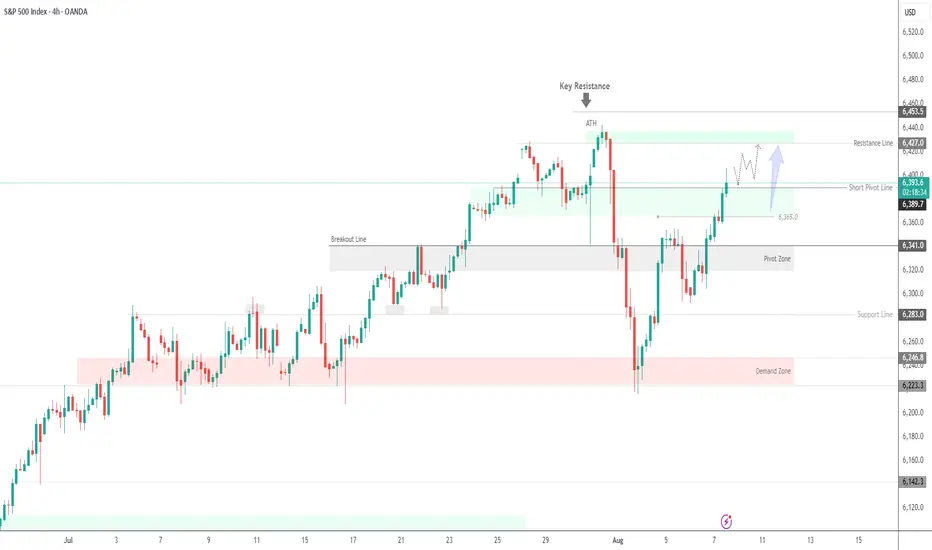
S&P 500 Futures Hold Ground After Tariffs Take EffectS&P 500 Futures Rise After New Tariffs Kick In
President Trump's sweeping tariffs officially took effect just after midnight, escalating trade tensions with dozens of countries. While negotiations are ongoing behind the scenes to secure exemptions and reduce tariff rates, market reactions are already underway.
Technical Outlook
S&P 500 Futures continue to show bullish momentum as long as price trades above 6289, with the potential to retest the All-Time High (ATH).
To confirm a move toward 6453, price must close above 6437 on the 1H chart.
🔻 However, if the price stabilizes below 6389, a correction toward 6365 becomes more likely.
Key Levels:
🔹 Resistance: 6424 – 6453
🔹 Support: 6365 – 6341
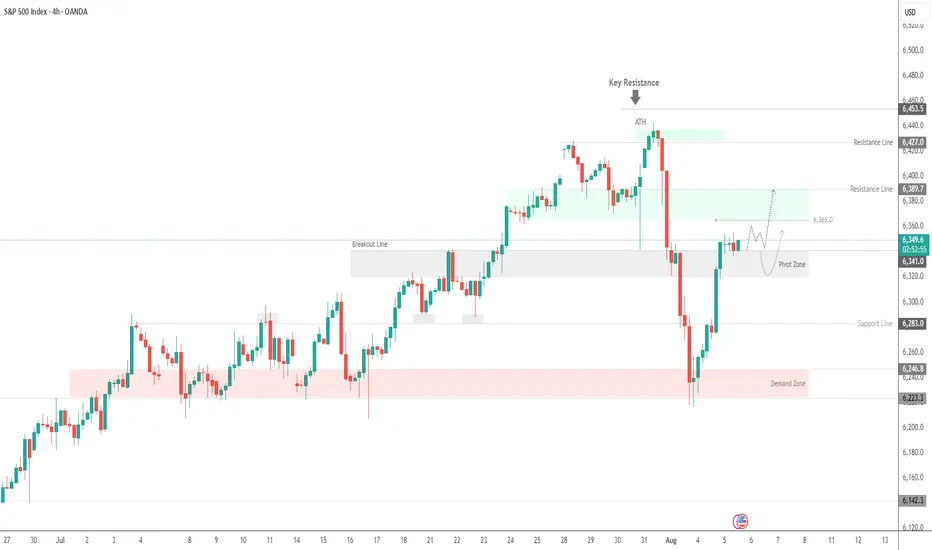
SPX500 in Focus – Breakout Needed Above 6346SPX500 – Technical Overview
The price is currently showing bearish momentum as long as it remains below 6341 and 6323, with a downside target at 6283.
🔻 As long as the price trades below 6341, the bearish bias remains intact.
🔼 For the trend to shift bullish, we need a confirmed 1H close above 6346, which could open the path toward 6365 and higher.
🔹 Resistance: 6341, 6365, 6389
🔹 Support: 6298, 6283, 6247

US Stocks on Watch as Momentum ShiftsAfter a resilient summer run, US equities are now facing a new wave of pressure. Friday’s slide was more than just a reaction to headlines, it may be the first sign of a deeper shift in sentiment.
Jobs Data Disappoints as Tariff Tensions Rise
Friday’s US jobs report was a jolt. Just 73,000 nonfarm payrolls were added in July, well short of the 110,000 expected. But the real gut punch came from the revisions. June’s figure was slashed from 147,000 to just 14,000 and May’s total was lowered by another 125,000. Taken together, that is over a quarter of a million fewer jobs than previously reported. The softening labour market has now pushed the probability of a September rate cut to 66%, as traders start to price in a more cautious Fed response.
If that was not enough, President Trump added fresh fuel to the fire by announcing a new round of tariff hikes. Imports from Canada will now face a 35% levy, up from 25%, while goods routed through third countries to avoid duties will be hit with a 40% charge. These measures come at a time when the global economy is already under strain, and investors wasted no time in pulling back. Tech and financials bore the brunt, with Amazon and JPMorgan among the hardest hit.
Short Term Momentum Breaks Down
Last week’s price action marked a clear change in tone. The S&P 500 attempted to break to fresh highs on Thursday but was met with a wave of selling on increased volume, forming a bearish engulfing candle. That move was followed by a sharp decline on Friday after the jobs data landed. This two-day drop, coming on elevated volume, stands out as a clean reversal in short term momentum and is most visible on the hourly chart.
That kind of shift raises an important question about timeframes. If you're a short-term trader focused on hourly candles and below, you will likely be watching for bearish continuation patterns. That could mean looking for brief pauses in the selling, flags or consolidations, before another leg lower.
Longer term traders will be reading the chart differently. While short term momentum has clearly turned, the longer-term structure is still intact. The market is now pulling back into a key zone of former resistance from earlier in the year. This cluster of highs, once broken, now acts as support, and just so happens to line up with the 50-day moving average. For those taking a wider lens, this is the kind of area where trend followers could look to reload.
US500 Daily Candle Chart
Past performance is not a reliable indicator of future results
US500 Hourly Candle Chart
Past performance is not a reliable indicator of future results
Disclaimer: This is for information and learning purposes only. The information provided does not constitute investment advice nor take into account the individual financial circumstances or objectives of any investor. Any information that may be provided relating to past performance is not a reliable indicator of future results or performance. Social media channels are not relevant for UK residents.
Spread bets and CFDs are complex instruments and come with a high risk of losing money rapidly due to leverage. 85.24% of retail investor accounts lose money when trading spread bets and CFDs with this provider. You should consider whether you understand how spread bets and CFDs work and whether you can afford to take the high risk of losing your money.

SP500 H4 analysis Breakdown TrendlineChart Components Observed:
Ichimoku Cloud: For trend and support/resistance visualization.
Uptrend line (manually drawn): Connecting higher lows since early May 2025.
Support break: Price has recently broken below the trendline and below the Ichimoku cloud.
Current Price: 6,237.15 (▼ -1.64%)
---
📉 Analysis Summary:
The trendline and Ichimoku cloud were acting as major dynamic support.
A bearish breakdown has occurred — price closed below the trendline and the cloud.
This suggests a potential trend reversal or correction underway.
---
🎯 Trade Setup Suggestion (Short Entry)
🟢 Entry Target (Short Position):
Sell Entry: Around 6,237 – 6,245 (current zone or slight pullback)
If price retests the underside of the broken trendline/cloud, that's a better entry confirmation.
📉 Take Profit Levels:
1. TP1: 6,130 (recent consolidation zone)
2. TP2: 6,000 (psychological + historical support)
3. TP3: 5,880 (next major support based on previous consolidation in early June)
🛡 Stop Loss:
SL: 6,300 – 6,310 (above the cloud and broken trendline for safe buffer)
---
📊 Risk Management:
Position size should be based on your account size, using 1–2% risk per trade.
Watch the S&P futures and macro news (e.g., U.S. data, Fed news) to avoid whipsaw.

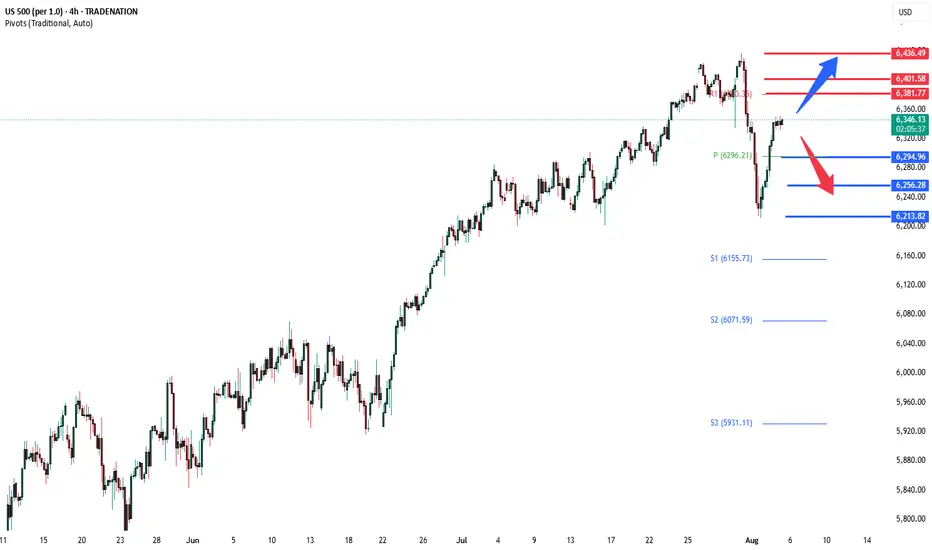
SPX500 Technical Setup – Eyes on 6365 and 6399 TargetsSPX500 – Overview
The price has stabilized above the key pivot level at 6341, maintaining a bullish bias. As long as the price holds above this level, the upward momentum is expected to continue toward 6365 and potentially 6389 or 6399.
However, a 1H close below 6323 would signal a possible trend reversal, opening the door for a deeper correction toward 6283.
🔹 Pivot: 6341
🔹 Resistance: 6365, 6399, 6427
🔹 Support: 6323, 6283
US500 Pulls Back from 6,400– Correction or Trend Shift?The index has rejected the 6,400 🔼 resistance zone with a strong bearish candle, pulling back toward the 6,200 🔽 support region. Price is still trading within a bullish structure, but this drop may signal early signs of exhaustion.
Support Levels: 6,200 🔽, 6,100 🔽, 6,000 🔽
Resistance Levels: 6,300 🔼, 6,400 🔼
Bias:
🔼 Bullish: If price holds above 6,200 and reclaims 6,300, the uptrend remains intact and bulls may reattempt a push toward 6,400.
🔽 Bearish: A daily close below 6,200 could open a deeper retracement toward 6,100 or even 6,000.
📛 Disclaimer: This is not financial advice. Trade at your own risk.

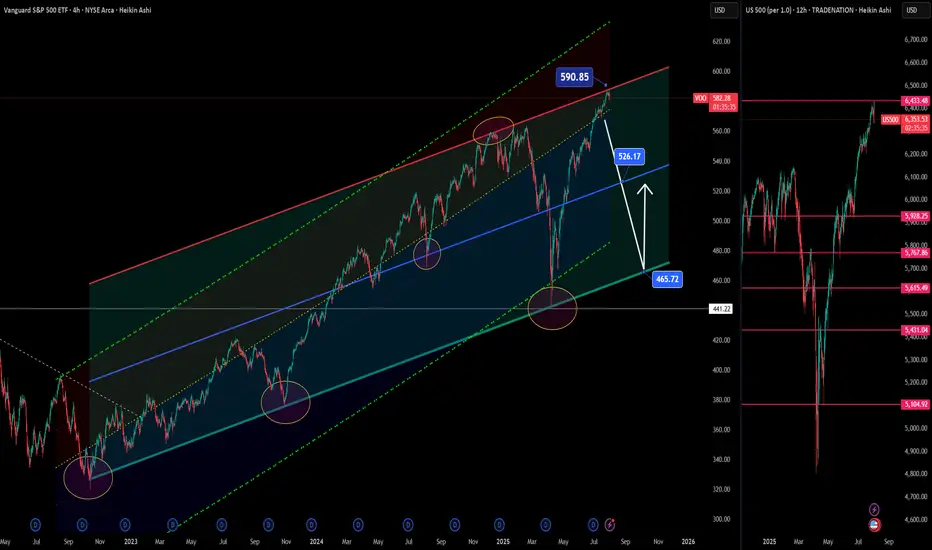
S&P 500 ETF & Index– Technicals Hint at a Possible Correction📉📊 S&P 500 ETF & Index at Resistance – Technicals Hint at a Possible Correction 🔍⚠️
Everything here is pure technicals— but sometimes, the market whispers loud and clear if you know how to listen. 🧠📐
The VOO ETF, which tracks the S&P 500 , has now reached the upper boundary of a long-term ascending channel, once again brushing against resistance near 590.85. This zone has consistently led to major pullbacks in the past.
On the right panel, the US500 Index mirrors this move—pushing toward all-time highs, right as broader sentiment turns euphoric. Technically, both charts are overextended and pressing into key zones.
👀 Potential Path:
🔻 Rejection from current zone ➝ Down toward 526.17, then 465.72 (green support channel)
🔁 Possible bounce after correction — trend still intact long term
And while we’re keeping it technical, it’s worth noting that the Buffett Indicator (Stocks-to-GDP) i s currently screaming “overvaluation.” This doesn't predict timing—but it adds macro context to an already overheated chart setup.
The lesson? Price respects structure. Whether or not the fundamentals are in agreement, the charts are warning that now may not be the time to chase.
History doesn’t repeat, but it often rhymes. Stay sharp, stay technical. 🎯
One Love,
The FX PROFESSOR 💙
ps. the beauty of these levels? Tight Stop loss- excellent R/R
Disclosure: I am happy to be part of the Trade Nation's Influencer program and receive a monthly fee for using their TradingView charts in my analysis. Awesome broker, where the trader really comes first! 🌟🤝📈
$XLV vs $SPY at multi year low. Is more downside expected? In this space we talk a lot about the market outperformance and how this has resulted in indexes at ATH. The SP:SPX and NASDAQ:NDX and their corresponding ETFs: NASDAQ:QQQ and AMEX:SPY have also made ATHs. But if peel under the surface we can observe that very few sectors have consistently outperformed the S&P 500. The Technology sector represented by AMEX:XLK has consistently outperformed the $SPY. The $XLK/ AMEX:SPY is in a upward channel depicted by the purple line. The SPDR select sector Technology sector has consistently increased its weightage on AMEX:SPY and the ratio $XLK/ AMEX:SPY is currently at 0.41 which is an ATH.
But the same cannot be told about the SPDR Healthcare Sector. The ratio between $XLV/ AMEX:SPY is making multi year low. With the ratio currently at 0.21 it is approaching its multi-year lows of 0.1975. The ratio was so low last in Sept 2000. Hence the question comes what should we expect the AMEX:XLV which is making new lows against the AMEX:SPY ? Will we visit the lows of 0.1975? If it happens then can we expect a upward momentum from his double bottom situation?
In my estimate in this bull market and Tech sector outperforming the AMEX:XLV will make new lows vs AMEX:SPY and the ratio will revisit the 2000 lows. But if on the macro front we have weak jobs numbers and recession risk rising then the AMEX:XLV can in fact draw inflows and outperform the index. Hence my estimate $XLV/ AMEX:SPY will sweep the multi-year low and then bounce back into 2026.
Verdict: Still more downside possible in $XLK/$SPY. Go long AMEX:XLV when the ratio is @ 0.1975 and into 2026.

SPY Pull back into another earnings week?An engulfing weekly candle is no joke. Sellers are in control.
There is a strong possibility of a pull back and with bias being short, I am looking for a strong LH on the 1/2HR TF to form at 6330 as 50% or 6370- 6375 near the weekly POC.
Confluences for Pull back scenario
- Price bounced off 38.2% fib from 5930 to ATH
- Price found support at 200 ema on 4HR
- 1 HR MACD is building up bullish signal
Have a great week all!

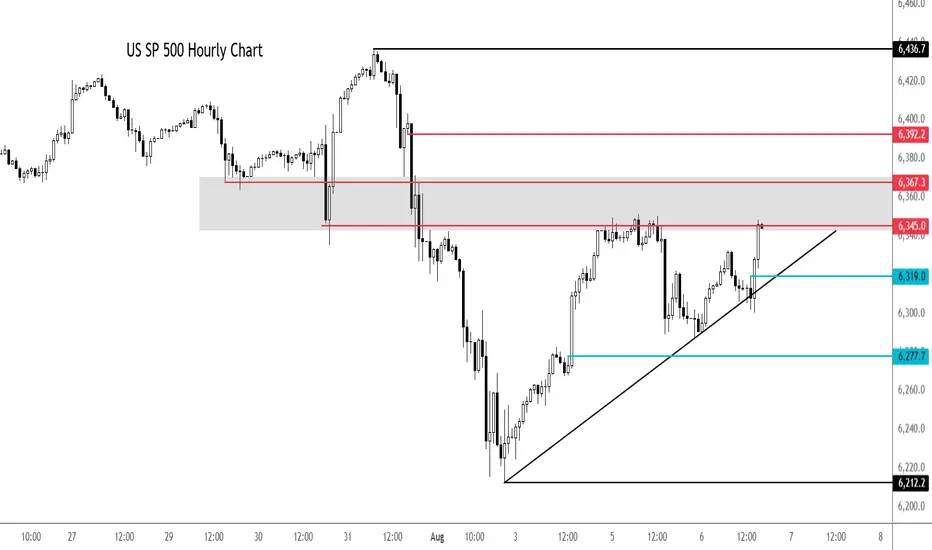
S&P 500 extends rally despite macro concernsThe 5% Apple rally aside, it is all about rate cut bets vs. strong earnings. So far, the latter has helped to keep US markets supported near all-time highs. But if macro concerns increase further, investors' perception about future earnings growth will weaken. And with that, we could see some cracks in expensive stocks.
Looking at the hourly chart of the SPX500, the US benchmark was testing a potential resistance zone in the shaded region between 6345 to 6367, an area which was previously support. Above this zone, 6392 is the next level of potential resistance and then the all-time high of 6436 comes into focus next.
earlier, the index bounced after a failed breakdown below the trend line shown on the chart. Another potential test of the trendline could see the index break lower. Short-term support is seen around 6319 then 6277.
By Fawad Razaqzada, market analyst with FOREX.com
What the Next CPI Print Could Do to the S&P500What the Next CPI Print Could Do to the S&P500
A technical and macro setup ahead of the inflation release
Next week’s CPI report could be one of the most important data points of the quarter, not just for the Fed, but for traders watching the S&P500 (SPX) at these elevated levels.
We’ve seen inflation data act like a volatility trigger in recent months, especially when it diverges from market expectations. And with the S&P flirting with key resistance, the stage is set for either a breakout or a reversal.
Let’s break down both the macro implications and the technical chart setup heading into the release.
Why CPI Matters?
If headline CPI comes in hot, markets may price in fewer Fed cuts this year. Yields spike and SPX often reacts with a sharp pullback.
If inflation cools faster than expected, the Fed may stay dovish. That typically gives SPX and risk assets broadly room to breathe higher.
Current expectations:
- Headline CPI: 3.2 percent
- Core CPI: 3.4 percent
Anything above those numbers is risk-off. Anything below supports the soft landing narrative.
Technical Setup on SPX
On the 4H and daily chart, here’s what we’re seeing:
- Price hovering around a key resistance zone between 5,660 and 5,680
- Rising wedge structure starting to form, typically a bearish sign near market tops
- Bearish RSI divergence on 1D chart
- Volume has been declining on recent pushes higher, showing lack of conviction
Key Levels
- Support: 5,615 and 5,575
- Breakout Target (if CPI is dovish): 5,750 to 5,770
- Downside Target (if CPI surprises hot): 5,500 to 5,480
Watch for a volatility spike on the release and be cautious about chasing the first move.
My Play
I’m personally staying flat heading into the data.
Too much chop, not enough conviction. But I’ll be watching for:
- A false breakout trap above 5,680 followed by reversal as a possible short setup
- Or a clear retest and hold above 5,700 with volume, which may confirm further upside
CPI has become the new FOMC. Be patient and reactive, not predictive.
Final Thought
CPI prints used to be background noise. Not anymore.
This one matters, and SPX is sitting in a technical pressure cooker.
Whatever side you lean toward, come in with a plan and don’t trade the first candle.

Fundamental end volumeThe S&P 500 has corrected from the margin level, as shown in the previous analysis, and is now rebounding. Large targeted volumes were injected from the 1/2 margin support for a breakout to new highs, with a growth target of 6500 and above. Recommendation: Buy

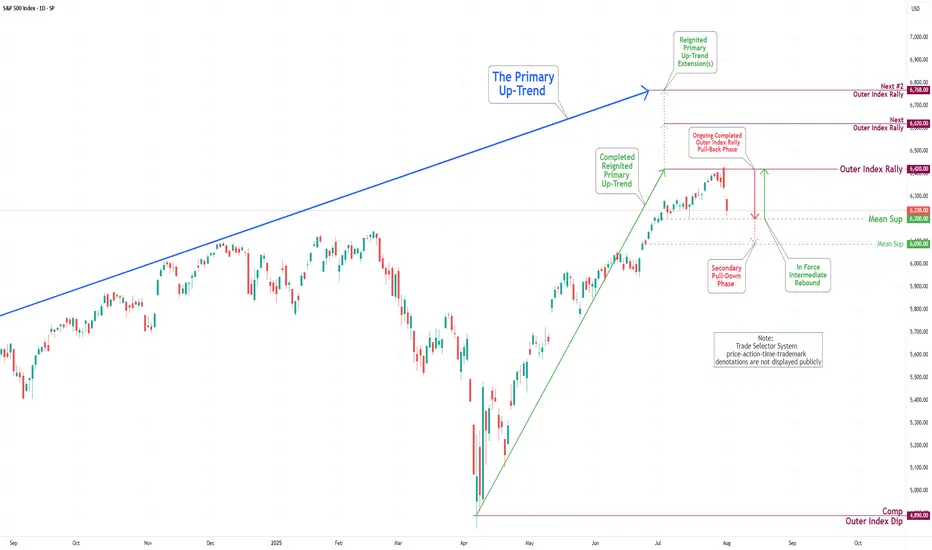
S&P 500 Daily Chart Analysis For Week of August 1, 2025Technical Analysis and Outlook:
During the trading activity of the previous week, the S&P 500 Index displayed a predominantly bearish movement after completing our Outer Index Rally target of 6420, as highlighted in the prior week’s Daily Chart Analysis, with the primary objective now being to plug our Mean Support at 6200.
It is essential to recognize that the current price movement may trigger a significant further pullback to the Mean Support level of 6090. Following this downturn, it is expected that the index will resume its upward momentum, aiming for a retest of the Outer Index Rally peak at 6420.
S&P 500 Obeying Elliott Wave TheoryThis is an update of a previous publication. A Flat occurred for Wave 2(Green) and if Wave 3 is over, we can expect a Zigzag for Wave 4. Zigzags have 3 waves. A confirmation at its current location will trigger a sell for Wave 4(Green).
For more information on the same, go to:

S&P's "hugely overbought" towards 6375!1). Position Volume dropping! 2). Big institutions (Banks & Insurance) have backed off on higher Risk positions! 3). Huge resistance at .728 fib & trend! 4). Trump tariff talk is likely adding to a fall as well! 5). We're looking for a "SELL" trade @ 6375, since buying is too risky at the moment...Good Luck!

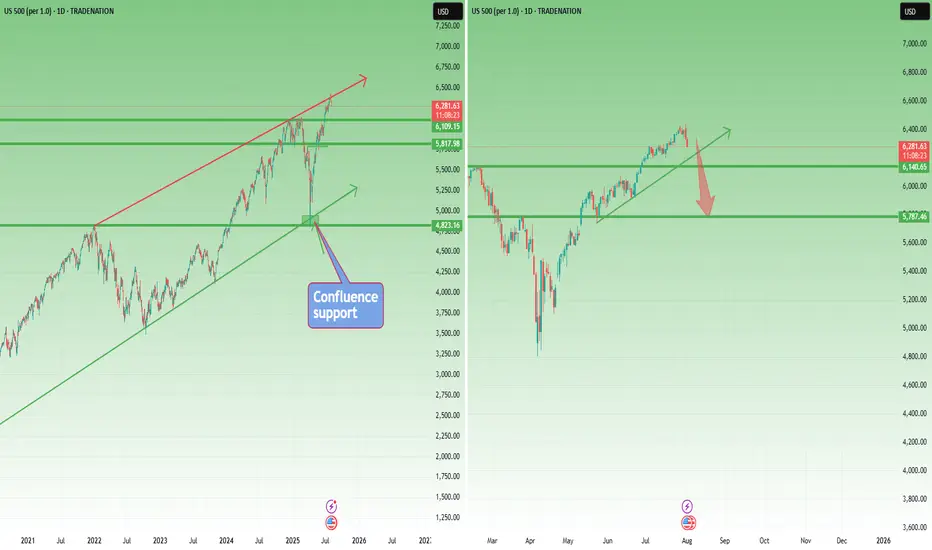
Correction Ahead? SP500 Prints Reversal Signal at Key Resistance📘 This market moves like a textbook chart
SP500 is acting like a perfect case study from a trading manual. Back in early April, the index dipped just below 5,000, right into a confluence support zone ( I had spoken about this at the time ) – formed by the long-term ascending trendline and the 2022 all-time high. Just like other U.S. indices, the market reversed aggressively from that area.
🚀 A 30% rally in 4 months
From that low, SP500 rallied around 30% in just four months. An incredible move that brought the index straight to the upper boundary of the yearly rising channel.
🕯️ Bearish signal at the top
And just like in NAS100’s case , the index printed a strong Bearish Engulfing candle exactly at that resistance level. This kind of signal, after such a rise, shouldn’t be ignored.
📉 A correction is not only probable – it’s needed
A pullback from here is not just likely, but in my opinion, healthy and necessary . Short-term speculators could look for a move toward the 6,150 zone, which would already offer decent room for profit.
🔍 What if it goes deeper?
I wouldn’t be surprised to see a correction down to 5,750–5,800. That’s about a 10% decline, which wouldn't even classify as a bear market, just a normal reset after a euphoric rally.
🧠 Perspective matters
In a market that gained 30% in four months, a 10% correction is not a crash — it’s discipline being restored.
Disclosure: I am part of TradeNation's Influencer program and receive a monthly fee for using their TradingView charts in my analyses and educational articles.
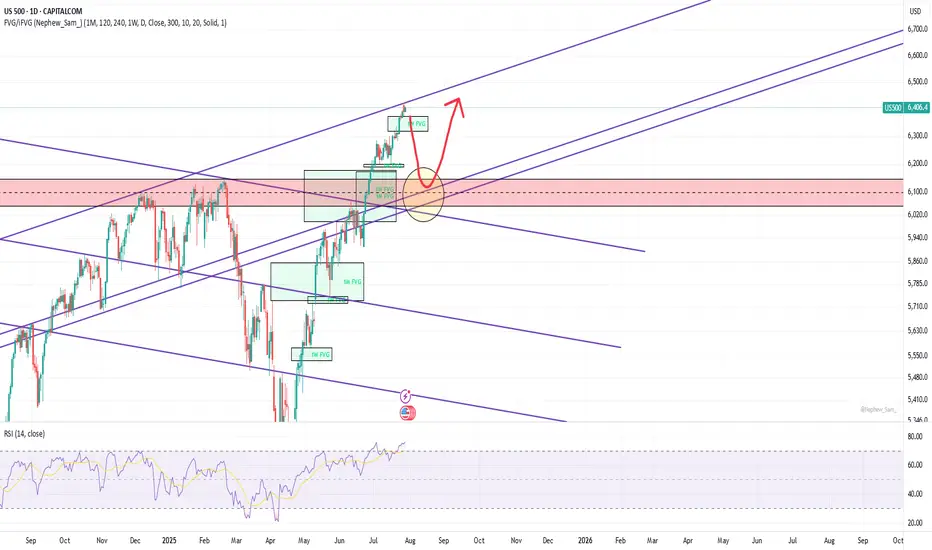
A pullback planThe upper trendline starts from Jan 2022 peak. It was broken on normal scale but still holds on log scale. The price may top here or may go higher. In a very bullish scenario the price may bounce much higher from an upper 1W FVG, but I think it will be broken soon. In any case I see a strong support at 6050-6150 area - a horizontal support and 1M/1W FVG are there. The price should return there sooner or later. No negative daily RSI divergence at the moment, but the price can make 4% correction on 2-4h divergence, which will appear at any new ATH. I gonna hold and increase my short position with low leverage untill the price makes a pullback into this area.
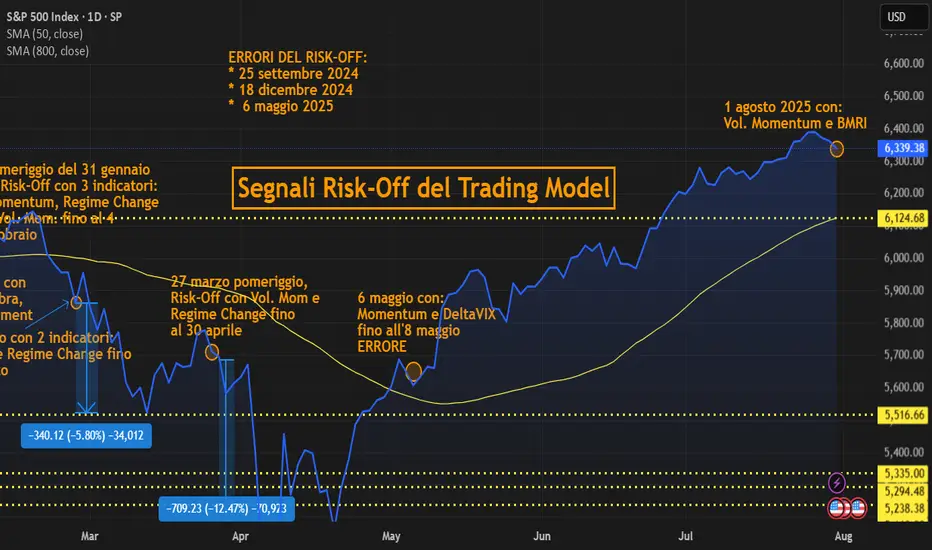
Risk-Off SignalsRisk-Off: 1 August with 2 indicators:
Voil. Momentum and Bear Market Risk Indicators (BMRI)
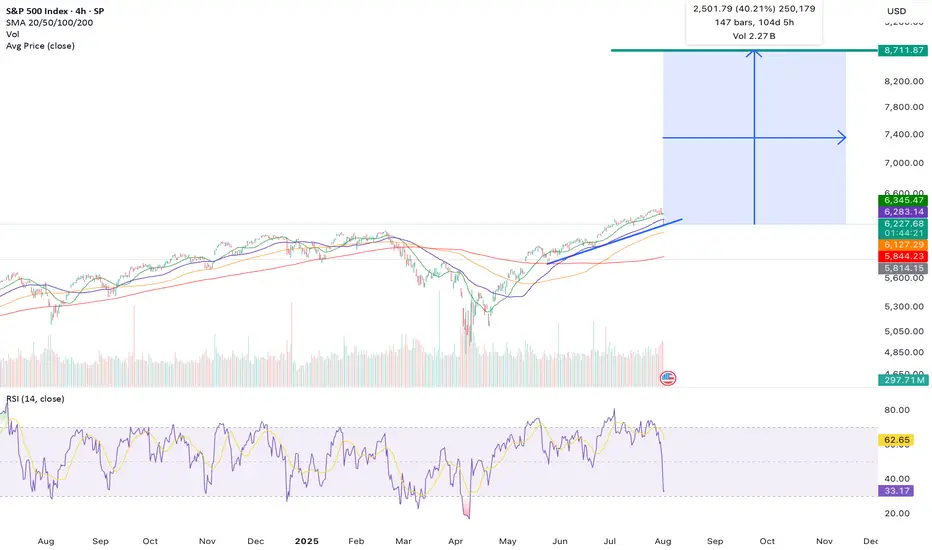
The Low Is In: Why the S&P 500 Just Confirmed a Bullish Reversal🔥 The Low Is In: Why the S&P 500 Just Confirmed a Major Bullish Reversal 🔥
The market just gave us a gift.
After weeks of drifting lower and sentiment turning cautious, the S&P 500 has touched — and bounced — off a critical rising trendline for the third time since May 2025. That third touch isn't just a technical coincidence… it's often the launchpad for a new impulsive leg higher.
📈 The Power of the 3rd Touch: Trendline Validation Complete
Look at the chart. This isn’t guesswork. Since May, the S&P 500 has been respecting a well-defined ascending trendline, one that connects multiple higher lows during this bull run.
The first touch was the May liftoff after the April consolidation.
The second came in June — a clean retest and bounce.
Now, as of early August, the third touch has held once again, exactly where the bulls needed it most.
This isn’t a random line on a chart. This is institutional flow stepping in to defend structure.
And when a rising trendline holds for a third time after a strong uptrend? That’s a classic continuation signal.
📉 RSI Washout + Structural Support = Perfect Storm for a Bottom
The RSI printed a dramatic dip to ~32, a level that screams “oversold” on the 4-hour timeframe. But notice the context — it happened right at structural support.
This is not weakness. This is accumulation.
Big players shake out weak hands on low timeframes… right before they send it.
🧠 Sentiment Is Offside… Again
Let’s not forget: this retrace came after a huge run-up since March. People expected a deeper correction. Bears started getting loud again.
That’s how bull markets trap you — by convincing you it’s over right before the next leg higher.
And with macro tailwinds (liquidity expansion, fiscal spend, tariff rollbacks), earnings season beats, and global capital rotation into U.S. equities, this setup is ripe for a violent upside squeeze.
🚀 8,700 in Sight: My End-of-Year Price Target Is Very Much in Play
Today’s close around 6,220 means the S&P 500 would need to rally ~40% to hit my target of 8,700 by year-end.
Sounds crazy? Not if you’ve seen what happens during parabolic melt-ups.
This isn’t just hope:
📊 Strong breadth under the surface
🏛️ Dovish policy pivot now expected in Q4
💸 Retail and institutional capital both re-engaging
📉 Bond yields are starting to roll over, supporting equity valuations
When bull markets enter their euphoria phase, they don’t stop at “reasonable” targets. They blast through them.
💡 The Setup Is Textbook — Now It’s About Execution
✅ Trendline defended
✅ RSI reset
✅ Sentiment shaken out
✅ Structure intact
The technicals just aligned with the macro. The low is in — and the runway to 8,700 is wide open.
Strap in. Q4 could be one for the history books.