Smoothie in One Hand, Chart in the Other: Your Vacation ManualSome traders bring a beach read. Others bring their TradingView charts.
It’s the heat of the summer and we figured, why not take it easy with a breeze of lightweight lines to pair with your mezcal espresso martini? Let’s talk about how to relax while still watching the markets.
🏄♂️ Market Never Sleeps… But You Should
Vacations are supposed to be about unplugging, but for traders, that’s just code for “I’ll switch to the app instead.”
And we don’t blame you. With all that’s going on — US-EU tariff deal, stocks at record highs, and Ethereum BITSTAMP:ETHUSD outperforming Bitcoin BITSTAMP:BTCUSD in a monster July run — it’s only natural for market participants to be hooked at this time.
But watch for those signs of getting overly attached. Studies show performance suffers when you're overcooked — like your last scalp trade on Powell Day. So yes, that mojito matters. Just don’t place a leveraged position on a pool float.
📅 Timing the Market… and Your Booking
Let’s talk timing. The pros know not to schedule getaways during Nonfarm Payrolls week or FOMC decision day. (Unless your idea of relaxing is explaining yield curves to your kids on a ferry across lake Como.)
Instead, try planning your time off during historically low-volatility periods. Summer often sees volume dry up like your skin without sunscreen. Think August’s fairly dry weeks — when even the algorithms seem to be on holiday. As always, consult with the Economic Calendar to know when these are.
Bonus tip: if you’re flying and you wanna stay wired in, go for premarket or after-hours shifts. Nothing says “seasoned trader” like placing an order while the flight attendant gathers everyone’s attention for the safety demo.
🧴 SPF 50 and the S&P 500: Know Your Risk Exposure
In these scorchers outside, you wouldn’t step out without sunscreen, right? But would you let your positions roast unsupervised?
Use stop losses like you use sunblock: generously and repeatedly. Even better — scale back. Summer’s thin liquidity (and other summer trading traps ) can turn minor market moves into full-on tidal waves. No one wants to explain to their friends why they lost 40% of their portfolio during a snorkeling trip.
Adequate position sizing is your beach umbrella. It doesn’t stop the storm, but it’ll stop the burn.
🧭 Wi-Fi, but Make It Secure
Public Wi-Fi is great for scrolling memes, not executing trades. One accidental login from a beachside café in Mykonos and boom — your brokerage account may become a group project.
Trading from your vacation spot shouldn’t be a flex (no matter how much you want to look cool to the bunch of people around you). Focus on your game, trade in silence, and bask in sunlight and success.
☀️ Pack Light, Trade Lighter
The golden rule? If you’re not at your desk, don’t trade like you are.
Scale back positions, minimize leverage, and don’t try to outperform the market while someone’s kid is throwing a beach ball at your head. This is a maintenance phase, not a moonshot month.
Think: protect capital, avoid drawdowns, maybe sneak in a swing trade between sunscreen applications.
📲 Must-Have Apps for Sand-and-Screen Trading
You’re not bringing a full setup, but your phone can still do the heavy lifting. Load it with TradingView (obviously), your broker, ideally paired with TradingView, and a solid news feed . Bonus points for noise-canceling headphones that can drown out both market panic and crying toddlers.
Set up push notifications smartly — only the alerts you actually need. You don’t want your wrist buzzing every time Nvidia NASDAQ:NVDA moves 0.1%.
Question for the road : What’s your best summer trade… and was it worth checking your phone at dinner to place it?
SPIUSD trade ideas
SPX500USD | Retesting All-Time HighsThe index has extended its bullish rally, printing a new local high at 6,286.5 before showing signs of slight hesitation with consecutive small-bodied candles.
Support at: 6,134.5 / 6,026.0 / 5,926.2 🔽
Resistance at: 6,286.5 🔼
🔎 Bias:
🔼 Bullish: Sustains above 6,134.5 and breaks 6,286.5 for new highs.
🔽 Bearish: Break below 6,134.5 could trigger a retracement toward 6,026.0.
📛 Disclaimer: This is not financial advice. Trade at your own risk.

SPY back in the trendlineFrom a technical stand point, the expectation was that the trend line will be respected and sellers will force price to close back inside.
Today's daily close can ignite further downward movement which can align with August seasonality that typically sees Indices pull back within this period.
Target still remains 6108 at previous ATH

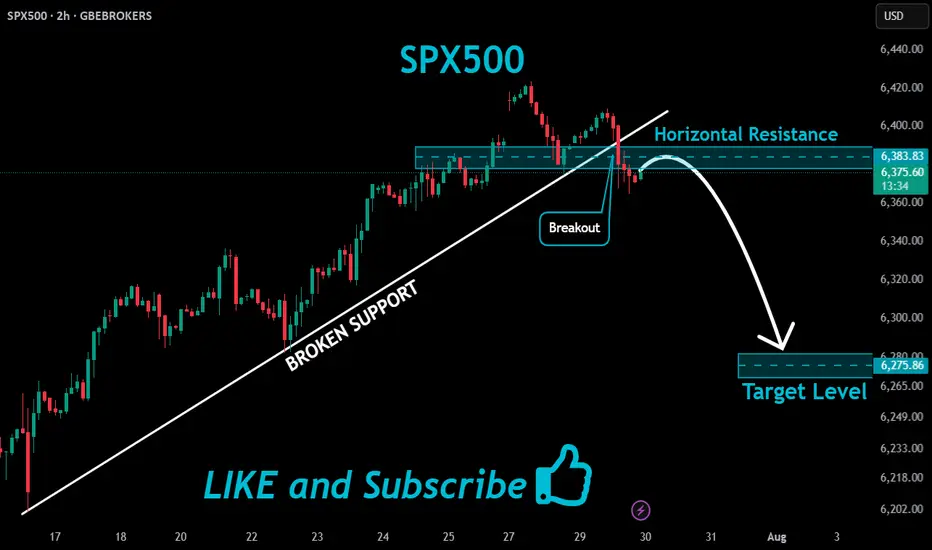
SPX500 Bearish Bias!
HI,Traders !
#SPX500 broke both the
Rising and horizontal
Support line which are
Now resistance areas
And the breakout is
Confirmed so we are
Bearish biased and we
Will be expecting a
Further bearish move down !
Comment and subscribe to help us grow !
SPX500 AnalysisThis analysis is based on the 4-hour timeframe, reversal trading, and trend formation. I've posted a video explaining what I think is probable to happen and why.
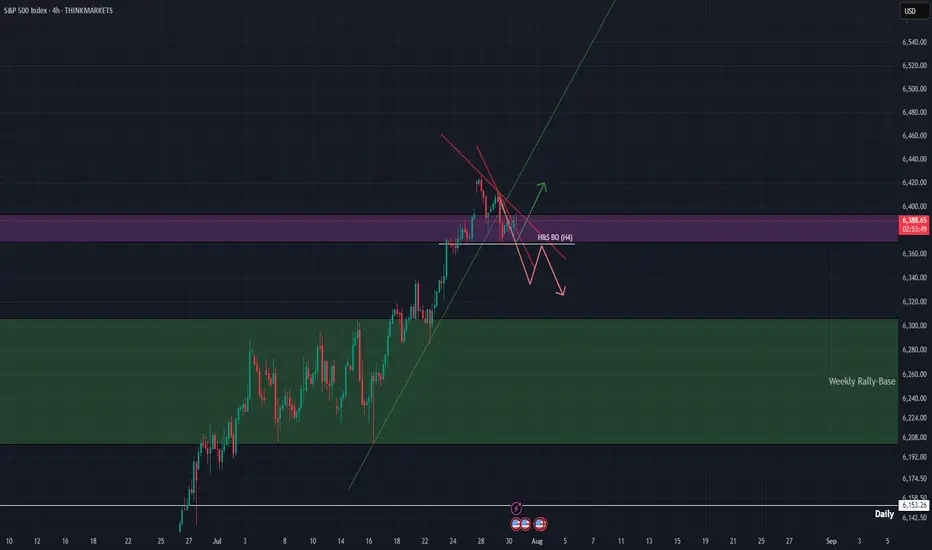
29-07-2025This chart contains my analysis and key observations for today's trading session. All drawings and indicators reflect my current view of the market as of today. The purpose of this publication is to keep a record of my analysis and review it later for learning and improvement. No investment advice is provided.

US500 (S&P): Trend in daily time frameThe color levels are very accurate levels of support and resistance in different time frames, and we have to wait for their reaction in these areas.
So, Please pay special attention to the very accurate trends, colored levels,
and you must know that SETUP is very sensitive.
Be careful
BEST
MT
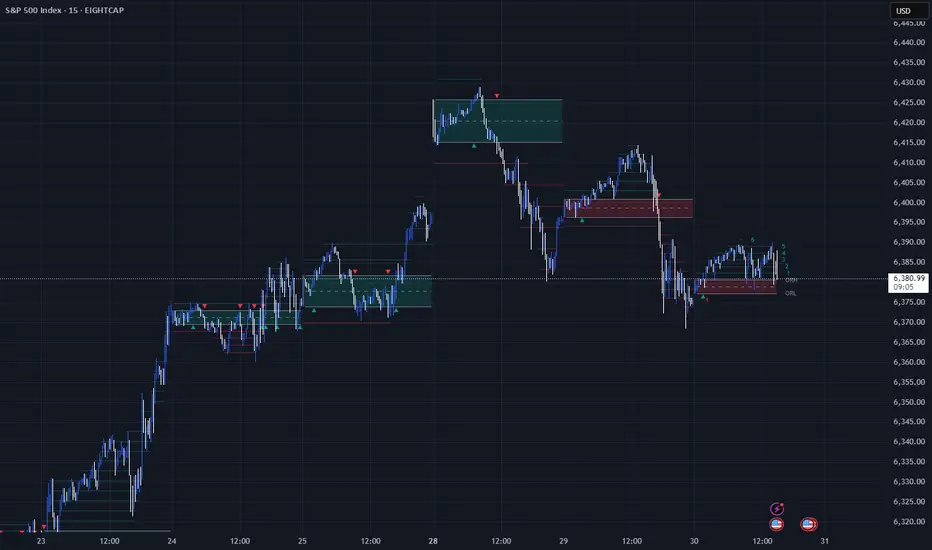
Unlocking the Power of ORB (Opening Range Breakout)Unlocking the Power of ORB (Opening Range Breakout): A Proven Strategy for Intraday Traders
In the fast-paced world of intraday trading, simplicity and structure can often outperform complexity. One such time-tested strategy is the Opening Range Breakout (ORB) — a method favored by both discretionary and system traders for its clarity and adaptability.
📌 What is ORB (Opening Range Breakout)?
ORB refers to the price range (high and low) formed during the first few minutes (typically 5, 15, or 30) after the market opens. Traders look for a breakout above or below this range, anticipating strong momentum in that direction.
🧠 Why ORB Works
Volume Surge: The opening minutes see high institutional activity, creating genuine demand/supply signals.
Market Psychology: ORB captures trader sentiment as news digests overnight and is priced in at the open.
Defined Risk: The high/low of the range becomes a natural stop-loss area, allowing clean setups.
✅ Entry and Exit Rules for the ORB Strategy
Having a consistent framework helps you avoid emotional decisions. Here’s how you can structure your trades using ORB:
🔹 Entry Criteria:
Timeframe: Define your ORB window — e.g., first 15-minute candle.
Bullish Breakout Entry:
Enter long when price closes above the ORB high with volume confirmation.
Bearish Breakdown Entry:
Enter short when price closes below the ORB low with volume confirmation.
⚠️ Avoid entering on the first breakout candle. Wait for a close and retest, or a strong momentum candle for higher confidence.
🔹 Stop-Loss Placement:
For Long Trades: Place SL just below ORB low
For Short Trades: Place SL just above ORB high
🔹 Target/Exit Options:
Fixed RR Target: Aim for 1.5–2x your risk as initial target.
Mid/Outer Bands: Use indicator-drawn breakout bands (like those in LuxAlgo script) as profit zones.
Time-based Exit: Close position by end of session if price stalls or consolidates.
Trailing Exit: Trail your stop behind higher lows (long) or lower highs (short) after breakout.
📊 ORB in Action
You can explore this ready-to-use TradingView indicator to visualize ORB levels in real-time:
🔍 Indicator: Opening Range with Breakouts & Targets (by @LuxAlgo) Thanks to @LuxAlgo team to make this indicator available.
🛠️ Highlights:
Automatically marks the opening range
Plots breakout zones and targets
Ideal for intraday strategies
Works across indices, forex, and crypto
📓 Integrating ORB into Your Trading Journal App
If you're journaling ORB trades, consider logging:
✅ Symbol & timeframe
✅ ORB range (high/low)
✅ Breakout direction (long/short)
✅ Entry time & price
✅ Exit reason (target hit, SL hit, time-based exit)
✅ Notes: market sentiment, news drivers, volume confirmation
Over time, this data will help you:
🔍 Identify which assets respect ORB best
📈 Tune your RR ratio and stop placements
🧠 Reduce decision fatigue by automating setups
🧪 Want to Automate It?
Our trading journal app is ready with 🧠 AI-based journaling for feedback and refinement
🎯 Final Thoughts
ORB is a classic — not because it’s flashy, but because it offers structure, risk control, and repeatability. Whether you're a price action purist or using smart indicators, ORB can provide a disciplined edge — especially when integrated into a journaling and feedback loop.
📌 Start small. Track results. Tune your edge.
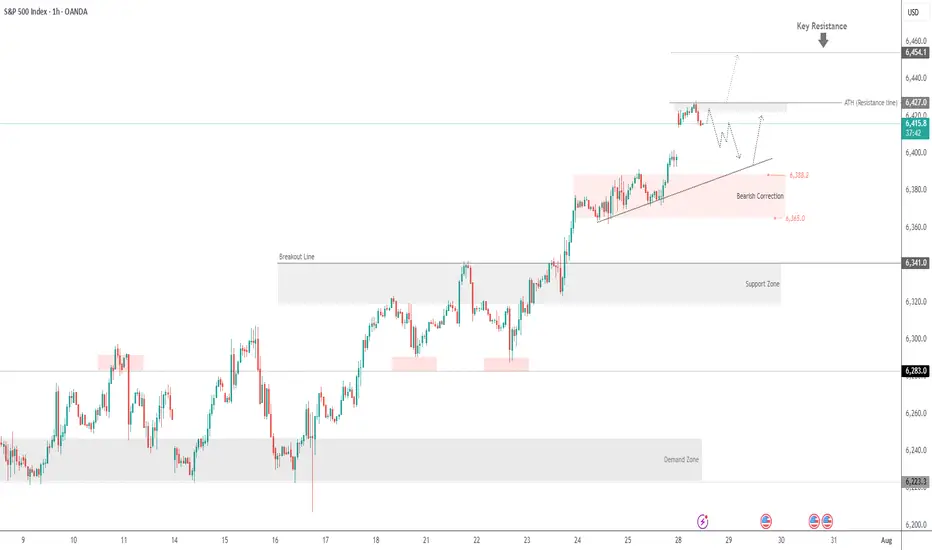
SPX500 Awaits Fed – Key Support at 6388 in FocusSPX500 Awaits Fed Decision – Breakdown Below 6365 Could Deepen Correction
Following the registration of a new all-time high at the beginning of the week, the price has started to decline. Also, investors await the Federal Reserve's policy statement later today for guidance on the future path of monetary policy.
The price is currently positioned below the 6388 level, which is a key zone in conjunction with the support line at 6365. This area signals the potential for a new downward correction if the price stabilizes below 6365.
A sustained move below 6365, confirmed by a 1H or 4H candle close, would open the door to a sharper decline toward 6341, followed by 6319, both considered critical support zones.
As for the bullish scenario: if the price finds support and manages to rebound today, the first step toward recovery would be a breakout above 6388, which may lead to a climb toward 6415. Breaking above 6415 would pave the way to retest the resistance zone at 6427, with the potential to reach a new all-time high at 6454.
Key Levels
• Support: 6365 - 6341 - 6319.
• Resistance: 6388 - 6415 - 6427.

S&P 500 as expensive as at the end of 2021 in valuation terms !Two weeks ago, I shared a technical analysis of the S&P 500 across all timeframes. This analysis outlines price targets for the end of 2025 based on technical and fundamental criteria. You can revisit this analysis by clicking the first chart below.
WARNING: A major bullish target I previously mentioned is close to being reached—6,475 points on the S&P 500 futures contract. The market may soon enter a consolidation phase.
Given this week's packed fundamentals, it's wise to start locking in your gains by moving up your stop-loss levels—especially as the S&P 500 has now returned to its end-2021 valuation peak.
Click on the table below to access details on this week's significant fundamental developments:
1. Caution: The S&P 500 has reached its end-2021 valuation record!
While technical market analysis is important, valuation metrics are even more so. The S&P 500 has just reached its previous valuation peak from the end of 2021—historically the starting point of the 2022 bear market. While the current macro context is different, this level could trigger a short-term market pause.
Chart showing S&P 500 valuation via the CAPE Ratio (Shiller PE):
2. S&P 500 seasonality is weaker in August and bearish in September
Another cautionary factor is seasonality. A statistical look at average S&P 500 performance by month highlights a weaker period in August and a typically negative one in September.
In summary, technical, fundamental, and seasonal analysis all point to securing gains as we approach August/September—without questioning the underlying long-term uptrend.
Chart showing S&P 500 seasonality since 1960:
DISCLAIMER:
This content is intended for individuals who are familiar with financial markets and instruments and is for information purposes only. The presented idea (including market commentary, market data and observations) is not a work product of any research department of Swissquote or its affiliates. This material is intended to highlight market action and does not constitute investment, legal or tax advice. If you are a retail investor or lack experience in trading complex financial products, it is advisable to seek professional advice from licensed advisor before making any financial decisions.
This content is not intended to manipulate the market or encourage any specific financial behavior.
Swissquote makes no representation or warranty as to the quality, completeness, accuracy, comprehensiveness or non-infringement of such content. The views expressed are those of the consultant and are provided for educational purposes only. Any information provided relating to a product or market should not be construed as recommending an investment strategy or transaction. Past performance is not a guarantee of future results.
Swissquote and its employees and representatives shall in no event be held liable for any damages or losses arising directly or indirectly from decisions made on the basis of this content.
The use of any third-party brands or trademarks is for information only and does not imply endorsement by Swissquote, or that the trademark owner has authorised Swissquote to promote its products or services.
Swissquote is the marketing brand for the activities of Swissquote Bank Ltd (Switzerland) regulated by FINMA, Swissquote Capital Markets Limited regulated by CySEC (Cyprus), Swissquote Bank Europe SA (Luxembourg) regulated by the CSSF, Swissquote Ltd (UK) regulated by the FCA, Swissquote Financial Services (Malta) Ltd regulated by the Malta Financial Services Authority, Swissquote MEA Ltd. (UAE) regulated by the Dubai Financial Services Authority, Swissquote Pte Ltd (Singapore) regulated by the Monetary Authority of Singapore, Swissquote Asia Limited (Hong Kong) licensed by the Hong Kong Securities and Futures Commission (SFC) and Swissquote South Africa (Pty) Ltd supervised by the FSCA.
Products and services of Swissquote are only intended for those permitted to receive them under local law.
All investments carry a degree of risk. The risk of loss in trading or holding financial instruments can be substantial. The value of financial instruments, including but not limited to stocks, bonds, cryptocurrencies, and other assets, can fluctuate both upwards and downwards. There is a significant risk of financial loss when buying, selling, holding, staking, or investing in these instruments. SQBE makes no recommendations regarding any specific investment, transaction, or the use of any particular investment strategy.
CFDs are complex instruments and come with a high risk of losing money rapidly due to leverage. The vast majority of retail client accounts suffer capital losses when trading in CFDs. You should consider whether you understand how CFDs work and whether you can afford to take the high risk of losing your money.
Digital Assets are unregulated in most countries and consumer protection rules may not apply. As highly volatile speculative investments, Digital Assets are not suitable for investors without a high-risk tolerance. Make sure you understand each Digital Asset before you trade.
Cryptocurrencies are not considered legal tender in some jurisdictions and are subject to regulatory uncertainties.
The use of Internet-based systems can involve high risks, including, but not limited to, fraud, cyber-attacks, network and communication failures, as well as identity theft and phishing attacks related to crypto-assets.

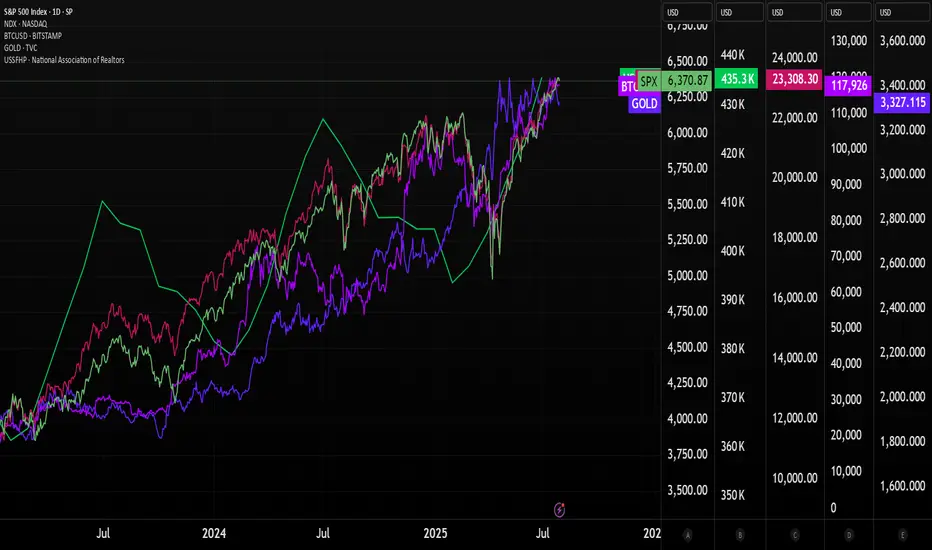
Nasdaq and S&P 500 higher than ever. Crash incoming??The stock market is now more expensive than ever.
Some people are calling the top, saying that the market is overbought and too high.
There are indicators that show that the market is overheated, but NO ONE KNOWS whether it's going to crash next week or continue running up for months.
Since April, Nasdaq has gained 40%, which is a lot. Congrats if you bought some QLD and TQQQ back in April when I posted about it.
SP:SPX : All-time high. NASDAQ:NDX : All-time high. BITSTAMP:BTCUSD : All-time high. TVC:GOLD : All-time high HOME PRICES ( ECONOMICS:USSFHP ): All-time high. Sounds a bit like a bubble.
The S&P 500’s market cap now equals 28x real disposable personal income — a record.
The stock market Shiller PE ratio is at its highest in 20 years.
Nasdaq companies, especially the MAG7, are strongly outperforming small-cap companies. The last time this happened at this speed, we had the dot-com crash.
The top 10 stocks in the S&P 500 account for 40% of the index.
So, saying this, is the market going to crash?
I don't know, but I know that it's more likely to crash now than it was 3 months ago. It might continue running higher, too, as the FED is expected to cut rates. Really, no one knows. 😊
Here's what I'm doing:
I trimmed down some overpriced stocks from my portfolio: Lemonade, Coupang, Shopify, and Crowdstrike
I trimmed down some of my crypto, especially Bitcoin and Ethereum
I stopped DCA'ing into leveraged ETFs
I'm accumulating cash
I'm still investing (added more healthcare stocks to the portfolio)
Quick note: I'm just sharing my journey - not financial advice! 😊
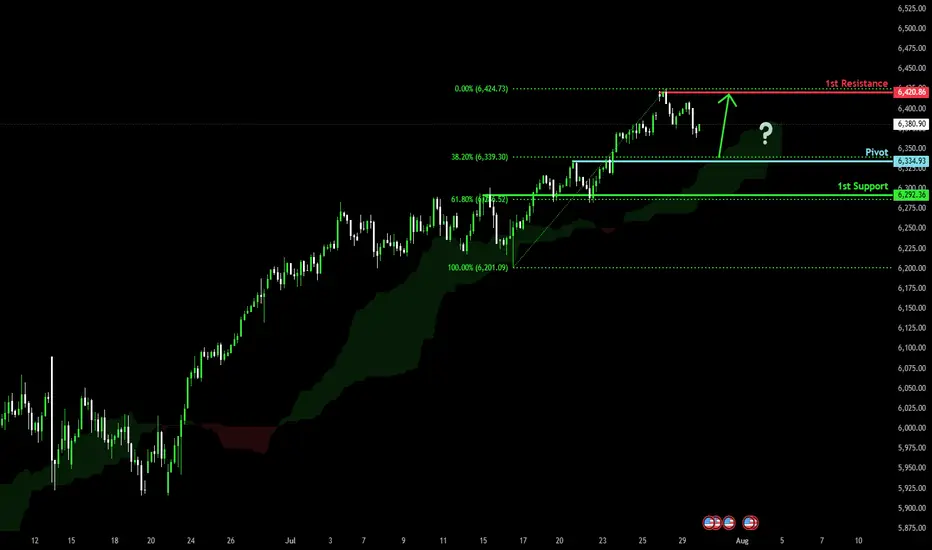
Bullish continuation?S&P500 is falling towards the pivot and could bounce to the swing high resistance.
Pivot: 6,334.93
1st Support: 6,292.36
1st Resistance: 6,420.86
Risk Warning:
Trading Forex and CFDs carries a high level of risk to your capital and you should only trade with money you can afford to lose. Trading Forex and CFDs may not be suitable for all investors, so please ensure that you fully understand the risks involved and seek independent advice if necessary.
Disclaimer:
The above opinions given constitute general market commentary, and do not constitute the opinion or advice of IC Markets or any form of personal or investment advice.
Any opinions, news, research, analyses, prices, other information, or links to third-party sites contained on this website are provided on an "as-is" basis, are intended only to be informative, is not an advice nor a recommendation, nor research, or a record of our trading prices, or an offer of, or solicitation for a transaction in any financial instrument and thus should not be treated as such. The information provided does not involve any specific investment objectives, financial situation and needs of any specific person who may receive it. Please be aware, that past performance is not a reliable indicator of future performance and/or results. Past Performance or Forward-looking scenarios based upon the reasonable beliefs of the third-party provider are not a guarantee of future performance. Actual results may differ materially from those anticipated in forward-looking or past performance statements. IC Markets makes no representation or warranty and assumes no liability as to the accuracy or completeness of the information provided, nor any loss arising from any investment based on a recommendation, forecast or any information supplied by any third-party.
SPX preparing to sweep liquidity around the 6200 level.Based on my analysis, the #SPX has printed a reversal engulfing candle, which could lead to a period of consolidation. The most probable target appears to be the liquidity pool around the 6200 level.
However, this outlook becomes invalid if the daily candle closes above 6410—the current (today) session high.
As always, conduct your due diligence. Technical analysis offers a probabilistic perspective, not certainty.

Tuesday 29 July: Forex Market thoughts The EUR has begun the week under pressure following the US / EUR trade deal.
EUR weakness could be out down to what they call 'sell the fact', meaning buy last week's deal rumours / sell (take profit) on the announcement. Or, more likely, it could be because it appears the US has the better side of the deal. Either way, all of lat week's EUR positivity has dissipated.
I didn't get involved in a EUR short trade yesterday, but there is a case to say it was viable.
The USD and JPY begin the week on the front foot. Possibly benefitting from 'EUR liquidity', or possibly due to 'positioning' ahead of this week's FOMC and BOJ meetings.
As things stand, with the VIX below 15 and the S&P still riding high, I maintain my view that according to market fundamentals, 'risk on' trades 'should' be viable. Which means staying patient and waiting for a turnaround, particularly on the JPY charts.
If that turnaround doesn't come, I could be forced to change my view.
S&P500 uptrend pause supported at 6355US equities were largely subdued, with the S&P 500 inching up +0.02%, marking its sixth straight record high, the longest streak since July 2023. Despite the headline gain, over 70% of S&P 500 stocks declined, revealing weak breadth and suggesting index gains are being driven by a narrow group of large-cap tech names.
Tech led the way, with the information technology sector +0.77% and the Mag-7 rising +0.79%.
Semiconductors outperformed, as the Philadelphia Semiconductor Index climbed +1.62%, driven by AMD’s +4.32% surge.
Momentum is building ahead of key Big Tech earnings: Microsoft and Meta report tomorrow; Apple and Amazon follow Thursday.
Meanwhile, traders are staying cautious ahead of a busy macro week:
FOMC decision (Wednesday),
Core PCE, Q2 GDP, ISM, and nonfarm payrolls still to come.
Geopolitical developments include a possible 90-day US-China trade truce extension and Taiwan cancelling overseas travel, which may help de-escalate tensions.
On the corporate front:
Apple's India strategy sees it surpass China as the top smartphone source for US buyers.
Harley-Davidson may sell its finance unit in a $5B deal with Pimco and KKR.
Vitol rewarded top staff with $10.6B in share buybacks—a record.
Conclusion for S&P 500 Trading
The S&P 500 continues to post record highs, but narrow leadership and weak breadth raise red flags. With tech doing the heavy lifting, near-term direction hinges on earnings from Microsoft, Meta, Apple, and Amazon. Broader market upside looks fragile ahead of critical Fed and economic data, suggesting that any disappointment could trigger a pullback. Stay cautious and watch for rotation or retracement if macro or earnings catalysts falter.
Key Support and Resistance Levels
Resistance Level 1: 6430
Resistance Level 2: 6470
Resistance Level 3: 6500
Support Level 1: 6355
Support Level 2: 6315
Support Level 3: 6280
This communication is for informational purposes only and should not be viewed as any form of recommendation as to a particular course of action or as investment advice. It is not intended as an offer or solicitation for the purchase or sale of any financial instrument or as an official confirmation of any transaction. Opinions, estimates and assumptions expressed herein are made as of the date of this communication and are subject to change without notice. This communication has been prepared based upon information, including market prices, data and other information, believed to be reliable; however, Trade Nation does not warrant its completeness or accuracy. All market prices and market data contained in or attached to this communication are indicative and subject to change without notice.

SPX500 Correction Before Rally? Key Levels in FocusSPX500 Correction Before Rally? Key Levels in FocusSPX500 OVERVIEW
Fundamental Context:
The U.S. and EU have averted a tariff standoff. The agreement reduces the baseline tariff on most European imports to 15%, down from the previously threatened 30% by the Trump administration. In return, the EU has committed to investing approximately $600 billion in the U.S.
Additionally, U.S.–China trade talks are ongoing in Stockholm, with reports suggesting a possible 90-day extension to the tariff deadline.
Technical Outlook:
SPX500 maintains a bullish bias due to easing trade tensions. However, as long as the price trades below 6421, a short-term correction toward 6397 and 6388 is likely. A rebound is expected if the price stabilizes above 6388.
🔺 Bullish Continuation will be confirmed if a 1H candle closes above 6427, potentially targeting 6454 and 6470.
Key Levels
• Support: 6397 – 6388 – 6365
• Resistance: 6454 – 6470
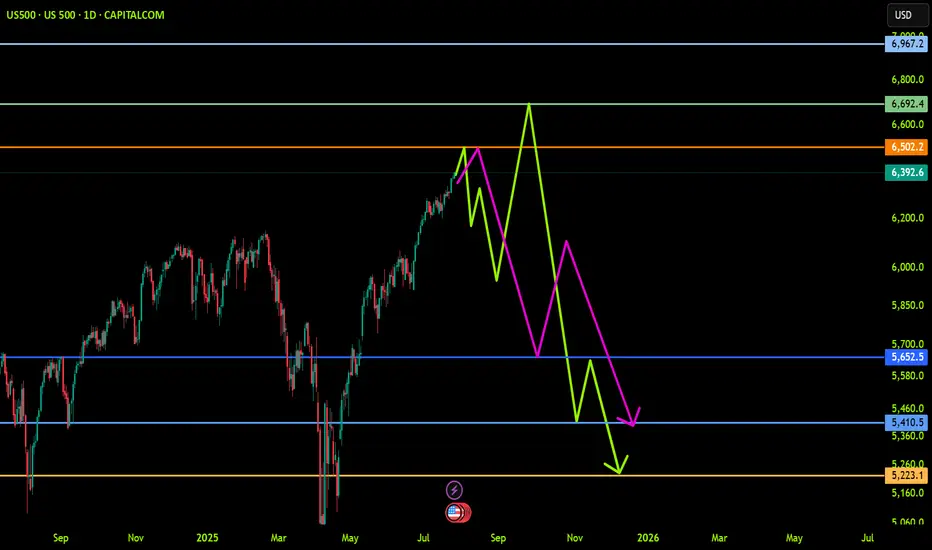
SPX Elliot Wave Count, Wykoff DistributionBased off the HTF elliot wave count aligning and in confluence with a HTF Wykoff distribution. With the top coming in between 6600-7000ish around September 2025 till January 2026. Further confluence with trendline, fibonnacci time and fibonnaci trend and extension.

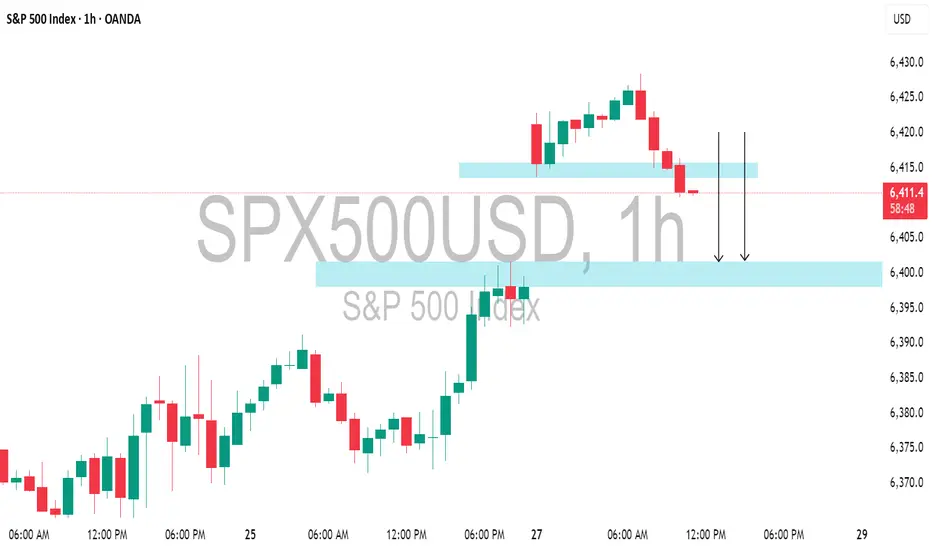
SPX500USD | Bulls Lose Steam at 6,424.5 ResistanceThe S&P 500 Index showed strong bullish momentum but is now pulling back after tagging resistance at 6,424.5. Price is currently hovering near 6,374.6, where previous structure may act as support.
Support at: 6,374.6 / 6,340.0 🔽
Resistance at: 6,424.5 🔼
🔎 Bias:
🔼 Bullish: Bounce from 6,374.6 and reclaim of 6,424.5 signals continuation.
🔽 Bearish: Break below 6,374.6 exposes 6,340.0 and lower zones.
📛 Disclaimer: This is not financial advice. Trade at your own risk.

SPX....what goes up, must go downThis is long overdue. SPX has just crossed 9SMA, next 50SMA then 200SMA. Won't be surprised if it knocks each very soon. This will be a big week and tariffs are going to start hitting; even though this was mostly artificial and Americans are paying 90% of it! When in doubt, sell and park in money market! The next dip will hit hard and deep. Don't let the small wins overshadow the deep issues in the economy. Overpriced market and many lagging indicators will soon hit and default rates that are coming out are scary! Stay safe and don't get emotional over any stock. If it dips, you can always buy it cheaper.
Bulls and Bears zone for 07-28-2025Last week 4 out of 5 sessions S&P 500 made new ATH. However they were all trading within a tight range.
Level to watch: 6434---6436
US 500 – Potentially A Pivotal Week Ahead The US 500 index registered a new record closing high on Friday at 6396 continuing a bullish trend that has yet to show many signs of faltering. The Monday open has seen this move extend as traders digest the positive news flow from the weekend that a US/EU trade deal has been agreed after President Trump and EU Commission head Ursula Von der Leyen, met in Scotland on Sunday. This has seen the US 500 index rally another 0.4% to a new high of 6429 (0730 BST).
However, the week ahead could be a pivotal one for the direction of US stock indices over the remainder of the summer, and in this regard, it is perhaps surprising that market volatility measures, such as the VIX (fear Index), are back to their lowest levels since late March, indicating limited trader concern for what lies ahead. Although, things can change very quickly.
In many ways the week ahead is one that has it all, including a new round of US/China trade talks which start today, a Federal Reserve (Fed) rate decision, key tech earnings, tier 1 US data releases and on-going trade/tariff discussions. More than enough to ensure there is the potential for US 500 price action to become increasingly volatile as the week progresses.
Looking forward, Wednesday could be a very busy day, with the Fed Interest Rate Decision released at 1900 BST and quickly followed at 1930 BST by the press conference led by Chairman Powell, who has been under intense political pressure in the last 10 days. While the Fed are expected to keep rates unchanged, traders may be interested to see which policymakers were keen to vote for a cut, as well as whether Chairman Powell’s comments indicate a September rate reduction may be more likely than currently anticipated.
Then, later Wednesday evening Microsoft, Qualcomm and Meta release their earnings updates after the close, with Amazon and Apple’s results due after the market close on Thursday. These releases could be crucial for sentiment towards the US 500, with particular focus being paid to what these companies say about future revenue and tariff issues, as well as the specific performance of AI and cloud services.
This only takes us to the middle of the week, which is where the tier 1 US economic data releases take over, with the PCE Index, the Fed’s preferred gauge of inflation, due on Thursday at 1330 BST, and then the all-important Non-farm Payrolls update on the current health of the US labour market released on Friday at 1330 BST. US 500 index traders may well be sensitive to the outcome of both of these prints.
That’s still not all. Friday’s US employment update coincides with President Trump’s tariff deadline which could add to US 500 volatility into the weekend.
Wow, I did say it’s a week that has it all!
Technical Update: New All-Time Highs Posted Again
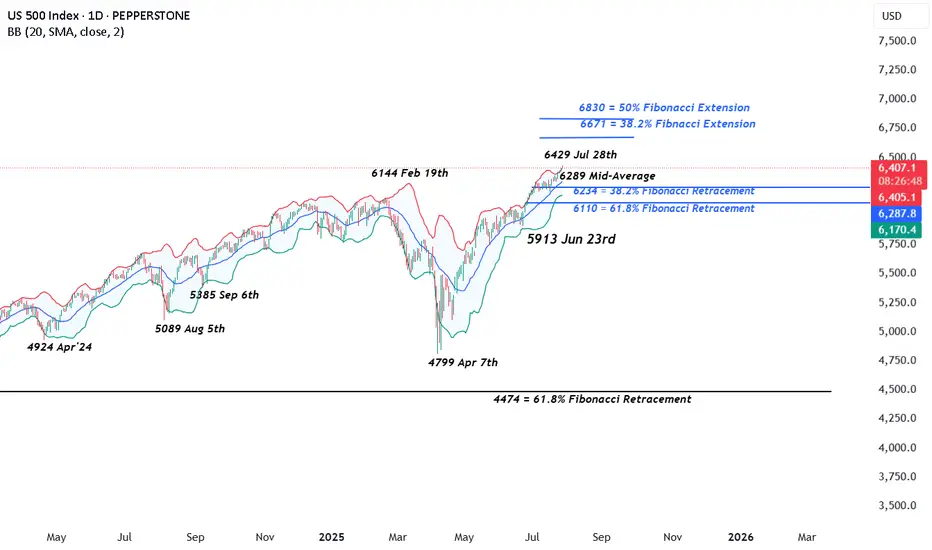
It looks as if the latest US 500 index activity is maintaining the current positive trending themes after another all-time high was posted this morning at 6429. This could skew risks towards the further development of the pattern of higher price highs and higher price lows that has materialised since the April 7th downside extreme at 4799 was seen.
However, it must be remembered, these moves do not guarantee this price activity will continue, so traders may find it useful to assess the possible support and resistance levels that could influence price activity moving forward across what is set to be a very busy week of events.
Possible Support Levels:
If any US 500 price weakness does materialise across the week ahead with the potential to develop into a more extended phase of declines, a support level that traders may consider worth monitoring could be 6289.
6289 is equal to the current level of the rising Bollinger mid-average. Closing breaks below 6289 might suggest a more extended phase of weakness is possible, opening the potential for moves back to 6234, which is the 38.2% Fibonacci retracement, possibly further if this level in turn gives way.
Possible Resistance Levels:
Having been capped by the 6429 all-time high this morning, sellers may continue to be found at this level, so this might prove to be the first potential resistance if fresh attempts at price strength develop over the coming week.
It may be helpful for traders to watch how this 6429 level is defended on a closing basis, as successful closing breaks might suggest a further extension of the uptrend pattern currently evident in price activity.
Such closing breaks higher may well suggest price strength towards 6671, which is the 38.2% Fibonacci extension level of the February 19th to April 7th sell-off.
The material provided here has not been prepared accordance with legal requirements designed to promote the independence of investment research and as such is considered to be a marketing communication. Whilst it is not subject to any prohibition on dealing ahead of the dissemination of investment research, we will not seek to take any advantage before providing it to our clients.
Pepperstone doesn’t represent that the material provided here is accurate, current or complete, and therefore shouldn’t be relied upon as such. The information, whether from a third party or not, isn’t to be considered as a recommendation; or an offer to buy or sell; or the solicitation of an offer to buy or sell any security, financial product or instrument; or to participate in any particular trading strategy. It does not take into account readers’ financial situation or investment objectives. We advise any readers of this content to seek their own advice. Without the approval of Pepperstone, reproduction or redistribution of this information isn’t permitted.
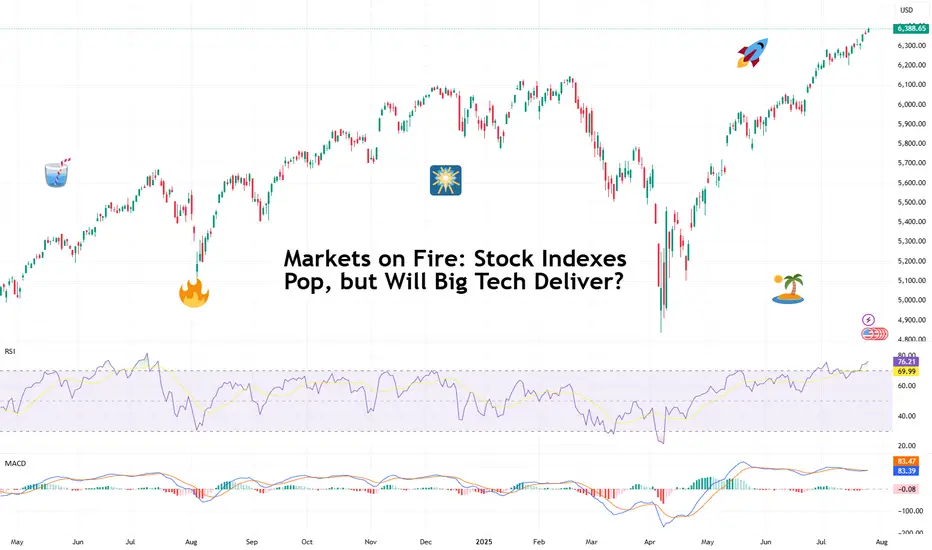
Markets on Fire: Stock Indexes Pop, but Will Big Tech Deliver?S&P 500 and Nasdaq set records. Now it's up to big tech to justify that.
Talk about forward-looking valuation. Tech companies’ valuations are largely based on future potential rather than current performance. And that’s what we’re seeing right now getting priced in across the big indexes.
You’d think we’d be bored of record highs by now. But no — Wall Street keeps hitting refresh on its all-time-high counter. 🎵 Over and over again. 🎵
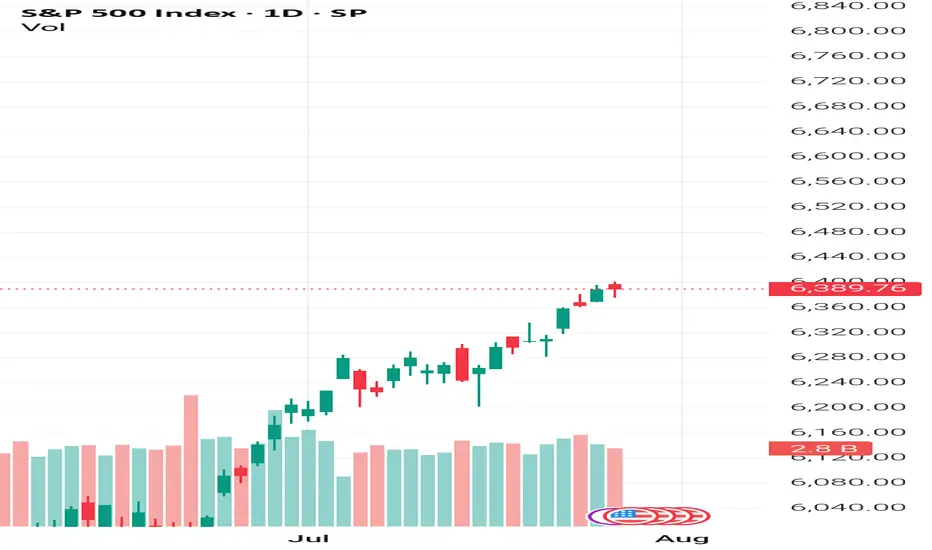
On Friday, the S&P 500 SP:SPX notched its 14th record close this year, ending at 6,388.64. The Nasdaq Composite NASDAQ:IXIC followed with its 15th at 21,108.32. Even the Dow TVC:DJI — the older sibling who prefers yield over hype — climbed nearly 0.5% to 44,901.92, within a latte’s foam of its December record .
And while indexes are breaking personal bests, investors are buying ahead of some big data deliveries. Why? Because the week ahead is the Super Bowl of Earnings, and the bigger chunk of the Magnificent Seven is up next.
😎 What in the Magnificent Seven?
A highly exclusive club with just seven members, the Mag 7 has entered the earnings spotlight — and the audience isn’t going mild. Traders are pricing perfection, and the script better deliver.
Meta NASDAQ:META kicks things off Wednesday after the close with expected revenue of $44.8 billion and EPS of $5.87. Can Zuckerberg’s AI narrative get investors to forget about the metaverse?
Microsoft NASDAQ:MSFT shows up at the same time, hoping to dazzle with $73.8 billion in revenue and $3.38 EPS. Copilot AI better be doing overtime.
Then on Thursday, again after lights out, Amazon NASDAQ:AMZN joins the chat with its AWS and ecommerce empire expected to pick up $162.1 billion in revenue. Right behind is Apple NASDAQ:AAPL , fighting to stop its slide into meh-land with projected revenue of $89.2 billion and $1.43 EPS. (Fast fact: AAPL is down 12% year to date — among the worst performers in the crew.)
So far, Alphabet NASDAQ:GOOGL already crushed its quarter , posting $96.4 billion in revenue and $2.31 EPS, plus a spicy raise in capex to $85 billion.
Tesla NASDAQ:TSLA ? Not so great. The EV maker reported a 12% revenue drop and a 16% net income decline, spooking investors with a warning of “rough quarters ahead.” The stock is lower by 17% year to date.
Nvidia NASDAQ:NVDA , the AI trailblazer, reports in late August. Until then, it’s chilling on a $4 trillion throne, as per our Top companies rankings, watching its friends sweat it out.
💸 Can the Mag 7 Keep Carrying?
Here’s a harsh dose of reality: the entire S&P 500 is riding on the backs of these seven stocks. Analysts expect them to post 14% earnings growth, while the other 493 companies limp along at 3.4%. Talk about top-heavy things.
So what happens if even one tech titan misses the mark big time and spooks with scary guidance? A market correction? A buy-the-dip opportunity?
And let’s not forget: valuations are stretched. The S&P 500 is now trading at nearly 23x forward earnings (that’s projected profits per share). And the Nasdaq? Don’t even ask. (We’ll tell you anyway — it’s close to 30x). In all that, now’s a great time to keep a close eye on the Earnings Calendar .
📊 Not All Is Big Tech: Fed and Jobs Loom
As if this week wasn’t already packed enough, macro is back on the menu. The Federal Reserve meets Tuesday and Wednesday, and Chair Jay Powell is expected to hold rates steady at 4.5%.
But don’t rule out drama. A single hawkish word and this party could quickly get some rain on. Powell, the man who moves trillions with a simple “Good afternoon,” has a track record of putting markets in their place when they get too euphoric.
And then there’s Friday’s nonfarm payrolls report. Consensus calls for just 108,000 jobs added in July — soft, but not disastrous, and fewer than June’s 147,000 . Blame summer hiring slumps, tariff uncertainty, or the market finally digesting its own hype.
Off to you : Can the Magnificent Seven keep this market magnificent? Or are we about to learn what happens when you ride too close to the sun on AI-generated wings?
S&P500 INDEX (US500): Classic Gap Opening TradeI noticed a classic gap up opening on 📉US500 Index and believe it will be filled today.
The formation of an intraday bearish change of character (CHoCH) on the hourly chart indicates a strong likelihood of continued bearish movement.
Target - 6400.