XBR/USD Chart Analysis: Oil Price Declines Towards Key SupportXBR/USD Chart Analysis: Oil Price Declines Towards Key Support
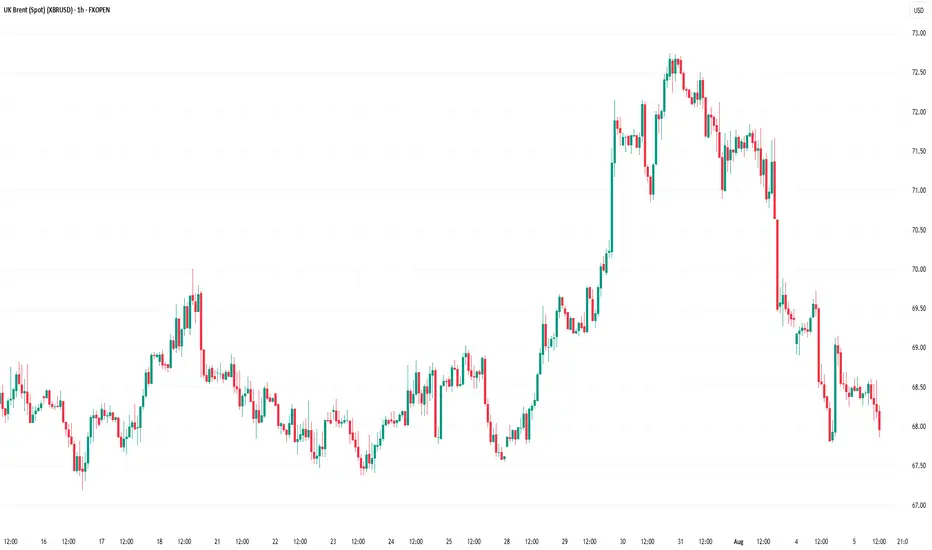
As the XBR/USD chart shows, Brent crude oil has made two significant moves recently:
Last week’s price increase (A) followed President Donald Trump’s intentions to impose tariffs on India due to its purchases of Russian oil. This c
Oil surges on Russia sanction threats but long-term risks remainOil prices have climbed around 6% this week, driven by two key developments: a trade deal between the EU and the US, and Donald Trump’s warning that the US may impose sanctions on Russian oil buyers within 10 days unless progress is made toward ending the Russia-Ukraine war.
Russia accounts for abo

WTI short in OPEC production hike and technical breakout Interesting chart for WTI with a nice daily downtrend and 4hr counter trendline + support level for a breakout. This is further supported by the OPEC production hike, would like to see a higher inventories reading too.
Things that could negatively effect this position are sanctions being put on R

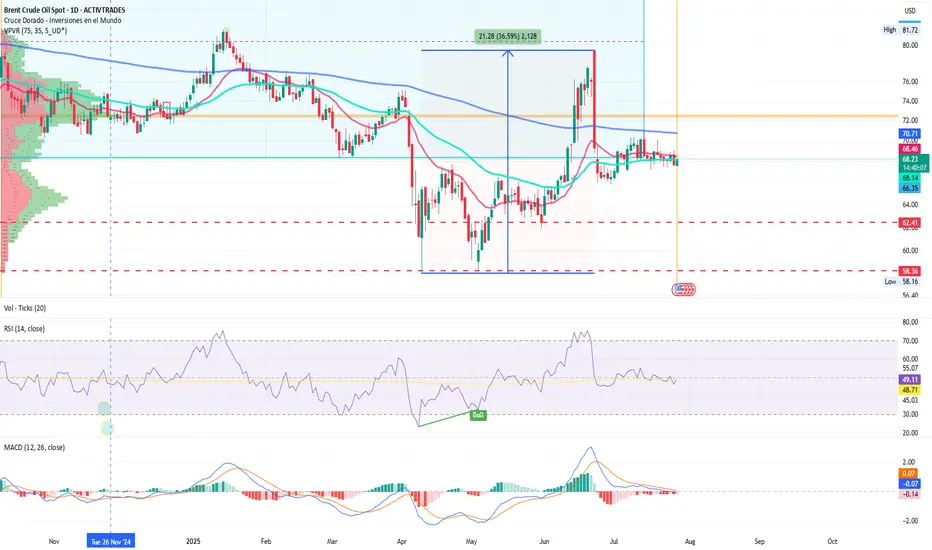
Brent: Crude Loses Its Shine Amid Mass Selloffs and Global FearsBy Ion Jauregui – Analyst at ActivTrades
Bearish pressure is intensifying in the oil market, with Brent crude leading the liquidation among major investment funds. The expiration of U.S. tariff exemptions on August 1st, combined with a global economic slowdown, has triggered a wave of risk aversio
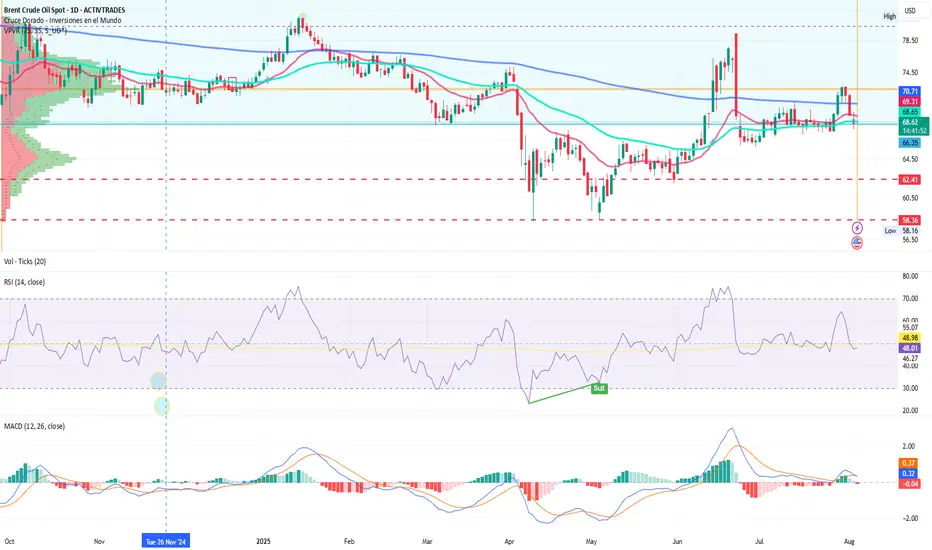
BRENT: OPEC+ Reacts as a New Geopolitical Chapter LoomsIon Jauregui – Analyst at ActivTrades
The oil market is bracing for a new episode of high tension. With Brent stabilizing around $70 per barrel, OPEC+ has made a decisive move: starting in September, it will increase production by 547,000 barrels per day—a decision that could significantly alter t
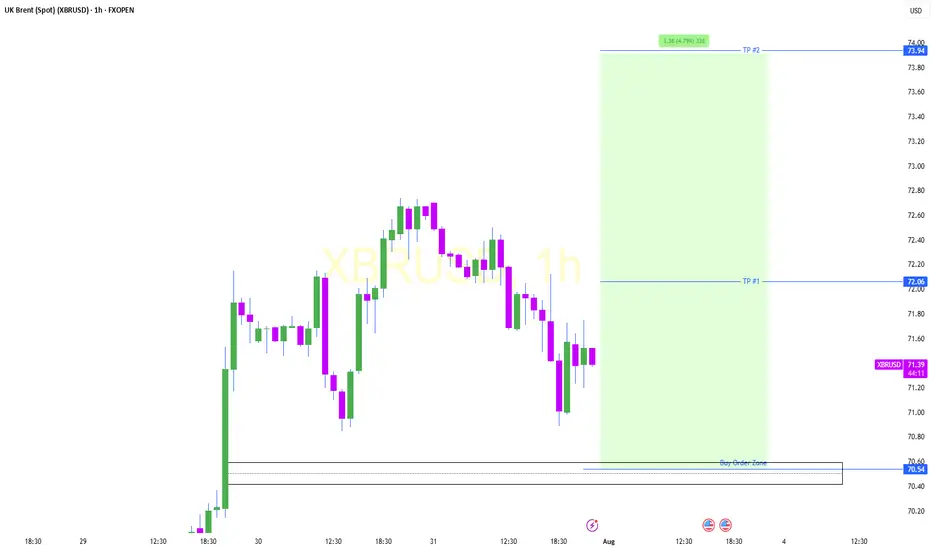
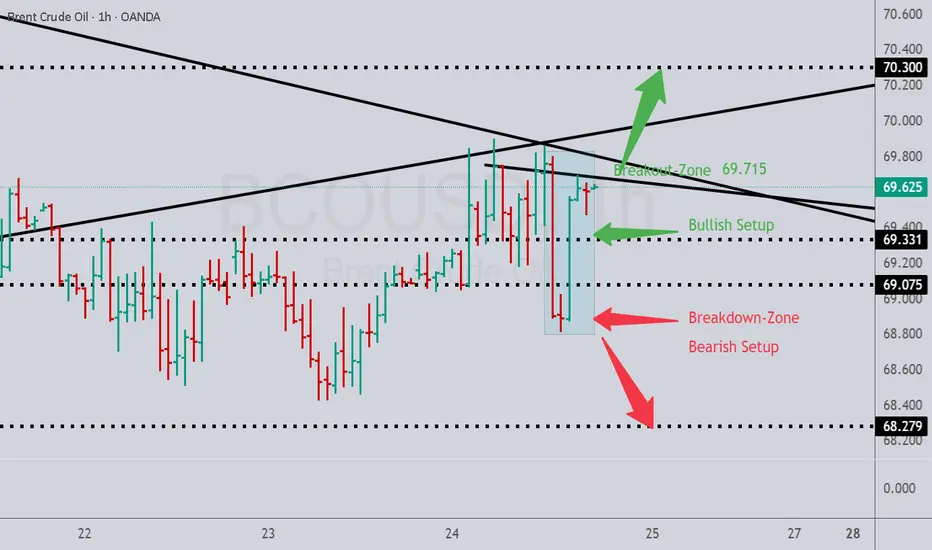
Possible Bullish Setup on 1Hr Brent Crude.Possible bullish setup on the 1hr Brent.
A break below setup triggers a bearish position to target price area.
Best of luck in all your trades.
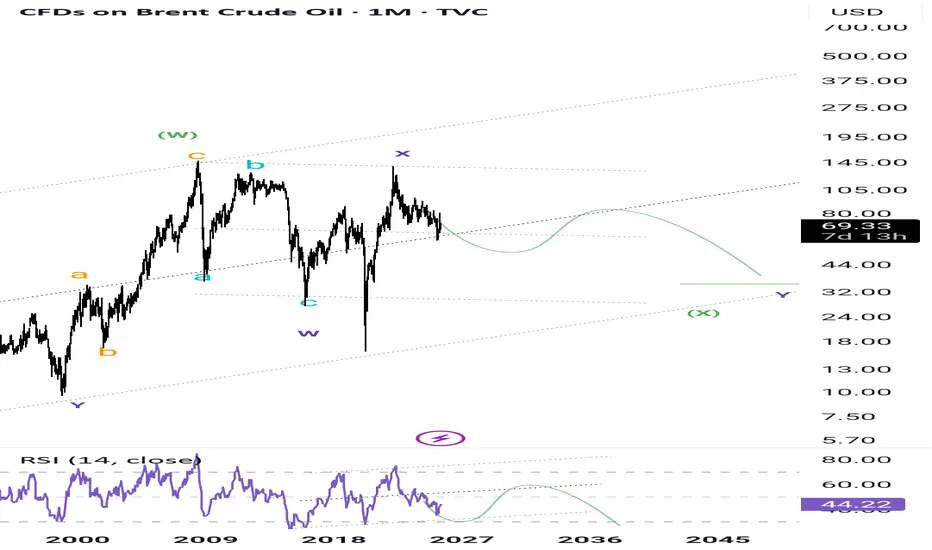
Oil Brent I think Brent oil will make another low and then rise again to the $90 range and then have a sharp correction.
Majidbabaeiasl Tehran iran
1404 / 05/02
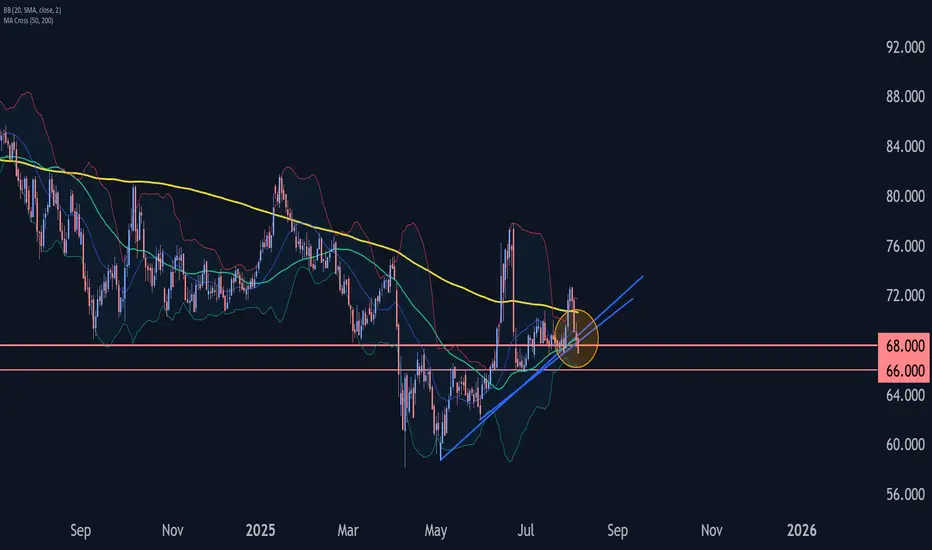
Brent Crude Oil Wave Analysis – 5 August 2025- Brent Crude Oil broke support zone
- Likely to fall to support level 66.00
Brent Crude Oil recently broke the support zone between the key support level of 68.00 (which reversed the price multiple times in July) and the two support trendlines from May.
The breakout of this support zone accelerat
XBRUSD Robbery Setup: Thief's Bear Trap is Active! 🔥💰BRENT BEARISH HEIST PLAN💰🔥
🎯 Asset: XBRUSD / UK Oil Spot / BRENT
🧠 Strategy: Layered Limit Orders | Bearish Robbery in Progress
💼💣💼
Yo Money Movers & Market Jackers!
It’s time to load up the truck and roll out — the BRENT vault is cracked open and dripping with bearish loot! 🐻💵🔓
🎩 This isn’t just

See all ideas
Displays a symbol's price movements over previous years to identify recurring trends.