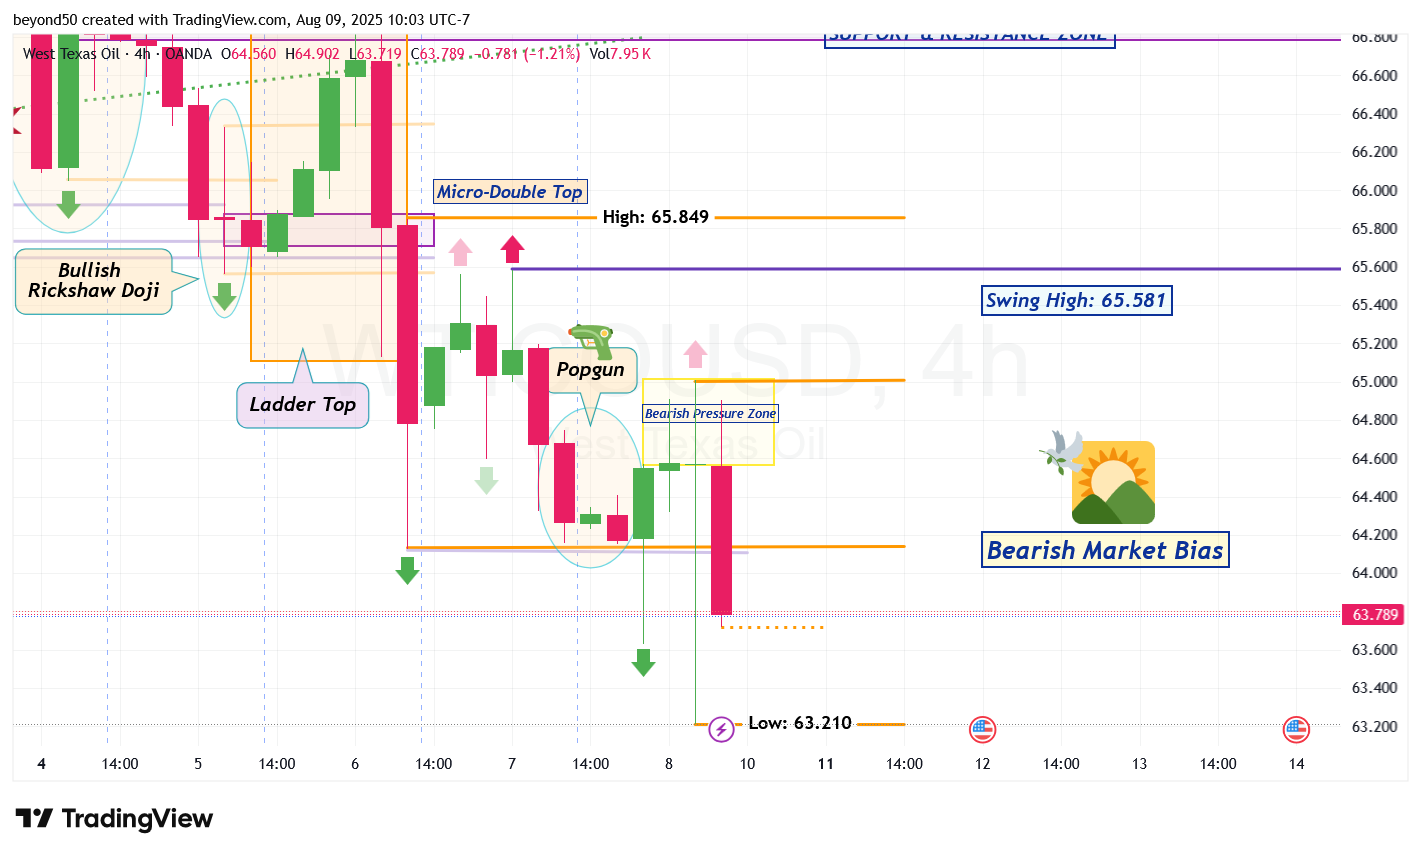
WTICOUSD For Sunday's Session: Taking a look at the 4-Hour timeframe, the bearish drop was from a Bearish Pressure Zone (that formed from the upper wicks of three candles in succession).
Look at the last bearish candle's low of 63.719 (that is an orange dotted line). If a bearish candle shows up to close past it, and then another bearish candle "clears" past the dotted line without ever touching it with a wick or real body (that creates the open and close prices), that means the intent is to continue the descent. But if one or both bearish moves don't happen, the bulls can show up to rally in a BIG way.
*Side Note: A giant W-shaped pattern is forming with the last and 4th leg, typically being a long bullish trend.
USOIL Reduced short to remaining 30%. Trump's date with Putin is unpredictable, and yes, his hair and nails may be impeccable, but is it enough to impress Putin?
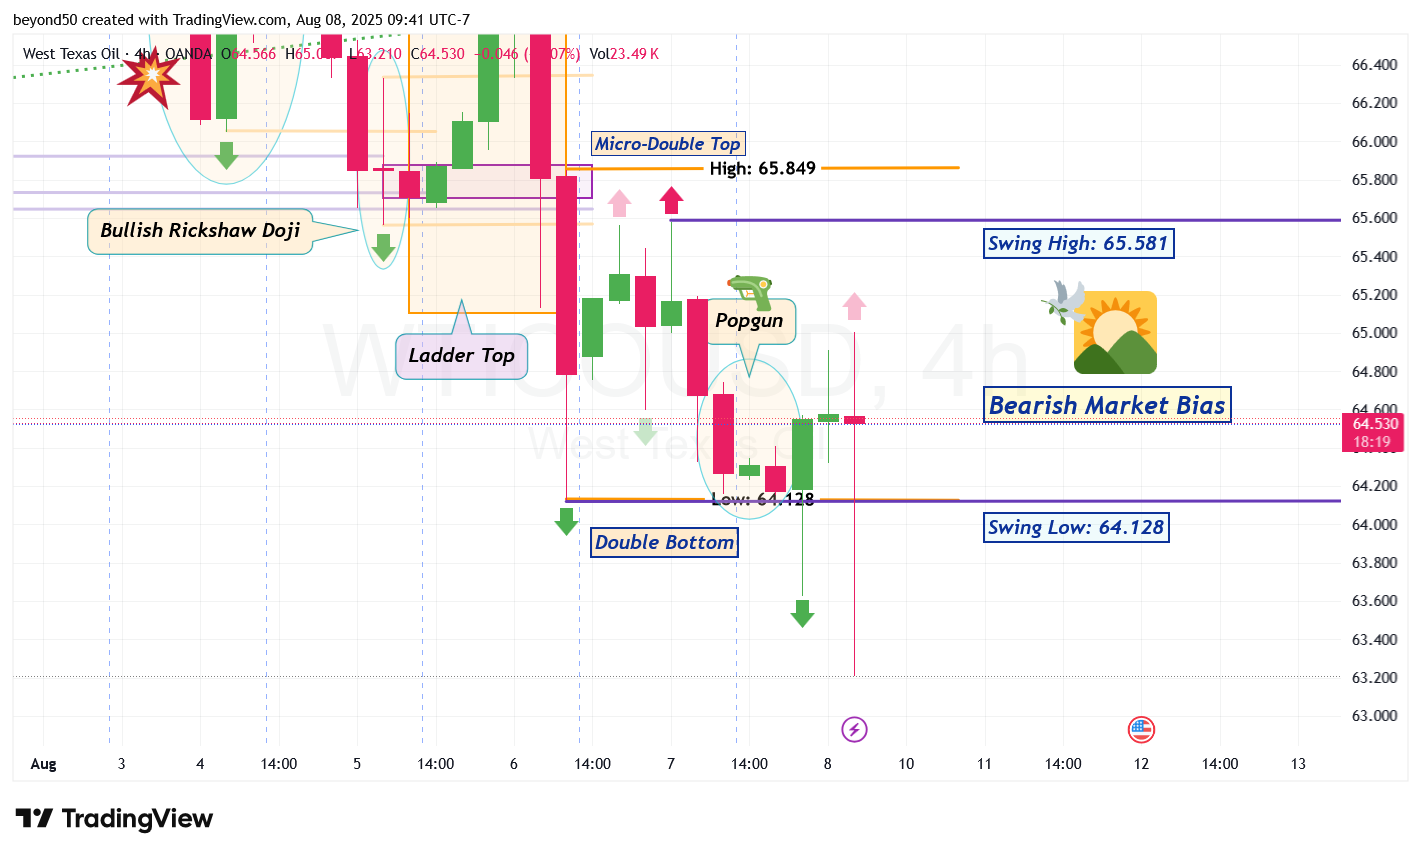
WTICOUSD Switching to the 4-Hour, a Popgun pattern formed earlier during the After Hours. This shows up during times of high volatility. It often leads to 3 major swings that leads to complex consolidation. Price action will move like a See-Saw. Here's the sequence of swings: Down-Up-Down.
The down, then up move already happened. We'll eventually see the last candle pivot to swing the market to the downside.