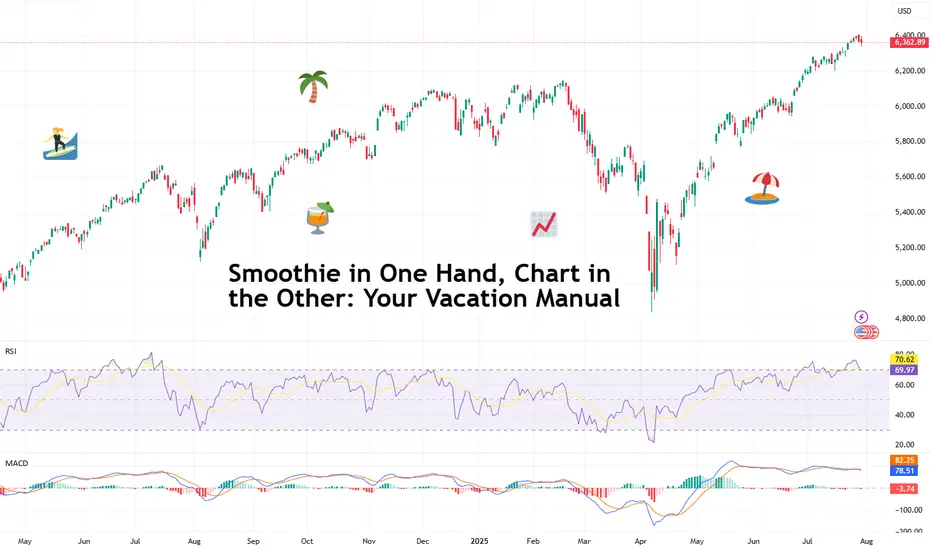
Smoothie in One Hand, Chart in the Other: Your Vacation ManualSome traders bring a beach read. Others bring their TradingView charts.
It’s the heat of the summer and we figured, why not take it easy with a breeze of lightweight lines to pair with your mezcal espresso martini? Let’s talk about how to relax while still watching the markets.
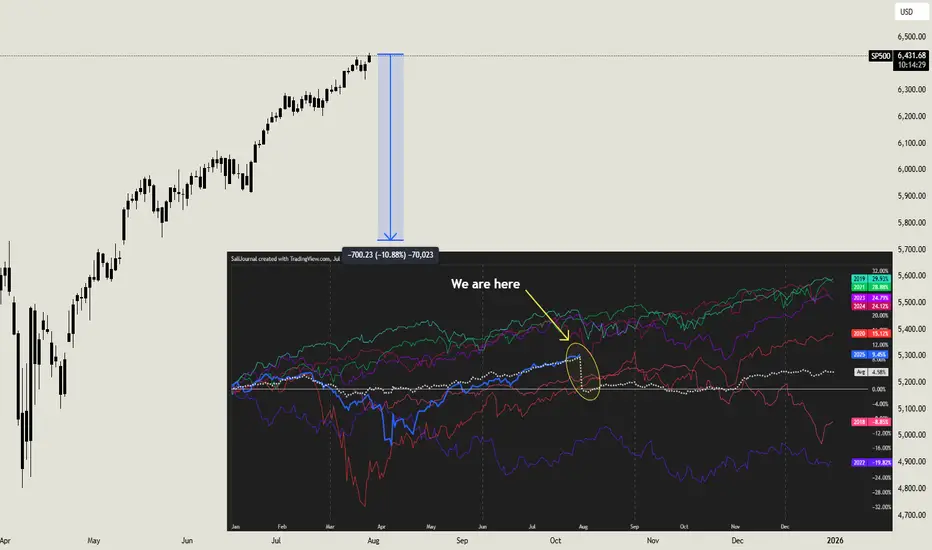
🏄♂️ Market Neve
About S&P 500 Index
Standard & Poor’s 500 is an American stock market index consisting of 500 large companies having common stock listed on the NYSE or NASDAQ and their market capitalizations. It captures approximately 80% coverage of available market capitalization. Because it includes both growth stocks and value stocks it is one of the most followed equity indices and is considered to be one of the best representations of the U.S. stock market and a trend indicator for the U.S. economy. S&P introduced its first index in 1923 and its present day form on March 4,1957. It was developed and continues to maintained by S&P Dow Jones Indices, a joint venture majority owned by McGraw Hill Financial.
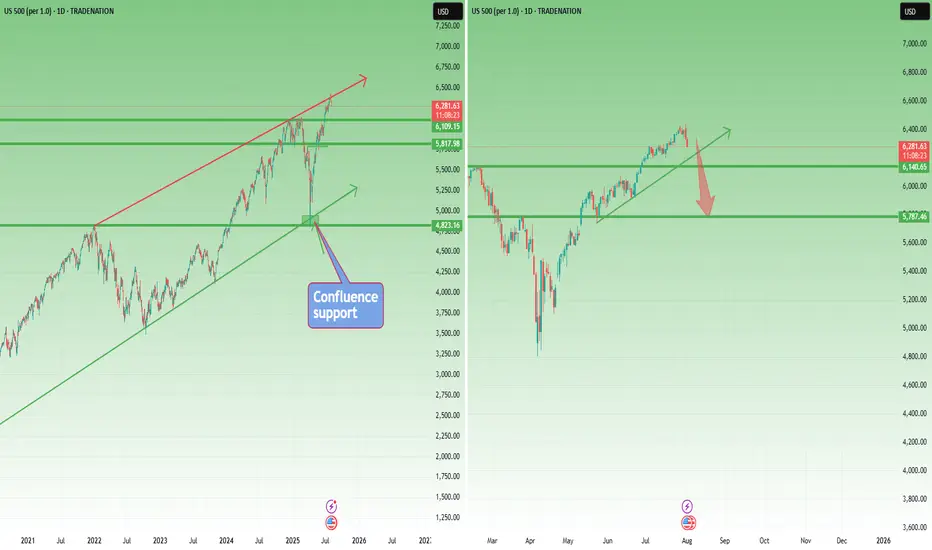
S&P 500 Bullish Rounding Bottom in PlayS&P 500 continues its upward trajectory, supported by a clearly defined rounding bottom formation. Price has successfully broken above the neckline resistance, followed by a technical pullback which was met with a strong buy reaction, validating this zone as a key demand area.
This pullback area no

Correction Ahead? SP500 Prints Reversal Signal at Key Resistance📘 This market moves like a textbook chart
SP500 is acting like a perfect case study from a trading manual. Back in early April, the index dipped just below 5,000, right into a confluence support zone ( I had spoken about this at the time ) – formed by the long-term ascending trendline and the 202
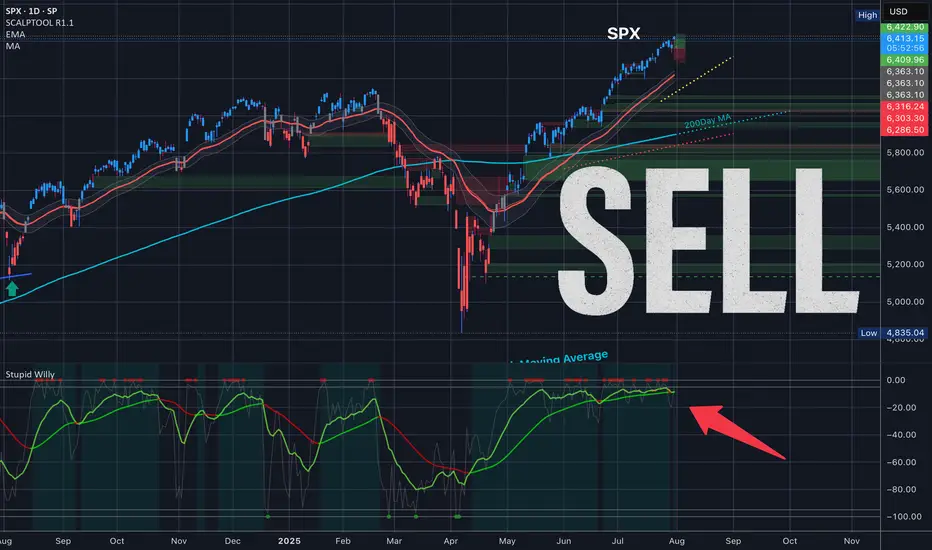
$SPY $SPX SELLIt is time. For SPX today I sold SP:SPX 6420/6435 bear call spreads here. First order filled for 7.20, Back up orders at 6430/6445.
SP500 reinforcing a bearish short-term trendThe S&P 500 retreated in the final session of July, weighed down by renewed tariff concerns and ongoing uncertainty surrounding the Fed’s next policy move. Despite the late pullback, the index remains positive for the month overall.
From a technical perspective, the index has declined approximately

S&P 500 Obeying Elliott Wave TheoryThis is an update of a previous publication. A Flat occurred for Wave 2(Green) and if Wave 3 is over, we can expect a Zigzag for Wave 4. Zigzags have 3 waves. A confirmation at its current location will trigger a sell for Wave 4(Green).
For more information on the same, go to:

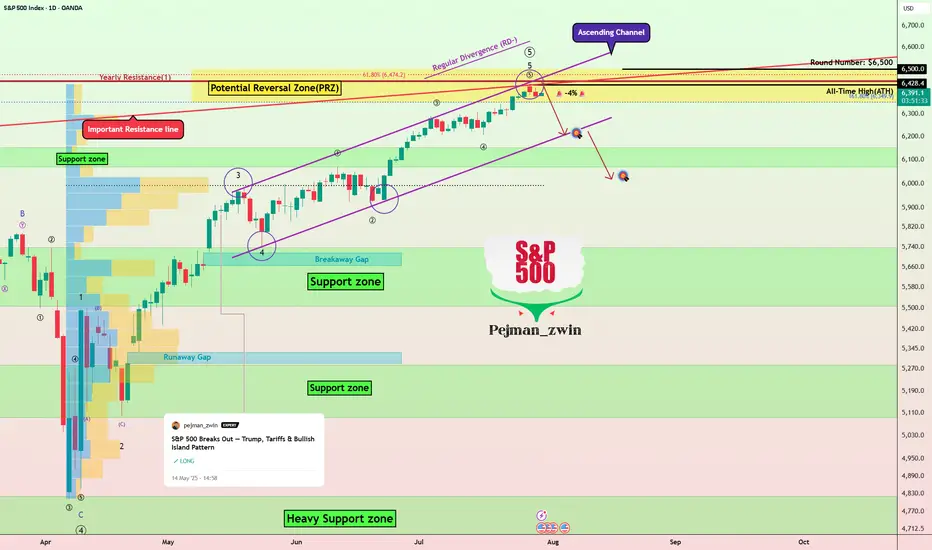
S&P500’s Bullish Island Turns Risky: Elliott Wave Says “Top”The S&P500 Index( SP:SPX ) started to rise and even created a new All-Time High(ATH=$6,428) with the help of the Bullish Long Island Pattern , as I published in my previous idea on May 14, 2025 .
The S&P500 Index is currently moving near the Potential Reversal Zone(PRZ) , upper line of the
Here is WHY SP500 WILL SINK and you should SELL!I already made a techincal analysis on SP500 last week. Here i am again trying to warn you. I have a big convinction that SP500 will sink, and pretty hard. Lot of techincal indicator are showing weakness on the daily timeframe (RSI, MACD, AO, OBV), the political situation is getting complicated day
A pullback planThe upper trendline starts from Jan 2022 peak. It was broken on normal scale but still holds on log scale. The price may top here or may go higher. In a very bullish scenario the price may bounce much higher from an upper 1W FVG, but I think it will be broken soon. In any case I see a strong support
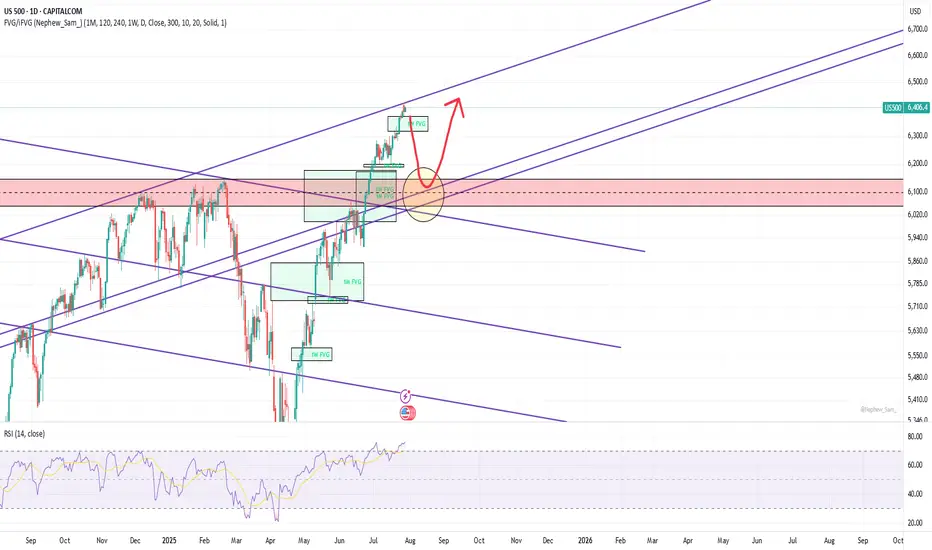
US500 Bearish Idea: Waiting for Structure Break ConfirmationWatching the SPX US500 right now 📈 — it’s rallied hard with strong momentum and is pushing into a key resistance level ⚠️. Since price is overextended, I’m expecting a pullback towards equilibrium on the current move 🔄. My bias is bearish from this level 🔻, with entry dependent on a break in structu

See all ideas
Displays a symbol's price movements over previous years to identify recurring trends.
Frequently Asked Questions
S&P 500 Index reached its highest quote on Jul 31, 2025 — 6,435.90 USD. See more data on the S&P 500 Index chart.
The lowest ever quote of S&P 500 Index is 1,818.90 USD. It was reached on Oct 15, 2014. See more data on the S&P 500 Index chart.
S&P 500 Index is just a number that lets you track performance of the instruments comprising the index, so you can't invest in it directly. But you can buy S&P 500 Index futures or funds or invest in its components.