This article analyzes the price behavior of the SUI token against the US Dollar (USD) on a weekly chart using key technical tools such as trendlines, Fibonacci retracement/extension, moving averages (EMA), and momentum indicators like Stochastic RSI and traditional RSI. These tools help interpret the market structure, identify key support/resistance levels, and assess potential price direction in the medium to long term.
1. Overall Chart Structure and Initial Outlook
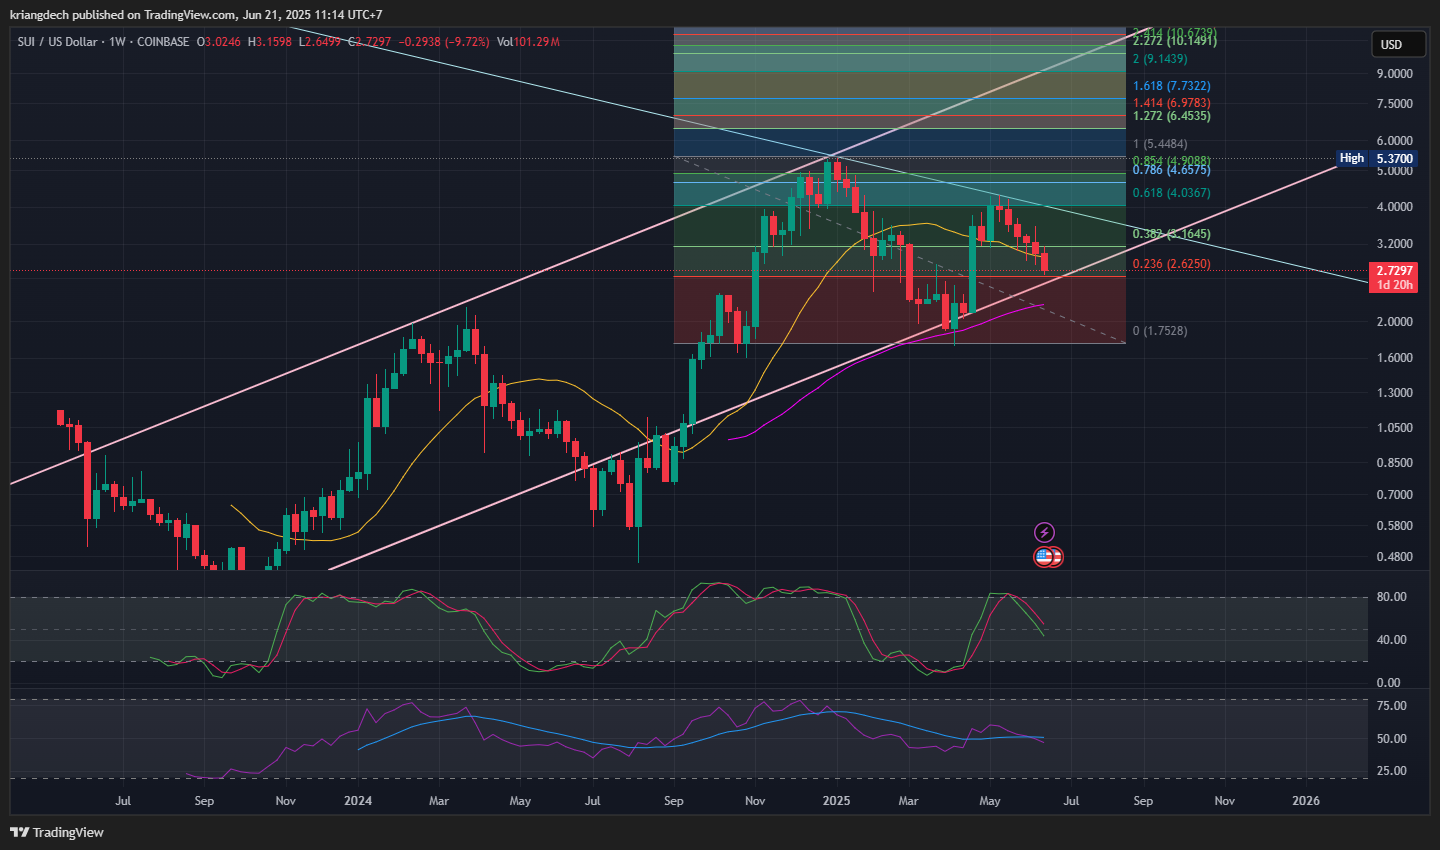
SUI has shown a clear uptrend pattern since late 2023 after reaching a low around $0.58–$0.60. It then rebounded and entered an ascending channel that significantly influenced the 2024 bullish trend. However, by mid-2025, price action reveals that SUI is encountering resistance at key Fibonacci levels and has started pulling back.
Key technical elements in the chart include:
Ascending channel (pink lines)
Descending trendline (white/gray), representing medium-term resistance
Fibonacci levels measured from the $1.75 low to the $5.37 high
EMA indicators
Momentum indicators such as Stochastic RSI and RSI
2. Interpretation of Trendlines
Ascending Channel (Pink):
This channel began in Q4 2023 and reflects a pattern of higher highs and higher lows. The lower boundary has acted as dynamic support multiple times, especially between late 2023 and early 2024.
Recently, the price has fallen from the upper half of the channel and is now moving near its midline. If the lower boundary holds, the uptrend could continue. However, a breakdown below this level may indicate the start of a structural weakening.
Descending Trendline (White):
This line connects lower highs, reflecting continued selling pressure. It intersects with horizontal resistance at approximately $3.64 (Fib 0.382), forming a strong confluence zone. For a bullish reversal, price must break above this level decisively.
3. Fibonacci Analysis
The Fibonacci retracement is drawn from the $1.75 low to the $5.37 high to determine major support and resistance levels.
Fibonacci Level
Price
Interpretation
0.236
≈ $2.62
Current support, some buying interest present
0.382
≈ $3.64
Strong resistance, overlapping descending trendline
0.618
≈ $4.03
Major resistance from the prior rally
0.786–0.854
≈ $4.63–$4.98
Last resistance band before retesting previous high
1.0
≈ $5.37
Peak of this cycle
1.272 / 1.618 / 2.0
$6.45 / $7.73 / $9.14
Long-term targets if price breaks the high
2.272
≈ $10.14
Ultimate extension target in strong uptrend
Currently, the price is near the 0.236 level, a preliminary support zone. A drop below $2.62 may prompt a test of $2.00–$2.20 or even $1.75. Conversely, a decisive breakout above $3.64 may restore upward momentum.
4. Moving Averages and Dynamic Support
Key EMA lines in the chart:
10-week EMA (Yellow): Starting to slope downward, signaling weakening short-term momentum and acting as resistance.
50-week EMA (Purple): Still trending upward, providing strong medium-term support. Staying above this level keeps the long-term structure intact.
5. Momentum Indicator Analysis
Stochastic RSI:
Declining from the overbought zone → Indicates a short-term consolidation or pullback.
Traditional RSI:
Still above 50 but flattening → Suggests fading momentum and reduced buying strength compared to previous phases.
Overall, these signals point to a likely short-term pause or sideways movement before the next major move.
6. Possible Trend Scenarios and Strategies
Bullish Case:
Condition: Price holds above $2.62 and breaks above $3.64.
Targets: $4.03 → $4.63–$4.98 → $5.37, with long-term potential to $6.45–$7.73
Strategy: Enter long upon breakout at $3.64 with increased volume, and add above $4.00
Sideways Case:
Condition: Price moves within the $2.62–$3.64 range
Strategy: Buy near $2.60–$2.70, take profit near $3.60–$3.70
Bearish Case:
Condition: Price drops below $2