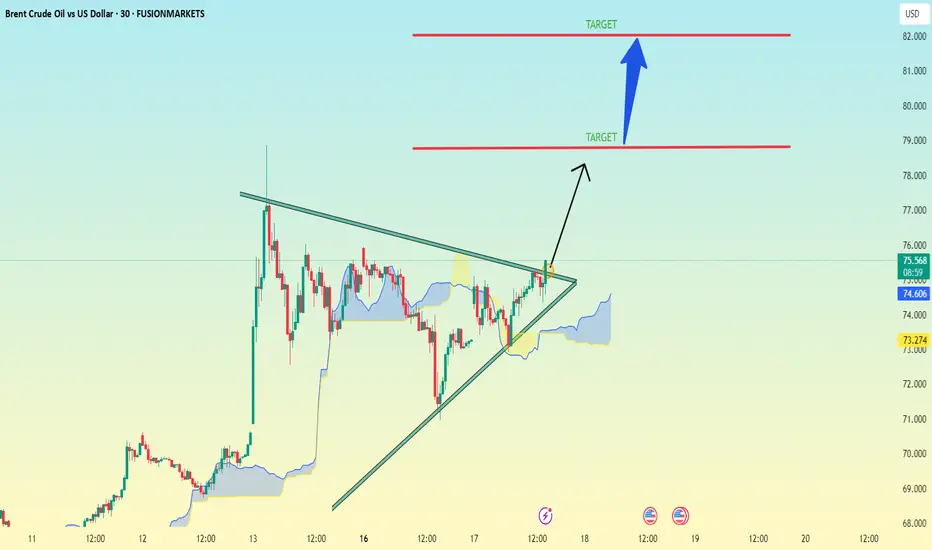
XBR/USD.30M CHART PATTERN.(XBRUSD) on the 30-minute timeframe, here’s the technical outlook:
Chart Pattern Observed:
You have a symmetrical triangle breakout setup:
The price is currently breaking above the triangle resistance.
There’s a bullish bias post-breakout with two targets marked.
Targets Identified on Your Chart:
1. First Target: ~$79.00
2. Second Target: ~$81.50
These are based on the typical triangle breakout projection, where:
The height of the triangle is measured and added to the breakout point.
The first target often aligns with a conservative measure.
The second target aims for the full projection of the pattern height.
Current Price: ~$75.32 (as shown)
Confirmation:
To validate this breakout:
Watch for a candle close above the triangle resistance.
Confirm with volume increase or continued momentum.
Stop-loss is ideally below the triangle support, near ~$73.00.
Let me know if you want risk/reward calculations or a similar setup on a different asset.
UKOIL trade ideas
Geopolitics vs. Technical: Will Oil Correct -7%?Oil ( FX_IDC:USDBRO ) rose more than +20% after the start of tensions between Iran and Israel on Friday . I hope this tension ends as soon as possible because tensions have no winners.
The behavior and price movements of oil will certainly depend on the increase or decrease of tensions in the Middle East , but for the coming hours we can have a technical view .
Oil is currently moving in the Resistance zone($78.70-$74.70) and near the Resistance lines and the Yearly Pivot Point .
In terms of Elliott Wave theory , it seems that Oil has completed the second five-impulse waves . So that wave 5 is Truncated .
I expect Oil to decline in the coming hours, this decline could be -7% .
Note: If the USA is added to the Middle East tensions, Oil prices could rise again, so pay more attention to capital management.
Note: Stop Loss: $79.00
Please respect each other's ideas and express them politely if you agree or disagree.
U.S. Dollar/ BRENT CRUDE OIL (USDBRO), 4-hour time frame.
Be sure to follow the updated ideas.
Do not forget to put a Stop loss for your positions (For every position you want to open).
Please follow your strategy and updates; this is just my Idea, and I will gladly see your ideas in this post.
Please do not forget the ✅' like '✅ button 🙏😊 & Share it with your friends; thanks, and Trade safe.

XBR/USD Chart Analysis: Oil Price Falls After Trump’s DecisionXBR/USD Chart Analysis: Oil Price Falls After Trump’s Decision
As shown on the XBR/USD chart, the price of Brent crude oil has pulled back from yesterday’s 4.5-month high following a statement from the White House that President Donald Trump will make a decision within the next two weeks on whether the United States will take part in the Israel-Iran conflict.
According to Reuters, the US President is facing backlash from some members of his team over the prospect of launching a strike against Iran, which could drag the US into yet another prolonged war.
Technical Analysis of the XBR/USD Chart
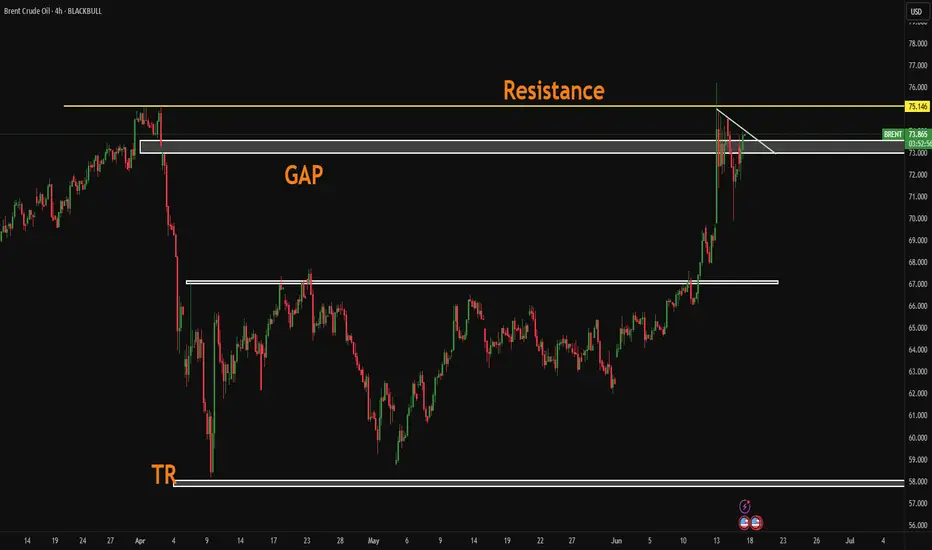
From a technical standpoint, Brent crude oil price is developing within an upward channel (marked in blue), though several bearish signals are appearing on the chart:
→ a bearish gap that formed overnight;
→ a false bullish breakout (indicated by an arrow) above the $76.50 level, drawn from the 13 June high;
→ bearish divergence on the RSI indicator;
→ a break of the recent local ascending trendline (marked in orange).
Given the steep angle of the rising blue channel, it is reasonable to assume that bears may attempt to break through its lower boundary, which is currently acting as support. Whether this scenario materialises in the oil market will largely depend on developments in the Middle East.
This article represents the opinion of the Companies operating under the FXOpen brand only. It is not to be construed as an offer, solicitation, or recommendation with respect to products and services provided by the Companies operating under the FXOpen brand, nor is it to be considered financial advice.

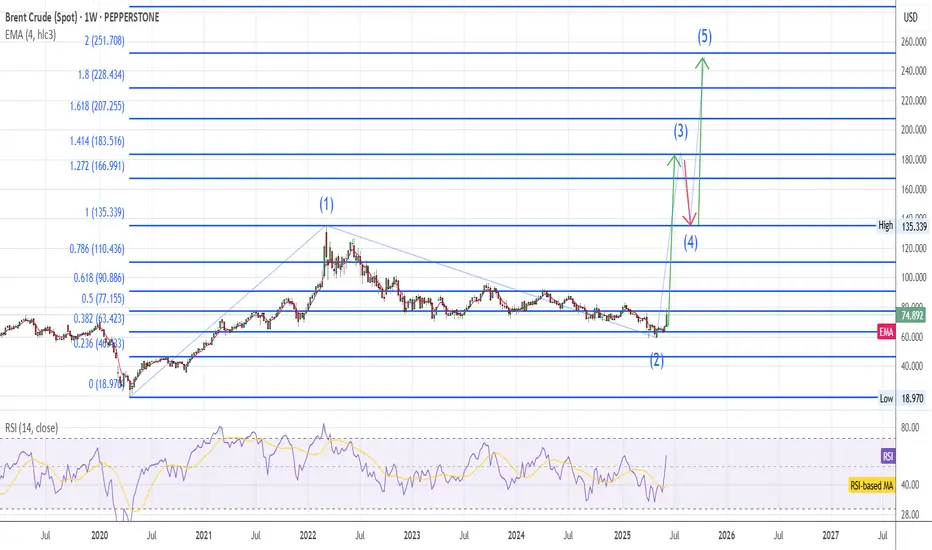
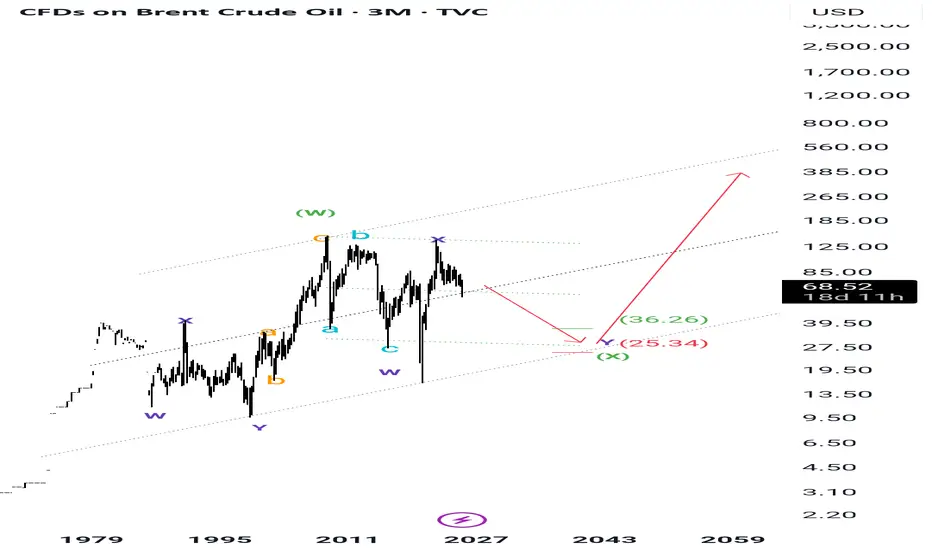
Brent UpdateOn the long term chart wave #2 was completed in the last 2 weeks and wave #3 ha started, I expect massive bullish move for Brent due to Israel-Iran conflict , target 255$
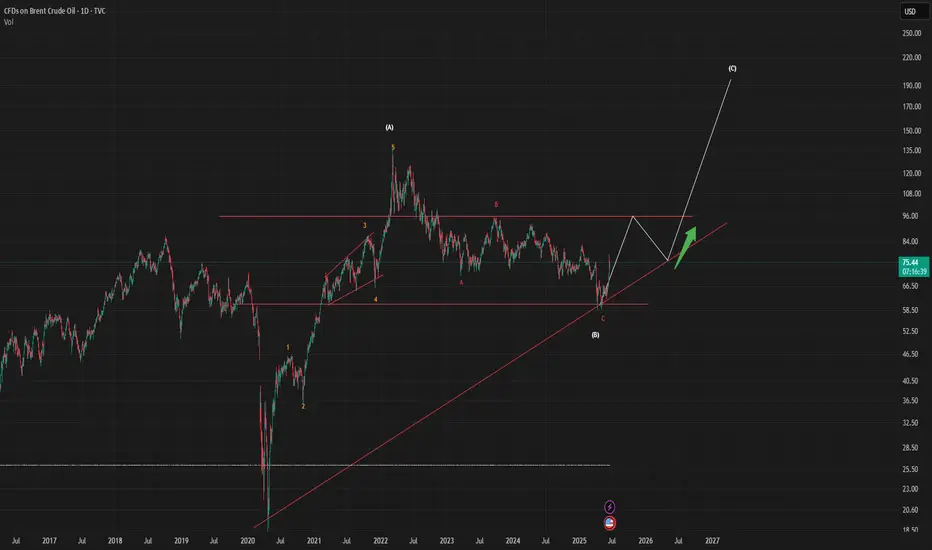
Time for a Rise in Oil Prices $$$When analyzing the recent movements in oil prices through the lens of Elliott Wave Theory, it appears that the current structure is completing an ABC corrective formation.
Initially, the A wave has developed as a strong upward 1-5 impulse structure.
The B wave evolved through a classic ABC correction, pushing prices down to the support area marked as (B).
Following this correction, early signals indicate the initiation of the C wave.
In this context, the technical structure suggests a potential new upward momentum in oil prices with the activation of the C wave. The target zone for the C wave should be monitored in consideration of the existing trendlines and historical resistance levels.
Nevertheless, under the current market conditions characterized by high volatility, it is critical to monitor volume and momentum indicators to confirm the C wave and ensure key support levels are maintained.
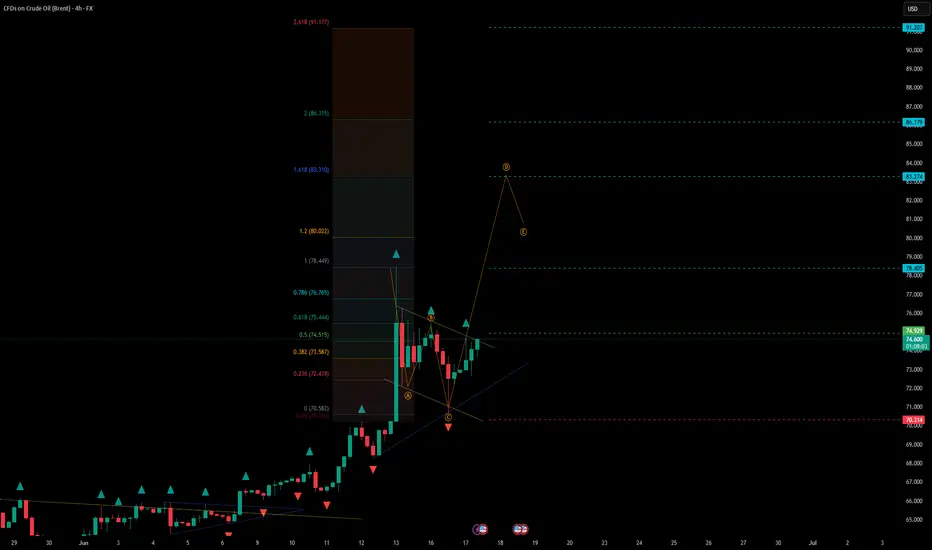
BRENT - UniverseMetta - Signal#BRENT - UniverseMetta - Signal
H4 - Breakout of the trend line + formation of ABC structure in continuation of the uptrend. It is better to reduce risks. Stop behind the minimum of wave C.
Entry: 74.929
TP: 78.405 - 83.274 - 86.179 - 91.207
Stop: 70.314
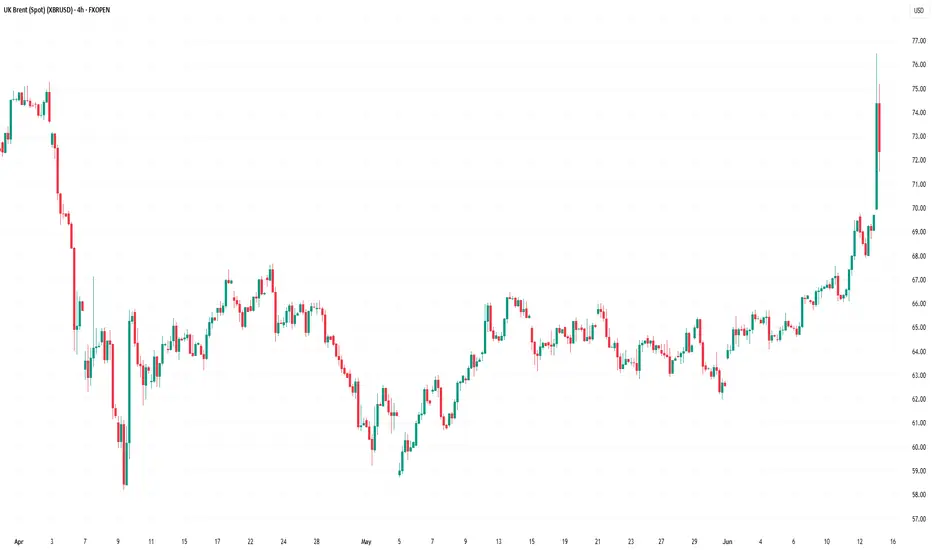
Oil’s Surge Stalls at Descending TrendlineLast week’s surge in crude oil following the escalating conflict in the Middle East sparked a wave of momentum buying as traders responded to the rising risk premium. But with prices now testing a key technical barrier, let’s take a look at whether this rally has legs or if it’s already starting to fade.
Escalation Risk Remains, but Has the Market Overreacted?
The threat of a wider conflict in the Middle East has brought renewed focus on Iran and the Strait of Hormuz. Roughly 20% of the world’s oil flows through that narrow waterway, and fears it could be disrupted are never far from traders’ minds. While there’s no shortage of tension, and risks remain elevated, actual supply has not yet been affected in any material way. Tankers continue to move through the region, albeit more cautiously, and there are signs of behind-the-scenes pressure to prevent further escalation.
In that context, the initial spike may have been more about emotion than fundamentals. Markets are forward-looking, but they can also overreact. Unless there is a clear supply shock or direct disruption to infrastructure, the recent jump could start to lose steam as attention shifts back to broader economic factors. For now, it feels like much of the premium is already priced in.
Technicals: Rally Meets Resistance
The breakout last week saw crude oil push beyond a prolonged consolidation phase, catching the attention of short-term traders. However, strong trends take time to reverse, and the rally has now run into the descending trendline that maps the swing highs from April and January. That trendline held firm on the first test, and momentum has started to waver.
Yesterday’s session opened with a gap higher but couldn’t push above Friday’s high. Instead, prices pressed briefly into the trendline before reversing and closing lower on the day — a sign of short-term exhaustion. On the hourly chart, we’ve now got the early shape of a double-top pattern forming, which often suggests a loss of bullish conviction at resistance.
Given the elevated macro risk, volatility is likely to remain high. Traders looking to participate here should consider using the Average True Range to size their stops more effectively. With the rally showing signs of fading and resistance still intact, near-term price action looks vulnerable to further cooling unless the trendline is taken out decisively.
Brent Crude (UKOIL) Daily Candle Chart
Past performance is not a reliable indicator of future results
Brent Crude (UKOIL) Hourly Candle Chart
Past performance is not a reliable indicator of future results
Disclaimer: This is for information and learning purposes only. The information provided does not constitute investment advice nor take into account the individual financial circumstances or objectives of any investor. Any information that may be provided relating to past performance is not a reliable indicator of future results or performance. Social media channels are not relevant for UK residents.
Spread bets and CFDs are complex instruments and come with a high risk of losing money rapidly due to leverage. 85.24% of retail investor accounts lose money when trading spread bets and CFDs with this provider. You should consider whether you understand how spread bets and CFDs work and whether you can afford to take the high risk of losing your money.
Brent OilGiven the conflicts in the Middle East, I think oil could reach $90. I hope that doesn't happen. What do you think? This is my analysis of oil. I think the upward trend will continue.
XRPUSD is moving within the 2.1215 - 2.3370 range👀 Possible scenario:
XRP is consolidating between $2.05 and $2.40, forming a bullish pennant on the weekly chart — similar to the 2017 setup before a 1300% rally. Analyst Mikybull Crypto predicts a 530% surge to $14 if resistance breaks. For continued upside, XRP must break above the 200-day SMA ($2.37) and hold above $2.65. RSI has climbed from 29 to 52, signaling recovery. A breakout above $2.65 could lead to $3.00 or even the 7-year high of $3.31. Failure to break $2.37 may send price back to $2.05.
Network activity is surging: XRPL is averaging 295K daily active addresses — 7x the 3-month average. Whale wallets (holding 1M+ XRP) hit a record 2,708, signaling growing institutional interest. Trident Digital plans a $500M XRP treasury, Circle launched USDC on XRPL, and Guggenheim is issuing digital commercial paper on the network. A spot XRP ETF approval could drive price to $25. Trading volume jumped 245%, open interest rose to $4.02B, and derivatives volume hit $9.8B. Price hovers around $2.22 as the market reacts to on-chain momentum.
✅Support and Resistance Levels
Support level is now located at 2.1215
Now, the resistance level is located at 2.3370.
Israel Strikes Iran. Oil and Gold Prices SurgeIsrael Strikes Iran. Oil and Gold Prices Surge
According to media reports, Israel launched a large-scale overnight strike on Iranian territory, targeting dozens of military and strategic facilities linked to the country’s nuclear programme and missile capabilities. Israeli officials justified the action by citing an existential threat from Tehran, which, according to their intelligence, is accelerating its development of nuclear weapons and expanding its arsenal of ballistic missiles.
In response, Iran has vowed severe retaliation, stating that the United States and Israel will “pay a heavy price” for the attack. US President Donald Trump has urgently convened a meeting to assess the situation.
Commodities Market Reaction
In the wake of these developments, gold — the primary safe-haven asset — surged sharply. The XAU/USD price broke above its May high, rising past $3,440. However, the all-time high near $3,498 remains intact for now.
Oil prices also spiked due to fears of supply disruption. The military conflict threatens shipping through the Strait of Hormuz, a crucial chokepoint through which one-fifth of the world’s oil supply passes. Traders quickly priced in the risk of war, anticipating a supply shortage driven by large-scale instability in the Middle East.
Technical Analysis of the XBR/USD Chart
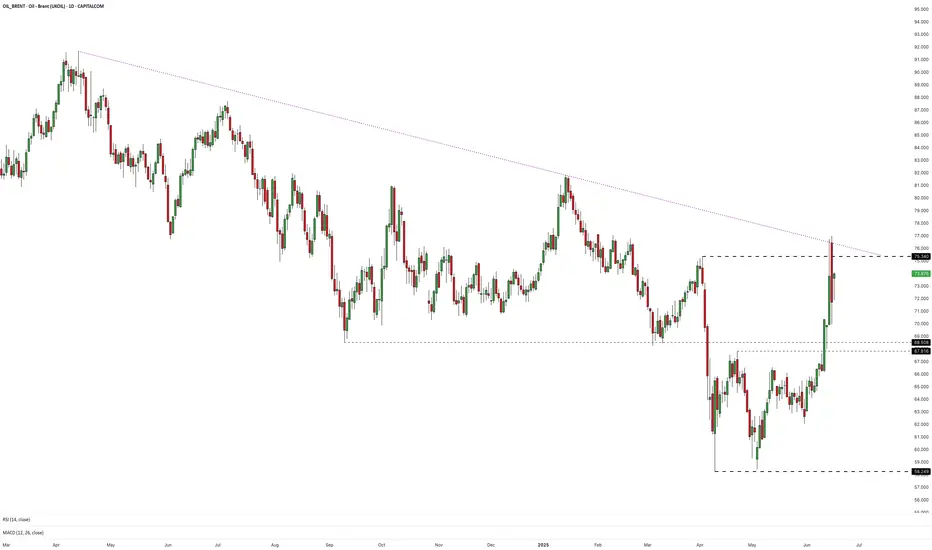
Brent crude oil price has risen to the upper boundary of a large-scale descending channel (shown in red), which is defined by lower highs from 2024–2025. As anticipated, this upper boundary acted as resistance, with the price forming a peak above $76 before reversing downward (as illustrated by the black arrow).
From a technical standpoint, following such a sharp rally, Brent is vulnerable to a corrective move. In this scenario, a pullback into the orange zone is possible, where support may be found at:
→ The psychologically important $70 level;
→ The 50% Fibonacci retracement level;
→ The former resistance of the purple descending trendline, now turned support.
Nevertheless, given the scale of the geopolitical threat, it is unlikely that market sentiment will allow Brent to decline significantly in the near term.
This article represents the opinion of the Companies operating under the FXOpen brand only. It is not to be construed as an offer, solicitation, or recommendation with respect to products and services provided by the Companies operating under the FXOpen brand, nor is it to be considered financial advice.
Oil spikes as Israel strikes Iran: What traders need to knowOil prices surged after Israel attacked Iran’s nuclear sites, reversing the recent downtrend and reigniting inflation fears. In this video, we break down the chart patterns, explain the move, and explore what could come next. Is this the start of a new uptrend or just a short-lived spike? Watch for key levels, risk management tips, and trading strategy insights.
This content is not directed to residents of the EU or UK. Any opinions, news, research, analyses, prices or other information contained on this website is provided as general market commentary and does not constitute investment advice. ThinkMarkets will not accept liability for any loss or damage including, without limitation, to any loss of profit which may arise directly or indirectly from use of or reliance on such information.

XBR/USD Chart Analysis: Brent Crude Reaches 1.5-Month HighXBR/USD Chart Analysis: Brent Crude Reaches 1.5-Month High
In our analysis of Brent crude oil six days ago, we identified a large contracting triangle and a local ascending channel. We also outlined a potential scenario involving a bullish breakout above the upper boundary of the triangle.
Although this was not the base-case scenario, the XBR/USD chart now suggests it has played out: yesterday, the price climbed to nearly $67 per barrel — its highest level since the end of April.
The main bullish catalyst appears to be ongoing trade talks between the United States and China, which have raised hopes of a resolution to tariff-related tensions between the world’s two largest economies.
At the same time, rising oil prices may exacerbate geopolitical tensions, particularly amid Israeli threats to strike ports in Yemen — a risk that could disrupt supply chains across the Middle East.
Technical Analysis of the XBR/USD Chart
From a technical perspective:
→ Brent crude continues to move within an ascending channel (marked in blue);
→ the upper boundary may now act as a support level.
The fact that the price is holding in the upper half of the channel indicates strong demand-side pressure. Based on this, it is reasonable to assume that as long as Brent remains above the $65.75 level (the retest zone of the breakout), the technical outlook will remain predominantly bullish.
This article represents the opinion of the Companies operating under the FXOpen brand only. It is not to be construed as an offer, solicitation, or recommendation with respect to products and services provided by the Companies operating under the FXOpen brand, nor is it to be considered financial advice.

Oil Brent Brent oi
According to the trend I see, Brent oil will probably drop to the $25 range, and it will be due to the reduction in tensions between Iran and the United States.
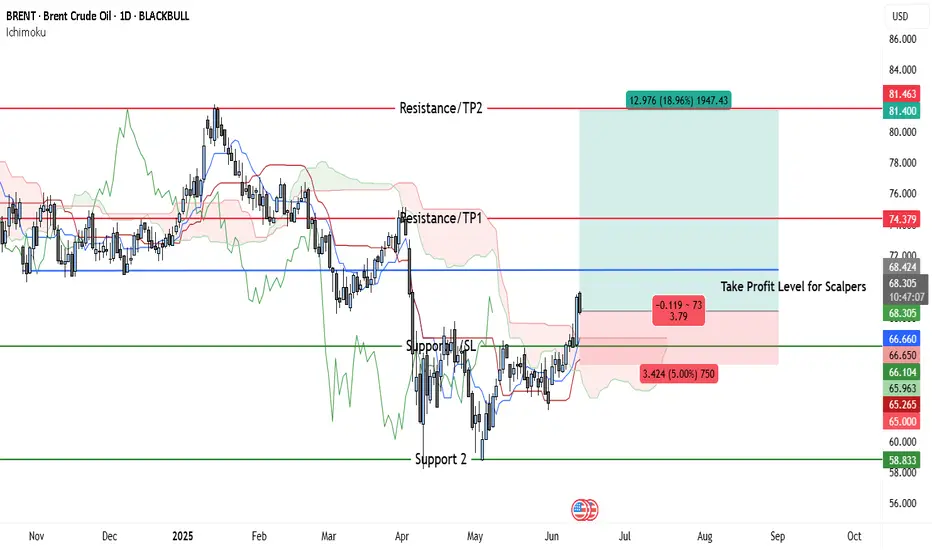
Brent Bulls Eye $74 & $81 — 2 Profit Points, 1 Tight StopBrent crude has confirmed a bullish breakout on the daily chart after closing decisively above the key horizontal resistance near $66.65. This level had acted as strong overhead pressure over the last two months but has now flipped into support, reinforcing the bullish sentiment.
Price is currently trading at $68.18, just above the newly established support zone, and showing strength after consolidating in a tight range. The Ichimoku Cloud system further validates this bullish move. The price has cleanly broken through the Kumo (cloud), and the Tenkan-sen has crossed above the Kijun-sen, forming a classic bullish crossover. The Chikou Span is also above the price, indicating momentum is firmly in the bulls’ favor.
The immediate upside target is the $74.38 resistance, which corresponds to a key prior swing high from earlier this year. This zone is expected to act as the first major take-profit level for swing traders. If the bullish momentum persists, the next target lies at $81.40, a previous supply zone and psychological resistance. The path from current levels to that area appears technically open, with relatively little congestion in between.
Risk-reward analysis supports the long setup. Entering near the current price, with a stop-loss just below $66.10, provides a downside risk of around 3%, while the potential upside to TP1 and TP2 offers gains of approximately 9% and 19%, respectively. This yields a favorable R:R of roughly 1:3 to 1:6, depending on the exit strategy.
For scalpers, the area around $68.42 marks an intraday take-profit zone. However, scalpers must adjust their stop-losses dynamically, based on individual risk tolerance. A tighter stop might sit around $66.65, while more conservative scalpers may prefer to give room down to $66.10.
The secondary support around $58.83 marks a major floor but is currently distant and would only be in play if Brent fails to hold $65—an unlikely scenario given current strength and volume.
In summary, Brent crude’s technical structure favors further upside, with bullish momentum confirmed by both price action and Ichimoku alignment. A retest of $66.65 could present a buying opportunity, but failure to hold above that would invalidate the setup. As long as the price stays above the cloud and key supports, the bullish case remains intact.
The Tell all of the conflict between Israel and Iran escalationBreak out of the top range and It's not looking good. Fall back into lower range and we should be gravy for awhile.
Not financial advice. DYOR

Brent Oil Intra-day Analysis 12-Jun-25Drawing possible scenarios we could see on Brent Oil prices.
Keep in mind fundamentals supporting the move up on oil:
* Geopilitical escalations between Russia and Ukraine
* Opec+ production policy
* US - China Trade talks and demand optimisim
* Geopolitical tensions between US and Iran.
Disclaimer: easyMarkets Account on TradingView allows you to combine easyMarkets industry leading conditions, regulated trading and tight fixed spreads with TradingView's powerful social network for traders, advanced charting and analytics. Access no slippage on limit orders, tight fixed spreads, negative balance protection, no hidden fees or commission, and seamless integration.
Any opinions, news, research, analyses, prices, other information, or links to third-party sites contained on this website are provided on an "as-is" basis, are intended only to be informative, is not an advice nor a recommendation, nor research, or a record of our trading prices, or an offer of, or solicitation for a transaction in any financial instrument and thus should not be treated as such. The information provided does not involve any specific investment objectives, financial situation and needs of any specific person who may receive it. Please be aware, that past performance is not a reliable indicator of future performance and/or results. Past Performance or Forward-looking scenarios based upon the reasonable beliefs of the third-party provider are not a guarantee of future performance. Actual results may differ materially from those anticipated in forward-looking or past performance statements. easyMarkets makes no representation or warranty and assumes no liability as to the accuracy or completeness of the information provided, nor any loss arising from any investment based on a recommendation, forecast or any information supplied by any third-party.


Elliot Wave 3 advance just starting in Brent Crude - Target $255Have tried to show and explain my analysis with the written annotation on the chart but, in short, I believe we are witnessing the start of a Wave 3 advance in Brent Crude with a target price of $255.
Just about every other commodity i look at are showing similar indications of major advances just getting started - Silver a perfect example with last weeks major breakout.
The entire commodity complex is signalling major inflation ahead

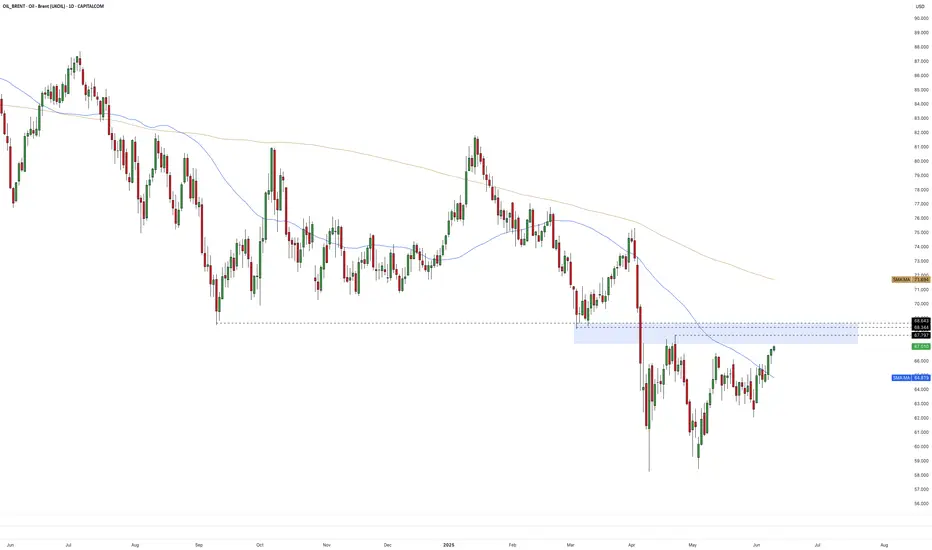
Crude Climbs Back to Key Resistance ZoneOil is back at a key level. After a two-legged recovery from May’s lows, Brent crude is now pushing into a heavy resistance zone that traders will be watching closely. Let’s take a look at what’s driving the move and why this area could matter.
Production Lags Behind the Promise
OPEC’s production rose in May, but not by as much as the latest agreement had set out. Output across the twelve members increased by 150,000 barrels per day compared to April, falling short of the 310,000 barrel boost that was planned. Iraq delivered cuts to offset previous overproduction, while Saudi Arabia and the UAE lifted output but came in under their targets. Saudi Arabia made the largest move, but even that fell short of what was expected.
Analysts at Morgan Stanley pointed out that despite higher quotas between March and June, the actual increase in physical supply is hard to detect. They still expect OPEC+ to add around 420,000 barrels per day between June and September, which could start tipping the market into surplus. For now though, with barrels arriving more slowly than planned, prices have remained supported.
Price Meets Confluent Resistance Zone
From a technical standpoint, Brent’s broader trend remains down. The 50-day moving average is still well below the 200-day and both continue to slope lower. After retesting the April lows in May, the market found support and has rallied in two legs—an initial push higher, a pause, and then a second move up. The RSI has climbed along with it but hasn’t yet reached overbought territory.
This recent rally has now brought price into a cluster of resistance levels that carry weight given the backdrop of the downtrend. Structurally, this zone includes the April swing highs, the March swing lows and, looking back further, the September 2024 floor. Adding to the significance is the VWAP anchored to the January highs, which now sits just above.
Traders who favour trend continuation will be paying close attention here. This is the kind of area where bearish setups often form, especially if price begins to stall or reverse with clear patterns. If the downtrend is going to reassert itself, this resistance zone is a likely place for that to happen.
Brent Crude Daily Candle Chart
Past performance is not a reliable indicator of future results
Disclaimer: This is for information and learning purposes only. The information provided does not constitute investment advice nor take into account the individual financial circumstances or objectives of any investor. Any information that may be provided relating to past performance is not a reliable indicator of future results or performance. Social media channels are not relevant for UK residents.
Spread bets and CFDs are complex instruments and come with a high risk of losing money rapidly due to leverage. 85.24% of retail investor accounts lose money when trading spread bets and CFDs with this provider. You should consider whether you understand how spread bets and CFDs work and whether you can afford to take the high risk of losing your money.
Brent crude oil Wave Analysis – 10 June 2025
- Brent crude oil reversed from key resistance level 67.80
- Likely to fall to support level 64.60.
Brent crude oil recently reversed down from the resistance area between the key resistance level 67.80 (which stopped wave (2) in the middle of April), upper daily Bollinger Band and the 61.8% Fibonacci correction of the downward impulse from January.
The downward reversal from this resistance area stopped the previous short-term ABC correction 2 from the start of May.
Given the strong daily downtrend, Brent crude oil can be expected to fall to the next support level 64.60.

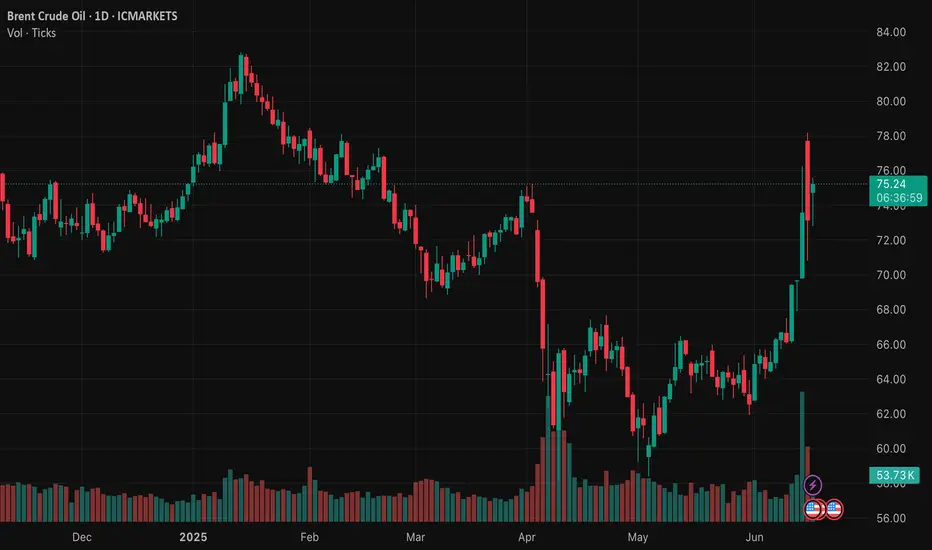
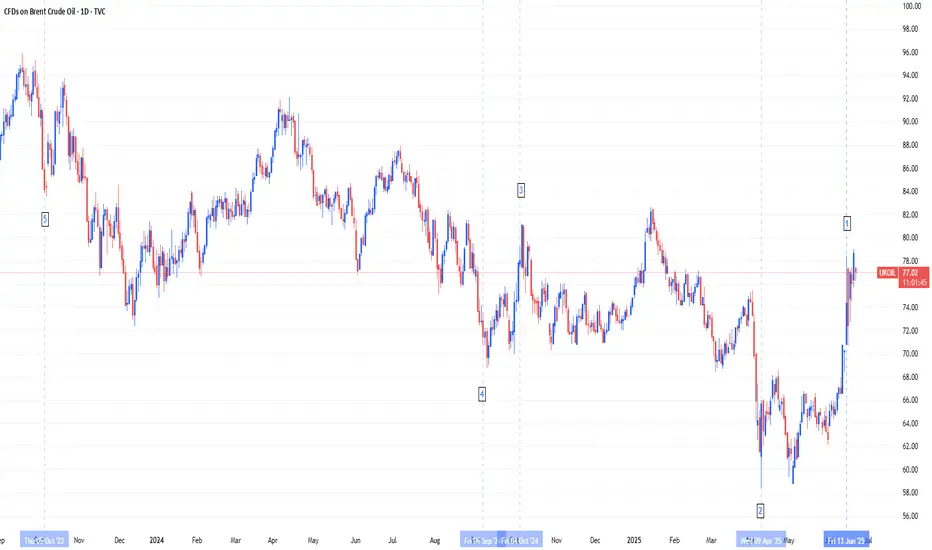
Brent Crude Oil's Defining Moments: Analyzing the Top 5 MovesThe oil market has experienced unprecedented volatility over the past two years, with five pivotal moments generating the most significant price movements in Brent crude.
The Top 5 Market Movers:
1. June 13, 2025 (+7.02%): Israeli airstrikes on Iranian nuclear and oil facilities triggered the largest single-day surge to $74.23/barrel, demonstrating how geopolitical events can instantly drive supply disruption fears.
2. April 8, 2025 (-15.67% over 5 days): Trump's tariff escalation and US-China trade war intensification caused the most severe multi-day decline, ending at $62.82/barrel as traders priced in global economic slowdown.
3. October 7, 2024 (+12.76% over 5 days): Escalating Israel-Iran tensions drove a significant rally to $80.93/barrel as markets built in geopolitical risk premiums ahead of expected retaliatory strikes.
4. September 3, 2024 (-6.41%): Libya's oil dispute resolution combined with weak global demand outlook caused a sharp drop to $73.75/barrel, showing how supply resolutions can trigger selloffs.
5. October 6, 2023 (-11% weekly crash): The end of driving season combined with demand concerns and interest rate fears triggered the biggest weekly decline since March 2023, with Brent falling to $84.07/barrel as gasoline demand hit yearly lows.
Current Fundamental Landscape and Path Forward
The EIA forecasts Brent averaging $66/barrel in 2025 and $59/barrel in 2026, below recent levels due to trade uncertainties and slower growth. Three key factors will drive future prices: US-China trade resolution, Middle East geopolitical risks, and OPEC+'s production strategy. Recent volatility shows that while fundamental supply-demand dynamics remain important, geopolitical events, trade policies, and seasonal demand patterns can generate dramatic price swings that overwhelm traditional market forces.
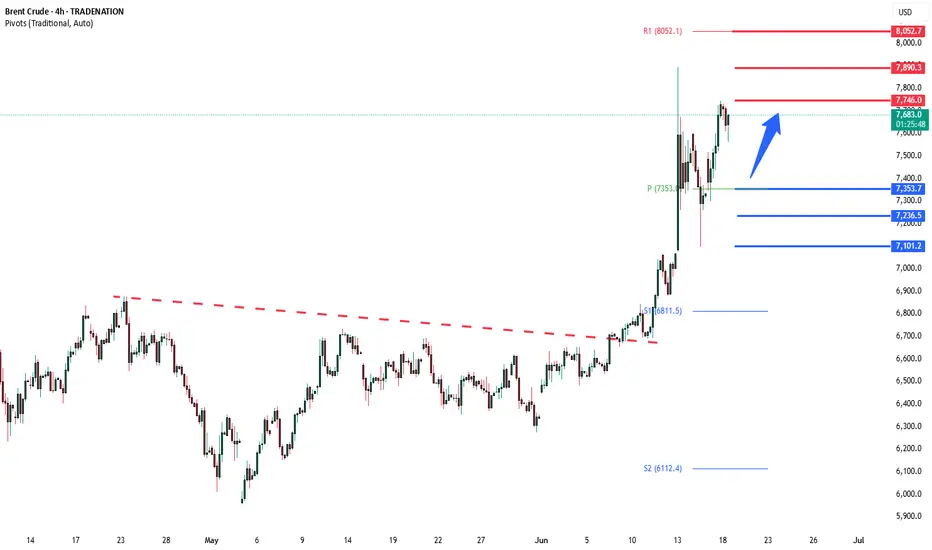
Brent Crude Oil Bullish above 73.50Key Support and Resistance Levels
Resistance Level 1: 77.50
Resistance Level 2: 78.90
Resistance Level 3: 80.50
Support Level 1: 73.50
Support Level 2: 72.30
Support Level 3: 71.00
This communication is for informational purposes only and should not be viewed as any form of recommendation as to a particular course of action or as investment advice. It is not intended as an offer or solicitation for the purchase or sale of any financial instrument or as an official confirmation of any transaction. Opinions, estimates and assumptions expressed herein are made as of the date of this communication and are subject to change without notice. This communication has been prepared based upon information, including market prices, data and other information, believed to be reliable; however, Trade Nation does not warrant its completeness or accuracy. All market prices and market data contained in or attached to this communication are indicative and subject to change without notice.
Brent and WTI: Is $100 oil just Around the corner?#Brent and #WTI prices are steadily climbing, now reaching $73.30 and $71.15 per barrel. The market is showing strong signs of an upward trend, similar to what we saw in 2021–2022. With global demand picking up and increased interest from major market participants, analysts believe prices could soon push past the $100 mark — especially amid ongoing global tensions and rising consumption.
Standard Chartered forecasts Brent reaching $95 by December 2025, while some outlooks go even higher. What’s fueling this potential rally? Top 5 reasons oil may surge in the coming months:
Global instability : Tensions in the Middle East and unrest in key producers like Venezuela and Nigeria raise concerns about supply disruptions. Any flare-ups could push prices to $90, $95 — or beyond.
Economic recovery : Asia and developing economies are bouncing back fast. With industrial activity rising, so does energy demand — including for oil.
OPEC+ tight supply policy : OPEC+ is likely to maintain production cuts to support prices and keep the market balanced.
Low reserves, limited expansion : Stockpiles remain tight, and exploration has lagged in recent years. If demand spikes, producers may struggle to scale output quickly.
Aviation and petrochemicals rebound : Global air traffic and plastic manufacturing are growing, increasing demand for jet fuel and oil-based feedstocks.
Together, these factors create a strong setup for upward momentum in Brent and WTI prices. According to FreshForex analysts , the current levels could mark the beginning of a new growth cycle.
