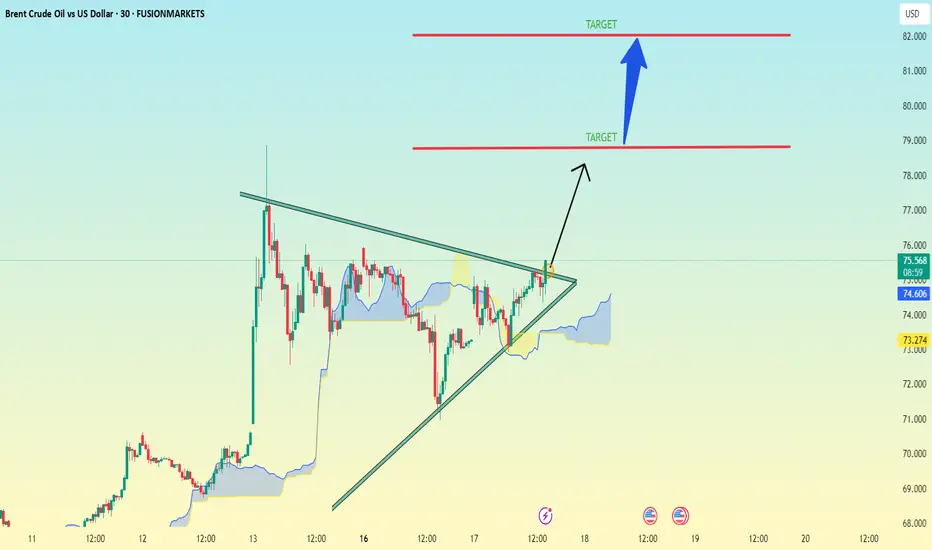
XBR/USD.30M CHART PATTERN.(XBRUSD) on the 30-minute timeframe, here’s the technical outlook:
Chart Pattern Observed:
You have a symmetrical triangle breakout setup:
The price is currently breaking above the triangle resistance.
There’s a bullish bias post-breakout with two targets marked.
Targets Identified on Your Cha
About CFDs on Crude Oil (Brent)
The Brent Сrude oil was originally produced from the Brent oilfield in the North Sea. About 2/3rds of all crude oil contracts around the globe include Brent Сrude oil, making it the most popular marker. Its relatively low density and sulphur content are the reasons why it’s described as light and sweet. One of the advantages is transportation since this type of oil is waterborne. The Brent Crude oil marker is also known as Brent Blend, London Brent and Brent petroleum and has a UKOIL ticker symbol.
Geopolitics vs. Technical: Will Oil Correct -7%?Oil ( FX_IDC:USDBRO ) rose more than +20% after the start of tensions between Iran and Israel on Friday . I hope this tension ends as soon as possible because tensions have no winners.
The behavior and price movements of oil will certainly depend on the increase or decrease of tensions in the

Israel Strikes Iran. Oil and Gold Prices SurgeIsrael Strikes Iran. Oil and Gold Prices Surge
According to media reports, Israel launched a large-scale overnight strike on Iranian territory, targeting dozens of military and strategic facilities linked to the country’s nuclear programme and missile capabilities. Israeli officials justified the
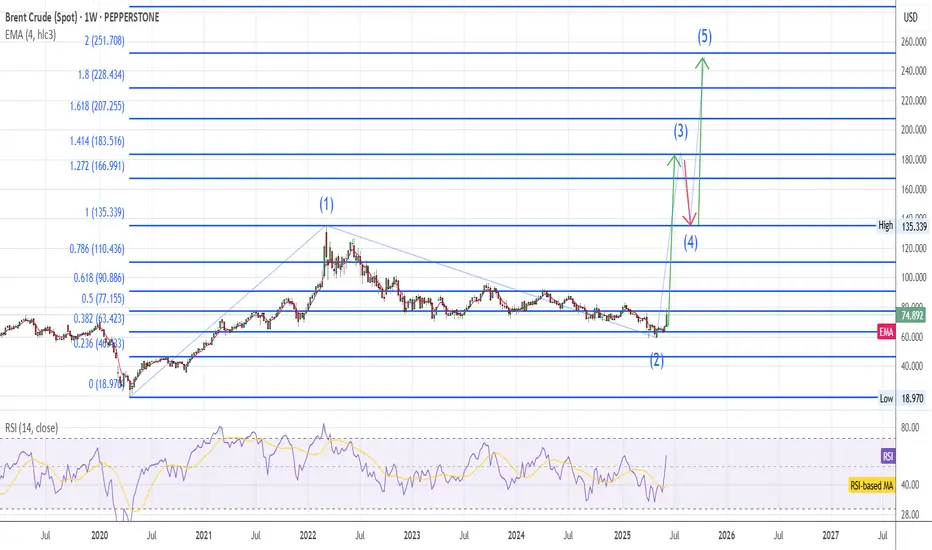
Brent UpdateOn the long term chart wave #2 was completed in the last 2 weeks and wave #3 ha started, I expect massive bullish move for Brent due to Israel-Iran conflict , target 255$
Oil spikes as Israel strikes Iran: What traders need to knowOil prices surged after Israel attacked Iran’s nuclear sites, reversing the recent downtrend and reigniting inflation fears. In this video, we break down the chart patterns, explain the move, and explore what could come next. Is this the start of a new uptrend or just a short-lived spike? Watch for

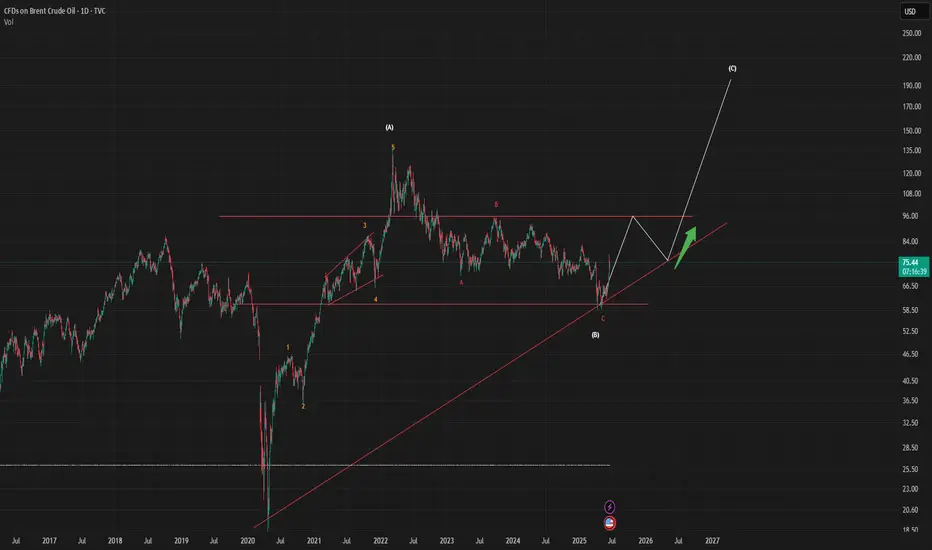
Time for a Rise in Oil Prices $$$When analyzing the recent movements in oil prices through the lens of Elliott Wave Theory, it appears that the current structure is completing an ABC corrective formation.
Initially, the A wave has developed as a strong upward 1-5 impulse structure.
The B wave evolved through a classic ABC correct
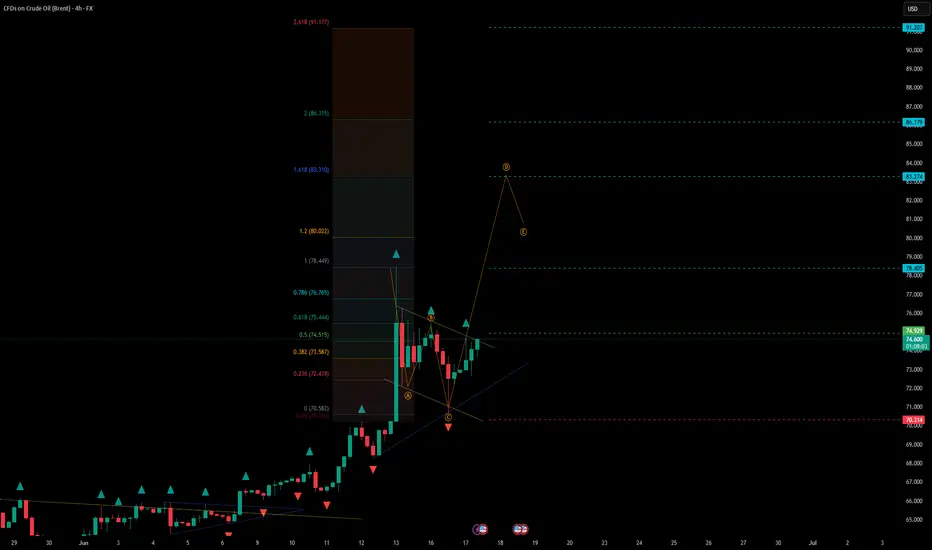
BRENT - UniverseMetta - Signal#BRENT - UniverseMetta - Signal
H4 - Breakout of the trend line + formation of ABC structure in continuation of the uptrend. It is better to reduce risks. Stop behind the minimum of wave C.
Entry: 74.929
TP: 78.405 - 83.274 - 86.179 - 91.207
Stop: 70.314
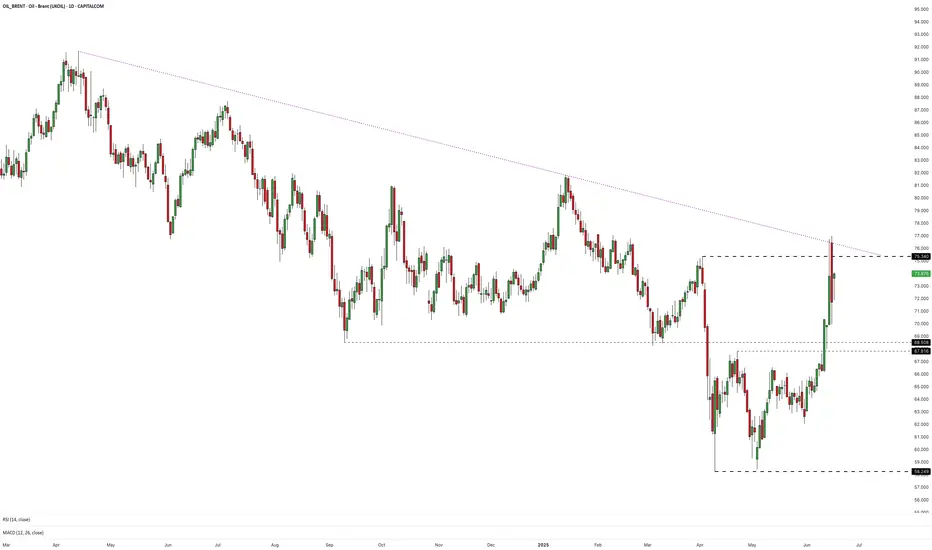
Oil’s Surge Stalls at Descending TrendlineLast week’s surge in crude oil following the escalating conflict in the Middle East sparked a wave of momentum buying as traders responded to the rising risk premium. But with prices now testing a key technical barrier, let’s take a look at whether this rally has legs or if it’s already starting to
Brent Oil Intra-day Analysis 12-Jun-25Drawing possible scenarios we could see on Brent Oil prices.
Keep in mind fundamentals supporting the move up on oil:
* Geopilitical escalations between Russia and Ukraine
* Opec+ production policy
* US - China Trade talks and demand optimisim
* Geopolitical tensions between US and Iran.
Dis

XBR/USD Chart Analysis: Brent Crude Reaches 1.5-Month HighXBR/USD Chart Analysis: Brent Crude Reaches 1.5-Month High
In our analysis of Brent crude oil six days ago, we identified a large contracting triangle and a local ascending channel. We also outlined a potential scenario involving a bullish breakout above the upper boundary of the triangle.
Althou

See all ideas
Displays a symbol's price movements over previous years to identify recurring trends.