BRENT Robbery Setup: Thief's Bear Trap is Active!🔥💰BRENT BEARISH HEIST PLAN💰🔥
🎯 Asset: BRENT/ XBRUSD / UK Oil Spot
🧠 Strategy: Layered Limit Orders | Bearish Robbery in Progress
💼💣💼
Yo Money Movers & Market Jackers!
It’s time to load up the truck and roll out — the BRENT vault is cracked open and dripping with bearish loot! 🐻💵🔓
🎩 This isn’t just

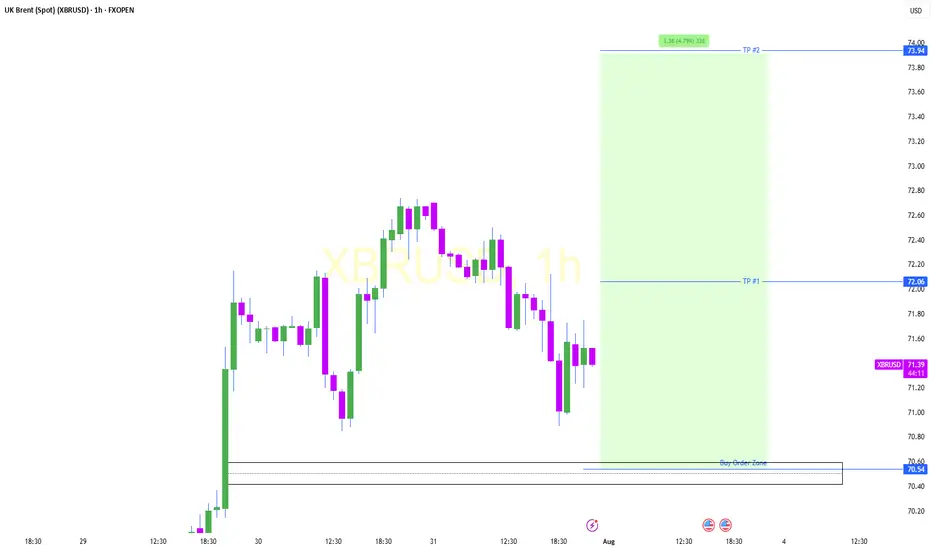
XBRUSD Robbery Setup: Thief's Bear Trap is Active! 🔥💰BRENT BEARISH HEIST PLAN💰🔥
🎯 Asset: XBRUSD / UK Oil Spot / BRENT
🧠 Strategy: Layered Limit Orders | Bearish Robbery in Progress
💼💣💼
Yo Money Movers & Market Jackers!
It’s time to load up the truck and roll out — the BRENT vault is cracked open and dripping with bearish loot! 🐻💵🔓
🎩 This isn’t just

WTI short in OPEC production hike and technical breakout Interesting chart for WTI with a nice daily downtrend and 4hr counter trendline + support level for a breakout. This is further supported by the OPEC production hike, would like to see a higher inventories reading too.
Things that could negatively effect this position are sanctions being put on R

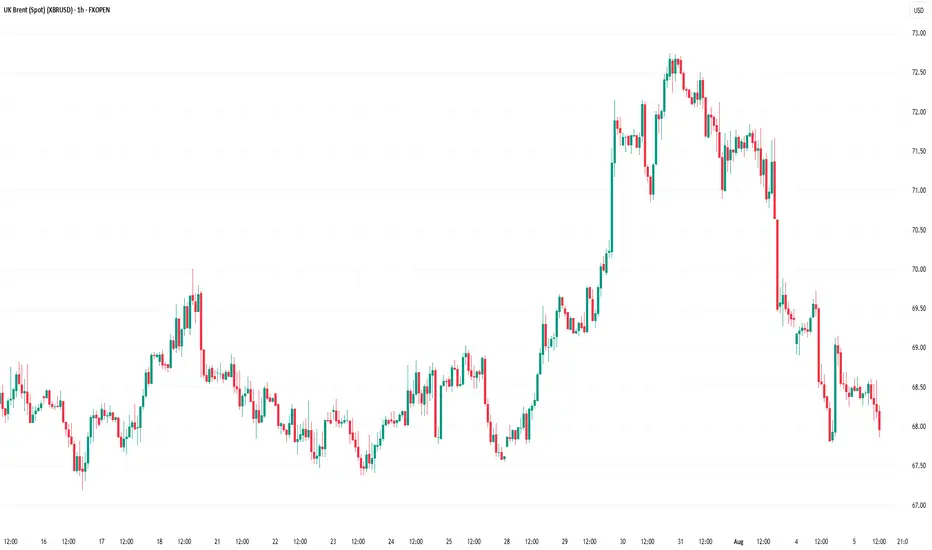
XBR/USD Chart Analysis: Oil Price Declines Towards Key SupportXBR/USD Chart Analysis: Oil Price Declines Towards Key Support
As the XBR/USD chart shows, Brent crude oil has made two significant moves recently:
Last week’s price increase (A) followed President Donald Trump’s intentions to impose tariffs on India due to its purchases of Russian oil. This c
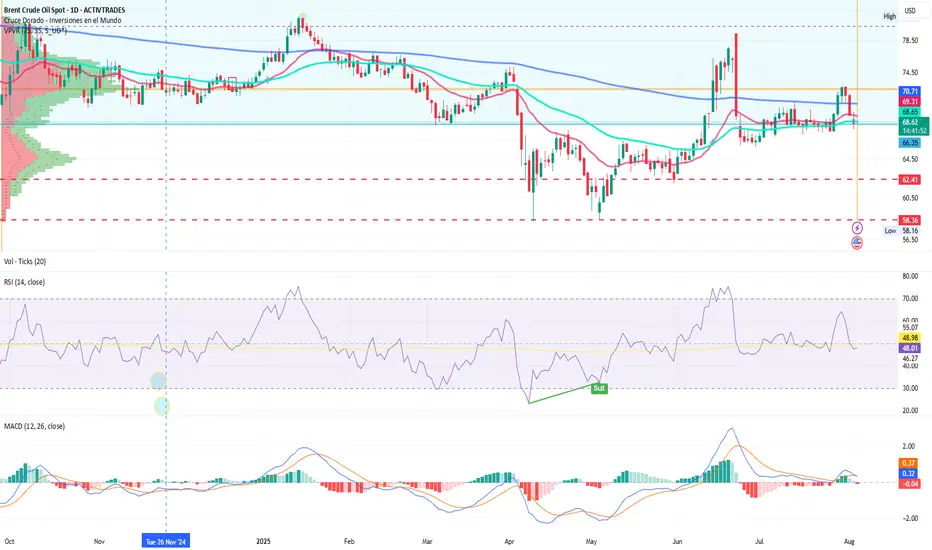
BRENT: OPEC+ Reacts as a New Geopolitical Chapter LoomsIon Jauregui – Analyst at ActivTrades
The oil market is bracing for a new episode of high tension. With Brent stabilizing around $70 per barrel, OPEC+ has made a decisive move: starting in September, it will increase production by 547,000 barrels per day—a decision that could significantly alter t
Brent Could Face Negative Pressure Ahead of Putin - Trump TalkBrent crude is attempting to recover ahead of the scheduled Putin–Trump discussions. A ceasefire agreement combined with the potential return of Russian oil to global markets could have a negative impact on prices. The broader downtrend is still intact, but recent downside momentum appears to have s

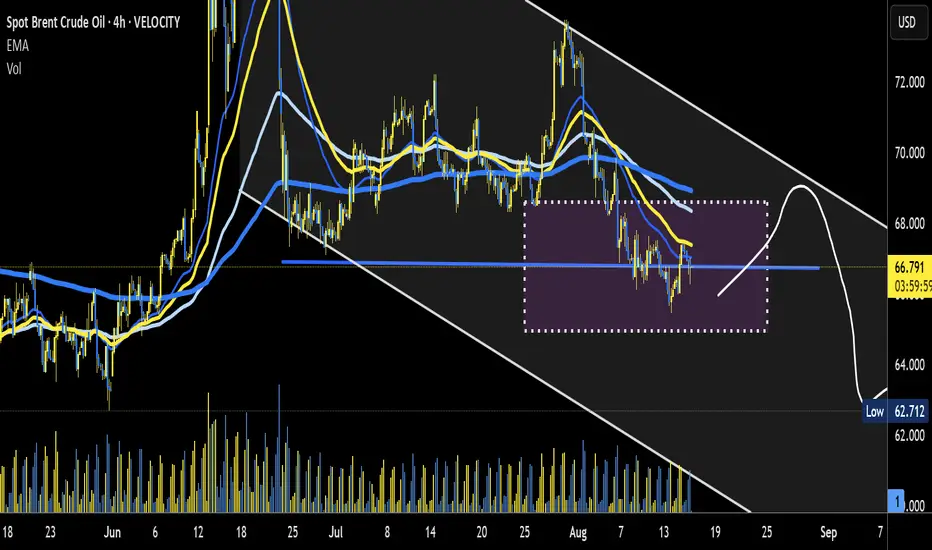
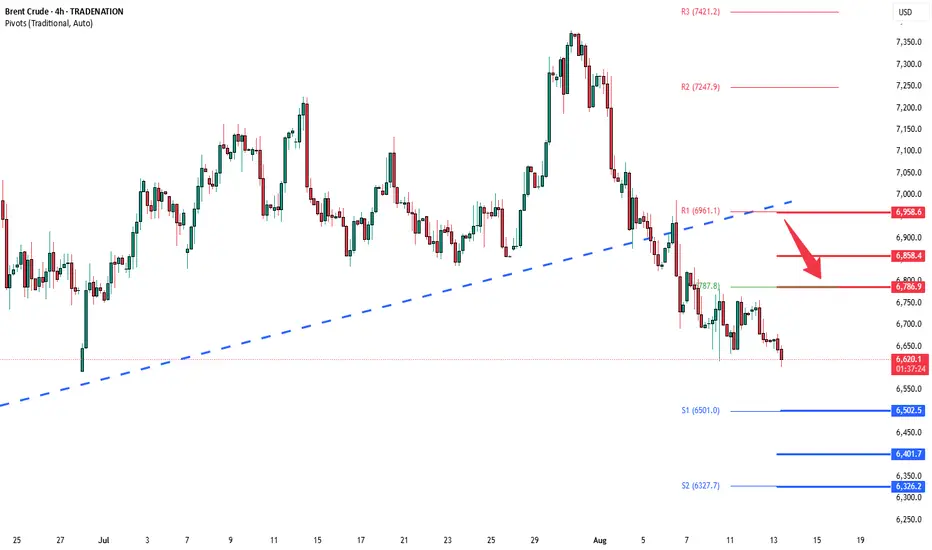
Brent Crude downtrend capped at 6790The Brent Crude Oil is currently trading with a bearish bias, aligned with the broader downward trend. Recent price action shows a retest of the resistance, suggesting a further selling pressure within the downtrend.
Key resistance is located at 6790, a prior consolidation zone. This level will be
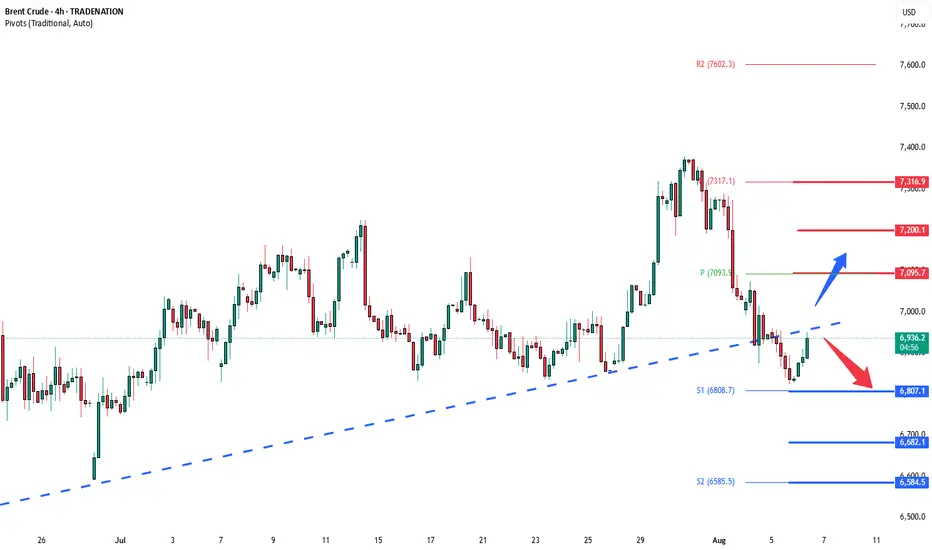
Brent Crude key support zone at 6800The Brent Crude Oil remains in a neutral trend, with recent price action showing signs of a corrective pullback within the broader uptrend.
Support Zone: 6800 – a key level from previous consolidation. Price is currently testing or approaching this level.
A bullish rebound from 6800 would confirm
See all ideas
Displays a symbol's price movements over previous years to identify recurring trends.