Brent: Crude Loses Its Shine Amid Mass Selloffs and Global FearsBy Ion Jauregui – Analyst at ActivTrades
Bearish pressure is intensifying in the oil market, with Brent crude leading the liquidation among major investment funds. The expiration of U.S. tariff exemptions on August 1st, combined with a global economic slowdown, has triggered a wave of risk aversio
About U.S. DOLLAR / BRENT CRUDE OIL
Crude Oil is a naturally occurring liquid fossil fuel resulting from plants and animals buried underground and exposed to extreme heat and pressure. Crude oil is one of the most demanded commodities and prices have significantly increased in recent times.
Oil surges on Russia sanction threats but long-term risks remainOil prices have climbed around 6% this week, driven by two key developments: a trade deal between the EU and the US, and Donald Trump’s warning that the US may impose sanctions on Russian oil buyers within 10 days unless progress is made toward ending the Russia-Ukraine war.
Russia accounts for abo

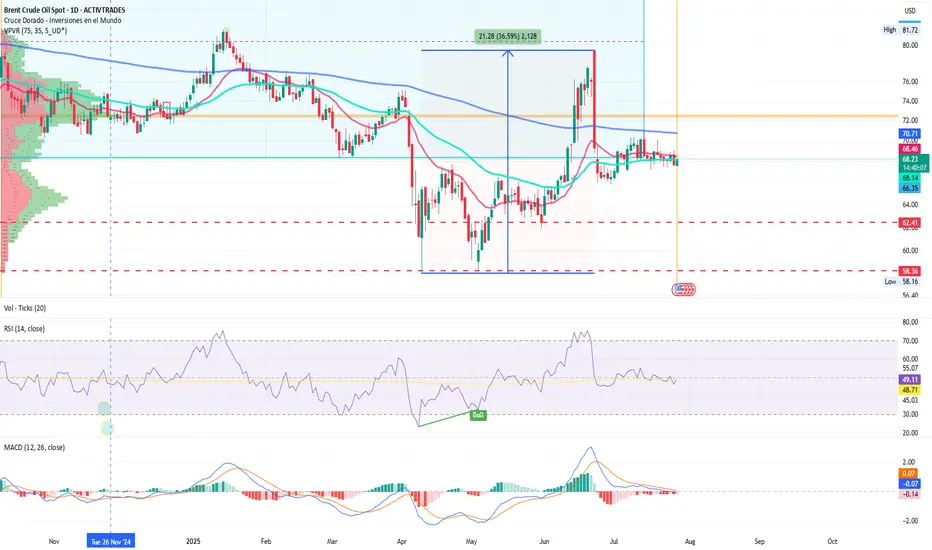
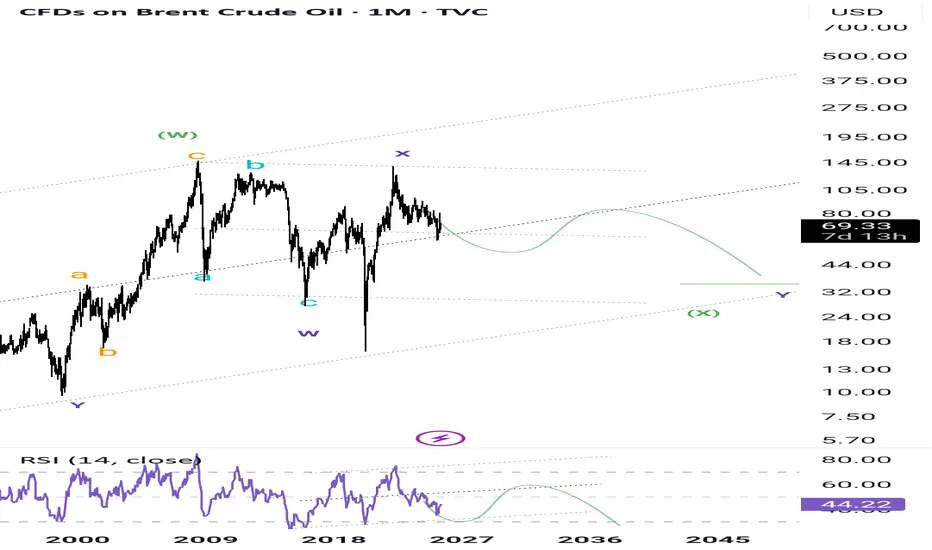
Oil Brent I think Brent oil will make another low and then rise again to the $90 range and then have a sharp correction.
Majidbabaeiasl Tehran iran
1404 / 05/02
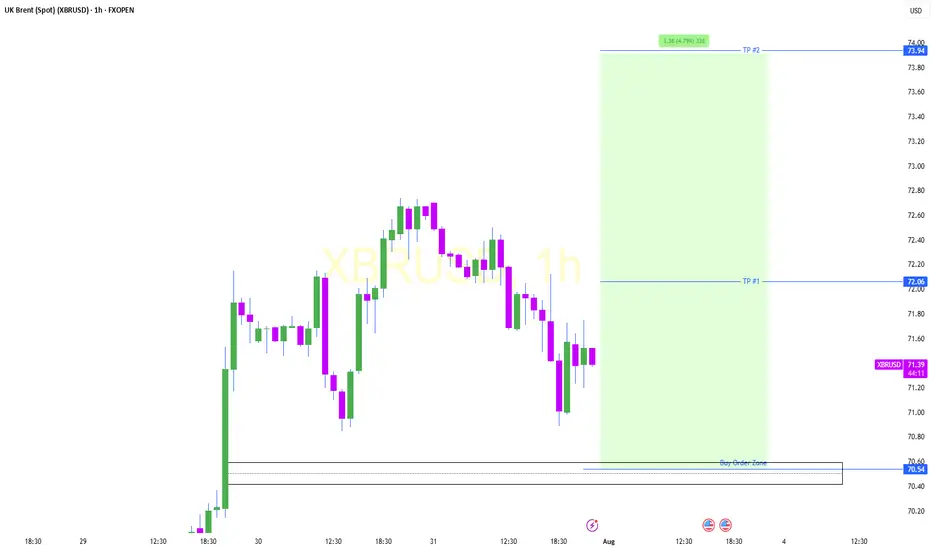
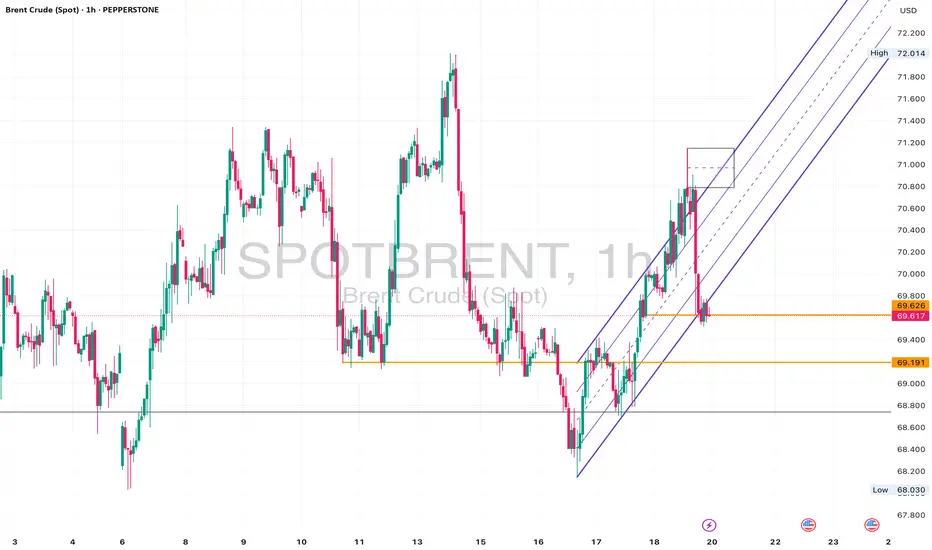
Possible Bullish Setup on 1Hr Brent Crude.Possible bullish setup on the 1hr Brent.
A break below setup triggers a bearish position to target price area.
Best of luck in all your trades.
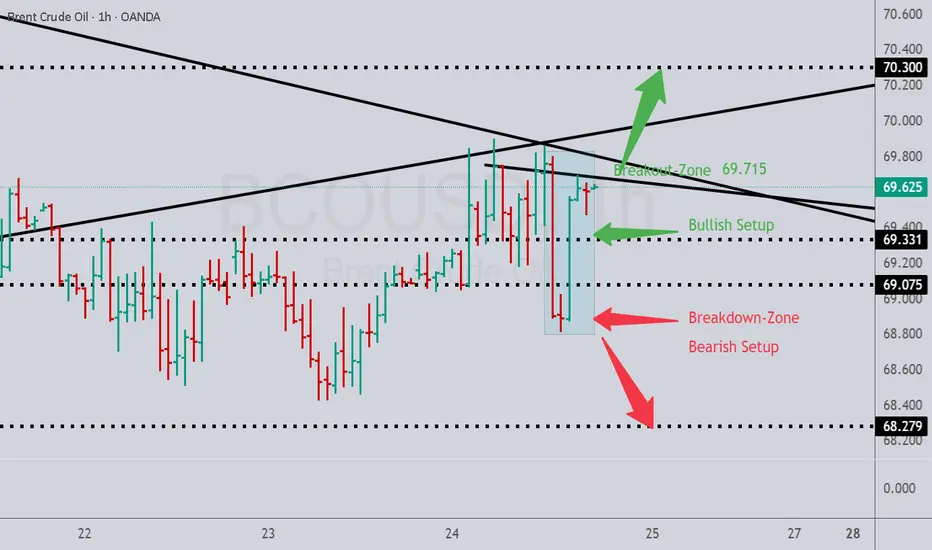
Brent UKOil - Neutral Slightly Bearish • Daily: Price is sitting above long-term trendline support, but momentum is waning.
• 4H: Structure looks indecisive with constant failures near 71.00.
• 1H: Recent break of the upward channel. Now retesting that zone from below.
⚠️ Watch For:
• Retest of 69.60–70.00 as resistance.
• Break an
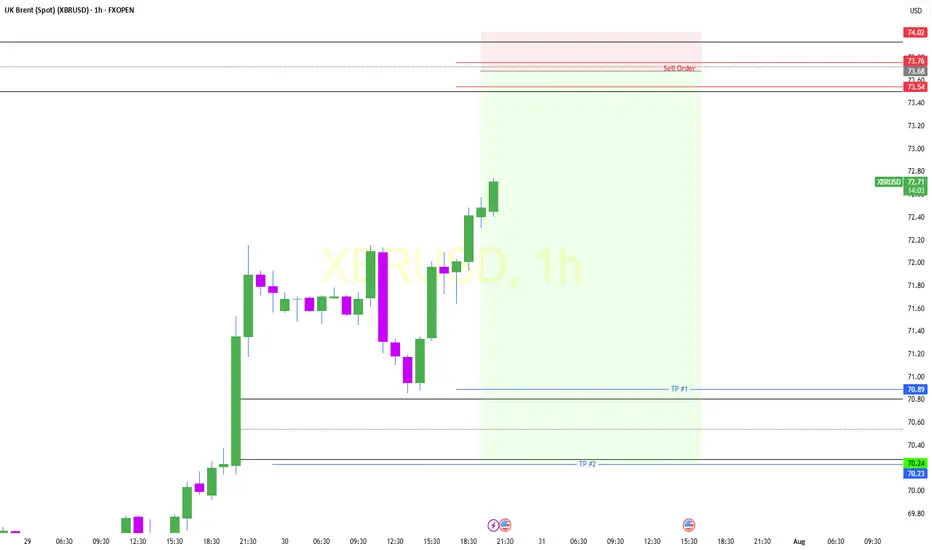
UKOIL Short UKOIL prices may decline from the $73.7 level within the Fair Value Gap (FVG) zone, targeting a lower FVG zone as the next potential objective.
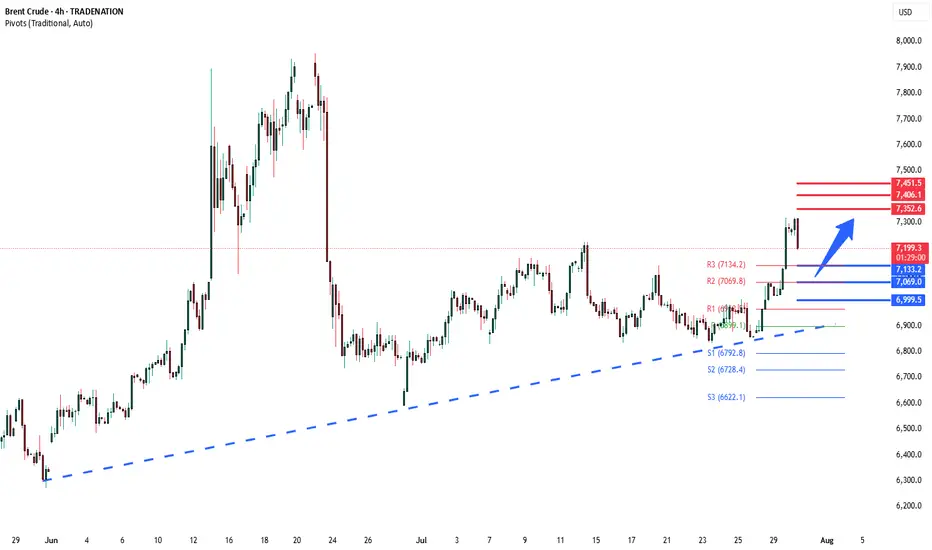
Brent Crude corrective pullback support at 7133The Brent Crude remains in a bullish trend, with recent price action showing signs of a corrective pullback within the broader uptrend.
Support Zone: 7133 – a key level from previous consolidation. Price is currently testing or approaching this level.
A bullish rebound from 7133 would confirm ong
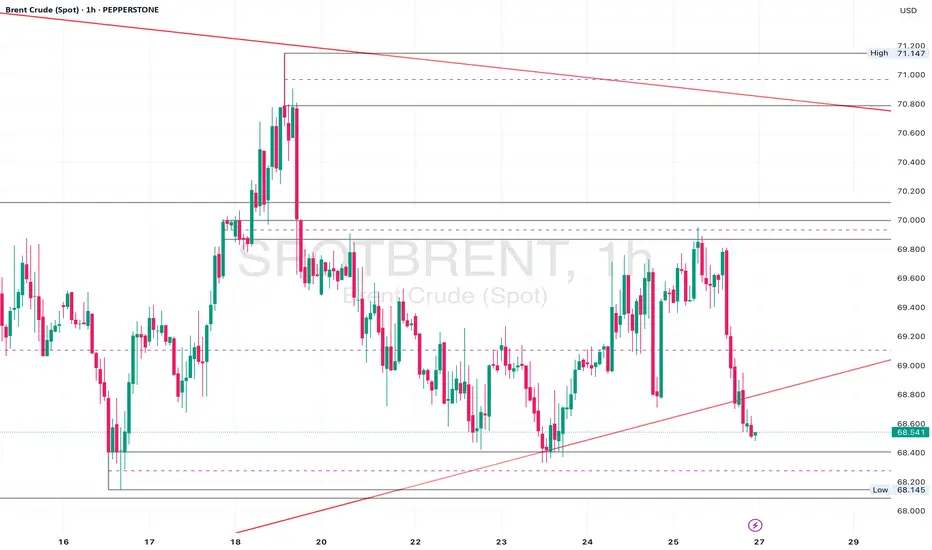
Brent Crude Sitting at Key Support – 69.20 Hold for a Rebound?Daily Analysis:
Price is holding above the ascending trendline and forming higher lows. Multiple rejections from the 68.00 region suggest strong demand. As long as we remain above the trendline, bulls stay in control.
4H Analysis:
Pullback after rejecting 71.00. Now sitting inside the 69.60–69.20 d
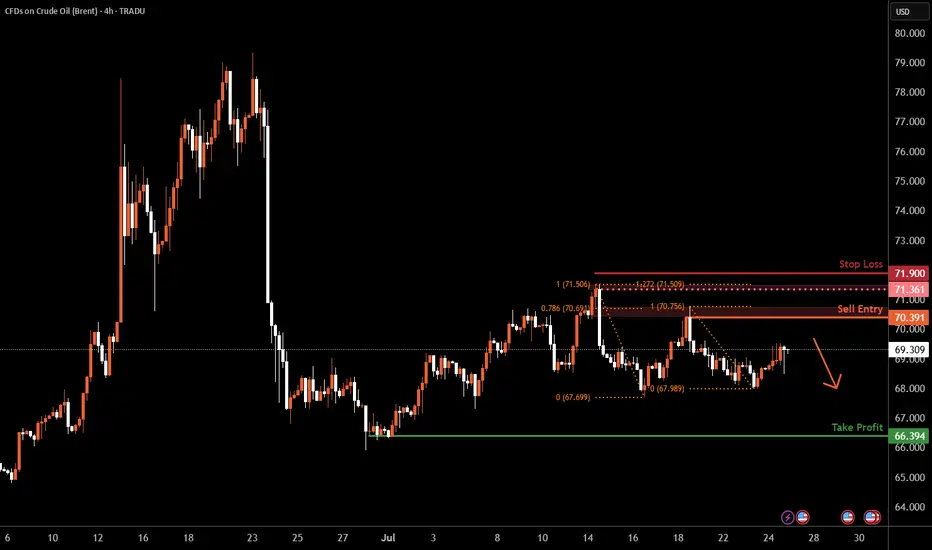
Brent Oil H4 | Heading into a swing-high resistanceBrent oil (UKOIL) is rising towards a swing-high resistance and could potentially reverse off this level to drop lower.
Sell entry is at 70.39 which is a swing-high resistance that aligns closely with the 78.6% Fibonacci retracement.
Stop loss is at 71.90 which is a level that sits above the 127.2
See all ideas
Displays a symbol's price movements over previous years to identify recurring trends.