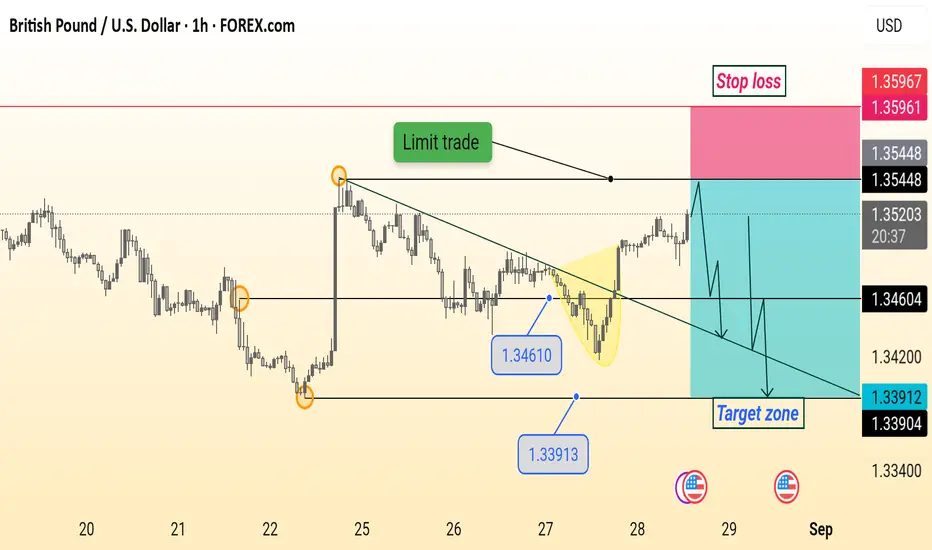
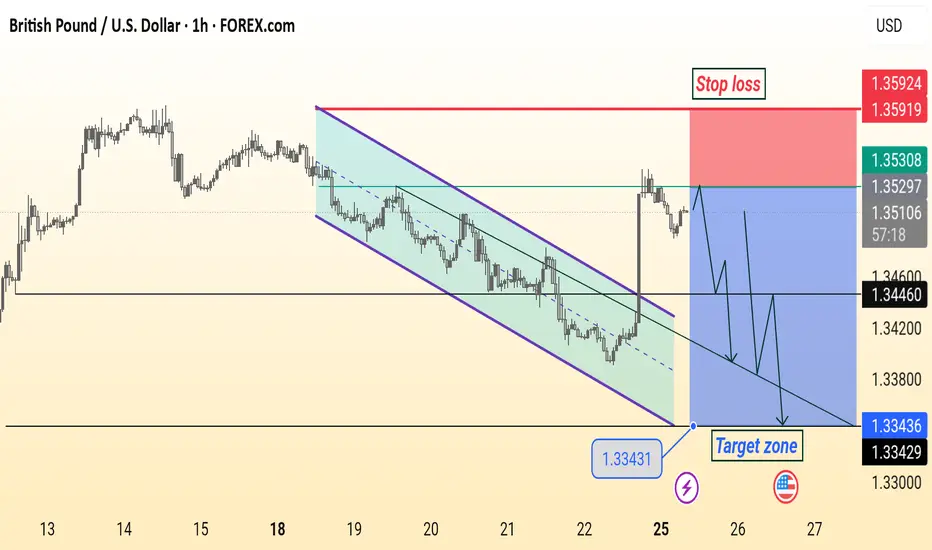
GBP/USD Possible Move This GBP/USD 1H analysis suggests a sell limit setup near 1.3544 with a stop loss at 1.3596. The price is expected to drop after rejection, targeting the 1.3461 support and extending to the 1.3391 target zone.
Related currencies
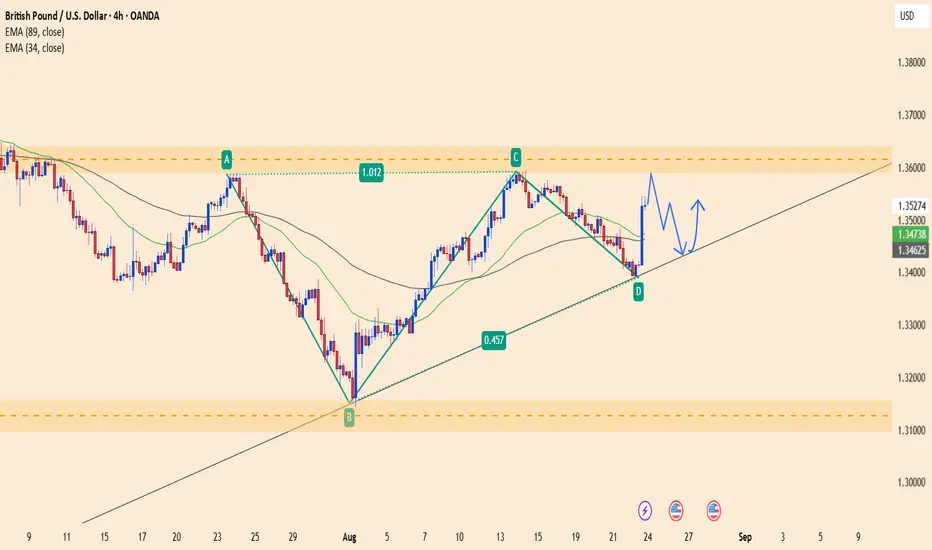
GBP/USD Soars Sharply: Can This Breakout Hold?Technical Analysis:
Price Pattern: GBP/USD is currently in an uptrend with strong support at 1.34300 and resistance near 1.35900.
EMA: The 34-period EMA has crossed above the 89-period EMA, indicating the strength of the uptrend.
Signal: Price has just broken through the 1.35200 resistance zo
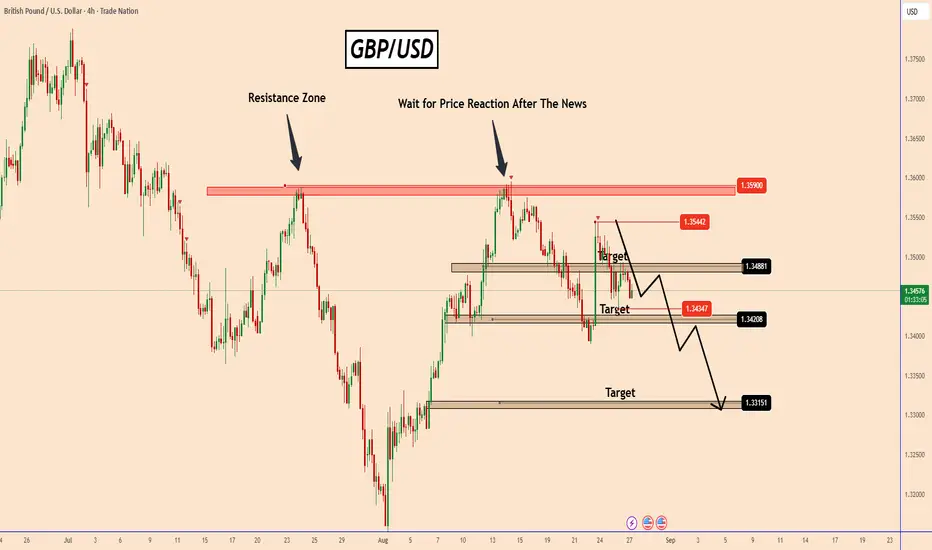
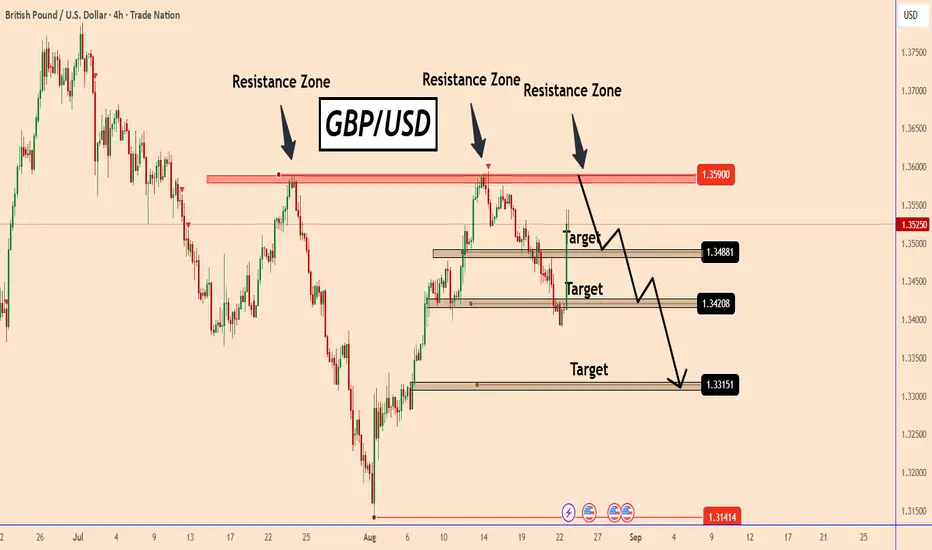
GBPUSD Struggles Below Resistance — More Downside Ahead?GBPUSD Struggles Below Resistance — More Downside Ahead?
GBPUSD hit a strong resistance zone near 1.3590 and hasn’t been able to break above it. From our analysis, the pair has already dropped about 110 pips, falling from 1.3544 to 1.3434.
Even after Trump’s statement about firing Fed Governor Li
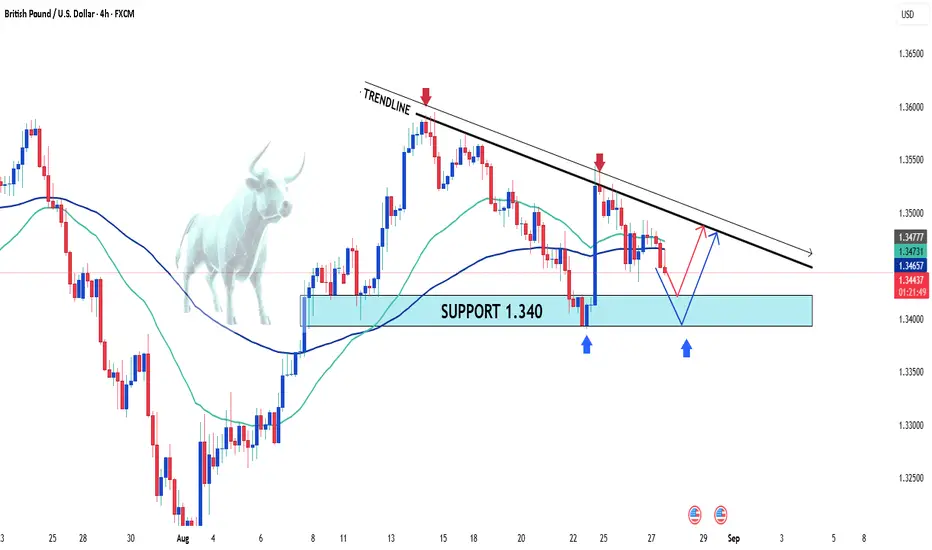
GBPUSD: Will It Bounce from Support or Breakout Soon?Hello, great to be back and discuss FX:GBPUSD with you all. Here’s my take on this currency pair.
Currently, GBPUSD is moving around 1.345, continuing to trade within a narrow range between the trendline and an important support level.
In the short term, the current downtrend is expected to ex
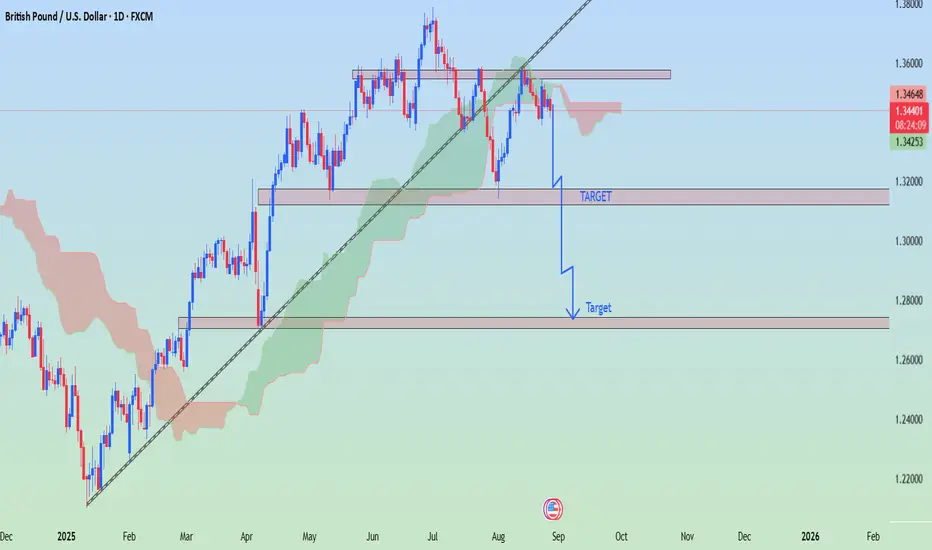
GBP/USD (British Pound / U.S. Dollar)GBP/USD (British Pound / U.S. Dollar) on the 1D (daily) chart .
From my chart:
The pair has broken the ascending trendline (drawn from March–July 2025).
Price is trading around 1.3440.
There are two downside “Target” zones marked.
📉 Key Targets Based on Your Chart
1. First Target Zone: Around
GBP/USD SetupThis GBP/USD 1H analysis shows a bearish outlook. Price is expected to reverse down from the current level with a stop loss at 1.3592, aiming for the target zone around 1.3343. The chart highlights potential pullbacks before continuing lower within the downtrend channel.
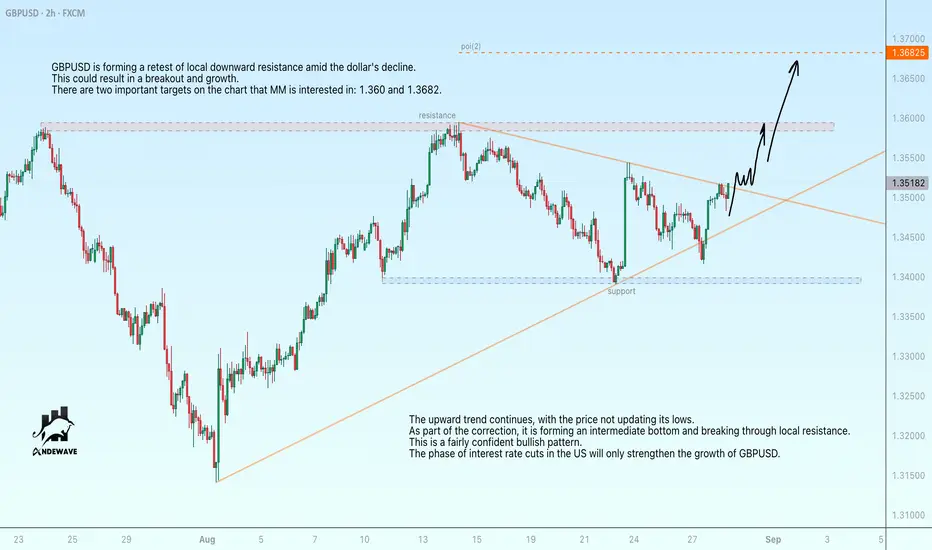
GBPUSD is ready to activate rally modeGBPUSD is forming a retest of local downward resistance against the backdrop of a weaker dollar. This could result in a breakout and growth. There are two important targets on the chart that MM is interested in: 1.360 and 1.3682.
The upward trend continues, with the price not updating its lows. As
GBPUSD: Bearish Outlook on Fundamental and Structure AnalysisGBPUSD: Bearish Outlook Based on Fundamentals and Structure Analysis
On Friday, before the press conference, everything moved aggressively against the USD. It was a strange move because it happened suddenly without any news and before Powell said hello.
At the time Powell sent the rate cut message
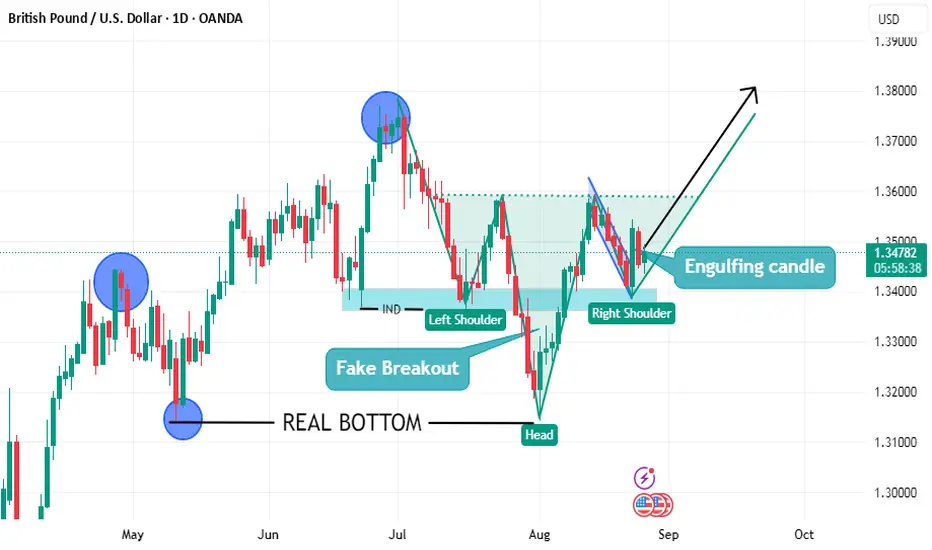
GBPUSD STRONG SIGNAL BUY SETUP LOOOOOOOOOOOOOOOOOONGWhat do you think?
we have head and shoulder
and have uptrend on high time frame reflect from real bottom after take liquidity
and the price made fake breakout
on another second shoulder the price reflect from strong support
and made engulfing candle
The price made bearish flag and is broken an
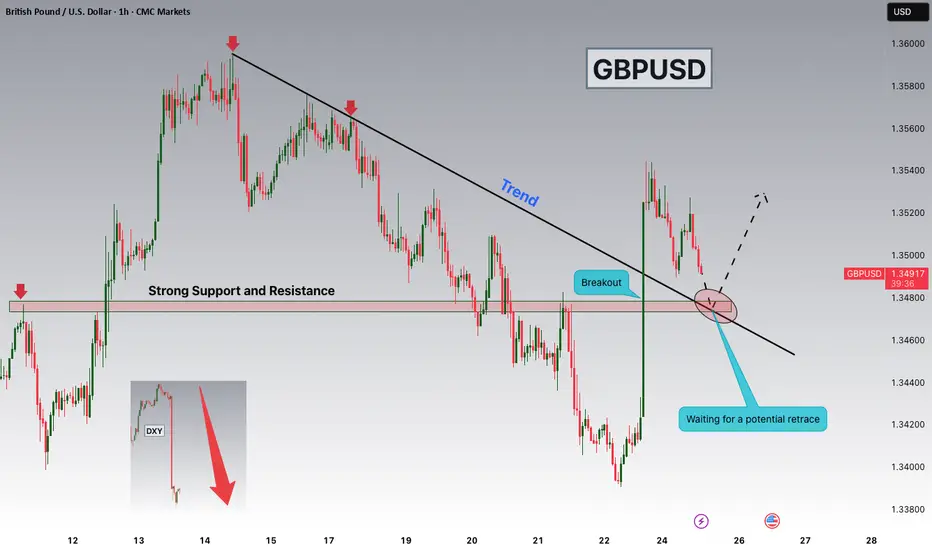
GBPUSD Breakout and Potential RetraceHey Traders, in today's trading session we are monitoring GBPUSD for a buying opportunity around 1.34800 zone, GBPUSD was trading in a downtrend and successfullly managed to break it out. Currently is in a correction phase in which it is approaching the retrace area at 1.34800 support and resistance
See all ideas
Summarizing what the indicators are suggesting.
Oscillators
Neutral
SellBuy
Strong sellStrong buy
Strong sellSellNeutralBuyStrong buy
Oscillators
Neutral
SellBuy
Strong sellStrong buy
Strong sellSellNeutralBuyStrong buy
Summary
Neutral
SellBuy
Strong sellStrong buy
Strong sellSellNeutralBuyStrong buy
Summary
Neutral
SellBuy
Strong sellStrong buy
Strong sellSellNeutralBuyStrong buy
Summary
Neutral
SellBuy
Strong sellStrong buy
Strong sellSellNeutralBuyStrong buy
Moving Averages
Neutral
SellBuy
Strong sellStrong buy
Strong sellSellNeutralBuyStrong buy
Moving Averages
Neutral
SellBuy
Strong sellStrong buy
Strong sellSellNeutralBuyStrong buy
Displays a symbol's price movements over previous years to identify recurring trends.
Frequently Asked Questions
The current rate of USDGBP is 0.74005 GBP — it has increased by 0.05% in the past 24 hours. See more of USDGBP rate dynamics on the detailed chart.
The value of the USDGBP pair is quoted as 1 USD per x GBP. For example, if the pair is trading at 1.50, it means it takes 1.5 GBP to buy 1 USD.
The term volatility describes the risk related to the changes in an asset's value. USDGBP has the volatility rating of 0.51%. Track all currencies' changes with our live Forex Heatmap and prepare for markets volatility.
The USDGBP showed a −0.69% fall over the past week, the month change is a −1.13% fall, and over the last year it has decreased by −2.36%. Track live rate changes on the USDGBP chart.
Learn how you can make money on rate changes in numerous trading ideas created by our community.
Learn how you can make money on rate changes in numerous trading ideas created by our community.
USDGBP is a major currency pair, i.e. a popular currency paired with USD.
Currencies are usually traded through forex brokers — choose the one that suits your needs and go ahead. You can trade USDGBP right from TradingView charts — just log in to you broker account. Check out the list of our integrated brokers and find the best one for your needs and strategy.
When deciding to buy or sell currency one should keep in mind many factors including current geopolitical situation, interest rates, and other. But before plunging into a deep research, you can start with USDGBP technical analysis. The technical rating for the pair is sell today, but don't forget that markets can be very unstable, so don't stop here. According to our 1 week rating the USDGBP shows the sell signal, and 1 month rating is sell. See more of USDGBP technicals for a more comprehensive analysis.