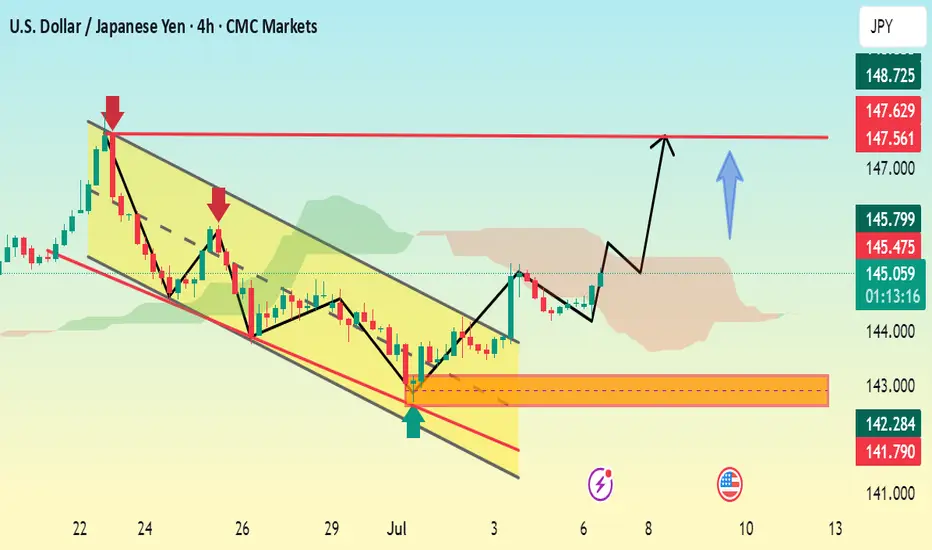
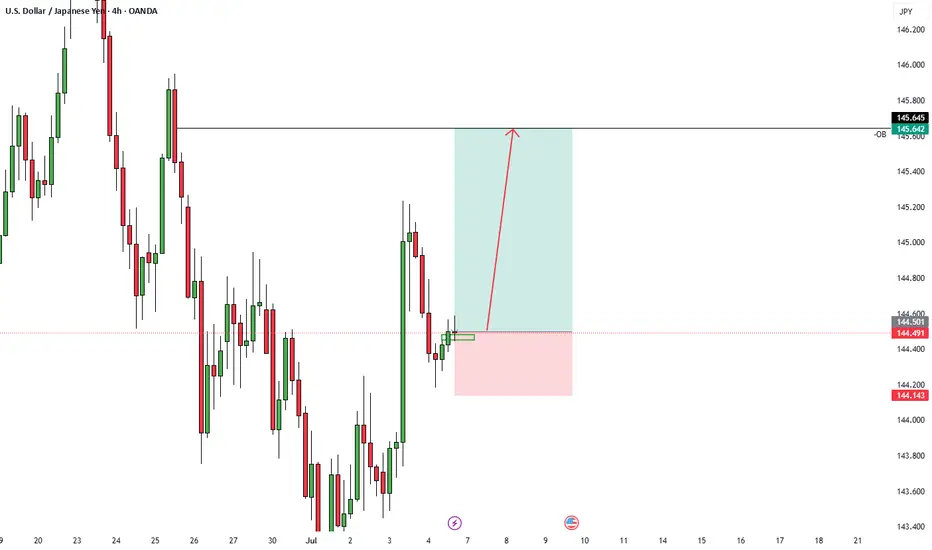
BULLISH H4 MOMENTUM ACTIVATED...?📊 Pattern & Structure:
The chart shows a downward channel (falling wedge) pattern that has recently been broken to the upside, indicating a bullish breakout.
The breakout is clean, with a sharp upward move, confirming the reversal from the bearish trend.
🔍 Key Levels Identified:
Support Zone:
142.284 – 141.790 (marked with an orange box)
This zone acted as a strong demand/support area.
Price bounced strongly after reaching this zone.
Immediate Resistance Levels:
145.799 – Near-term resistance.
147.000 – 147.629 – Key resistance zone (highlighted with a red horizontal line).
148.725 – Final bullish target/resistance on the chart.
📈 Bullish Scenario (highlighted with arrows and wave projection):
Price has broken out of the falling wedge, retested, and is pushing higher.
Target zone: 147.000–148.725.
The chart suggests a bullish projection, with further gains expected if the price sustains above 145.47.
USDJPY trade ideas
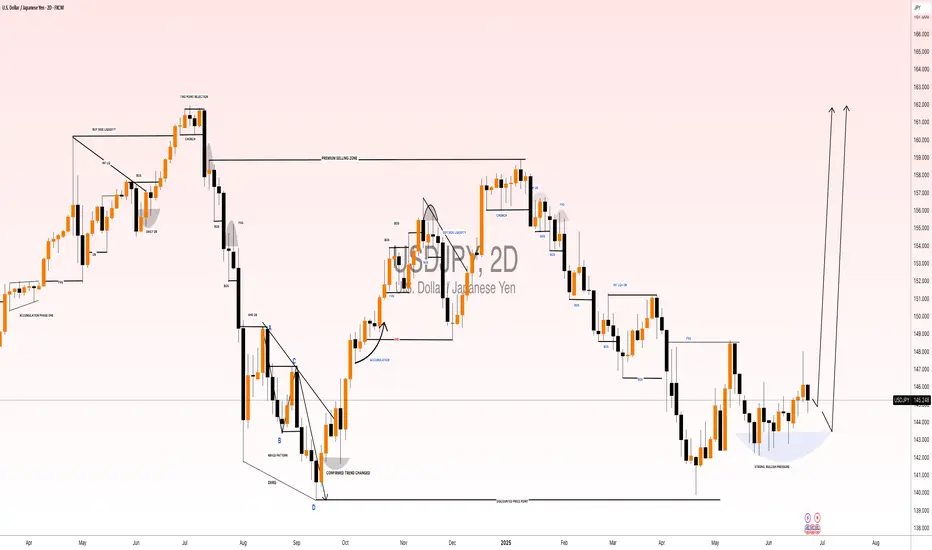
USDJPY Price Accumulated|Time For Bullish Distribution|Setupsfx|The price has accumulated nicely and is now distributing. We have three targets in mind, but set your own based on your analysis. Our approach is purely technical, but also includes a basic fundamental approach. This analysis concludes over 1500 pips and is a swing move. Please use this analysis as educational purposes only, as it does not guarantee that price will move exactly as predicted.
If you like our idea, please consider liking and commenting on it.
Good luck and trade safely!
Team Setupsfx_
USDJPY 30Min Engaged ( Bullish Entry Detected )➕ Objective: Precision Volume Execution
Time Frame: 30-Minute Warfare
Entry Protocol: Only after volume-verified breakout
🩸 Bullish Break : 145.100
➗ Hanzo Protocol: Volume-Tiered Entry Authority
➕ Zone Activated: Dynamic market pressure detected.
The level isn’t just price — it’s a memory of where they moved size.
Volume is rising beneath the surface — not noise, but preparation.
🔥 Tactical Note:
We wait for the energy signature — when volume betrays intention.
The trap gets set. The weak follow. We execute.
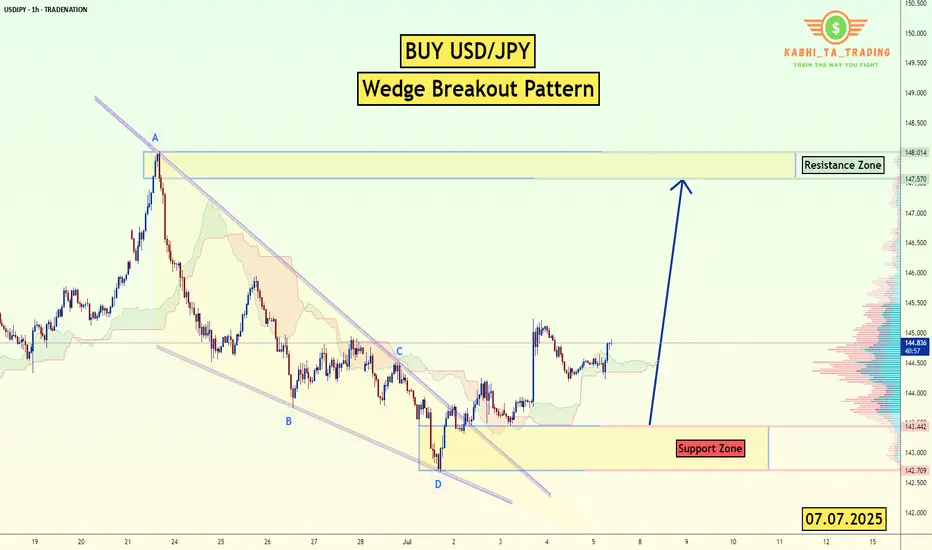
USD/JPY - H1- Wedge Breakout (07.07.2025)The USD/JPY pair on the H1 timeframe presents a Potential Buying Opportunity due to a recent Formation of a Wedge Breakout Pattern. This suggests a shift in momentum towards the upside and a higher likelihood of further advances in the coming hours.
Possible Long Trade:
Entry: Consider Entering A Long Position around Trendline Of The Pattern.
Target Levels:
1st Resistance – 148.00
🎁 Please hit the like button and
🎁 Leave a comment to support for My Post !
Your likes and comments are incredibly motivating and will encourage me to share more analysis with you.
Best Regards, KABHI_TA_TRADING
Thank you.
Disclosure: I am part of Trade Nation's Influencer program and receive a monthly fee for using their TradingView charts in my analysis.
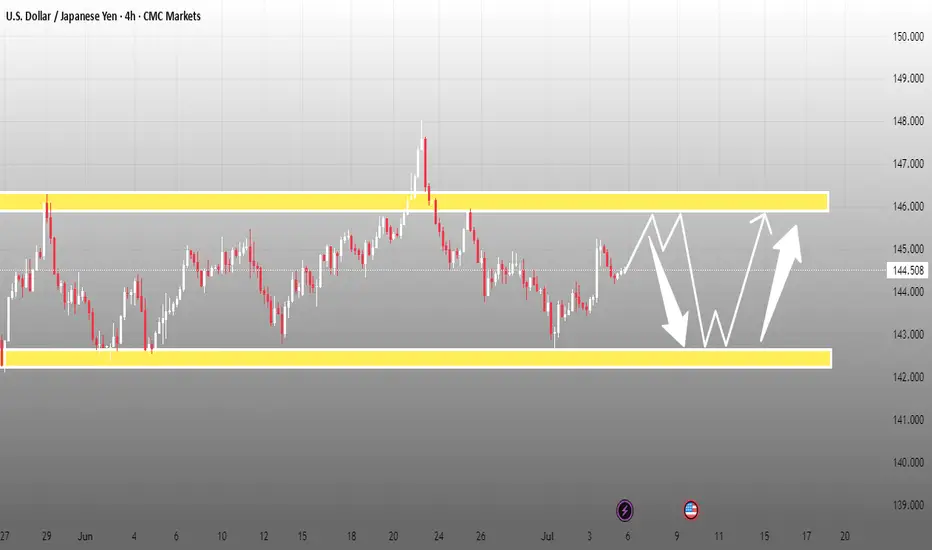
USD/JPY Range- weekly chart setupUSD/JPY abhi ek strong range-bound structure mein trade kar raha hai jisme clearly defined support aur resistance zones dikhai de rahe hain. Chart par price 144.50 ke aas paas consolidate kar raha hai, jahan se dono directions mein breakout ka potential bana hua hai.
📉 Resistance Zone: 145.80 – 146.20
📈 Support Zone: 142.30 – 142.70
🔍 Current Price: 144.50 (As of July 6, 2025)
🧠 Trading Scenarios:
🔽 Bearish Scenario:
Agar price 145.80 zone se reject hota hai, to short-term selling pressure dekhne ko mil sakta hai, jisme target 1: 143.50 aur target 2: 142.50 ka ho sakta hai.
🔼 Bullish Scenario:
Agar price support zone (142.50) se strong bounce karta hai, to range ke upper bound (145.80) tak ka upside move expected hai. Breakout ke baad extended target 147.00+ tak ho sakta hai.
📊 Timeframe: 4H
📍 Setup Type: Range Trade | Mean Reversion | Breakout Watch
💬 Idea by: Liquidity_Gold_FX
🔔 Follow for more FX setups and updates.
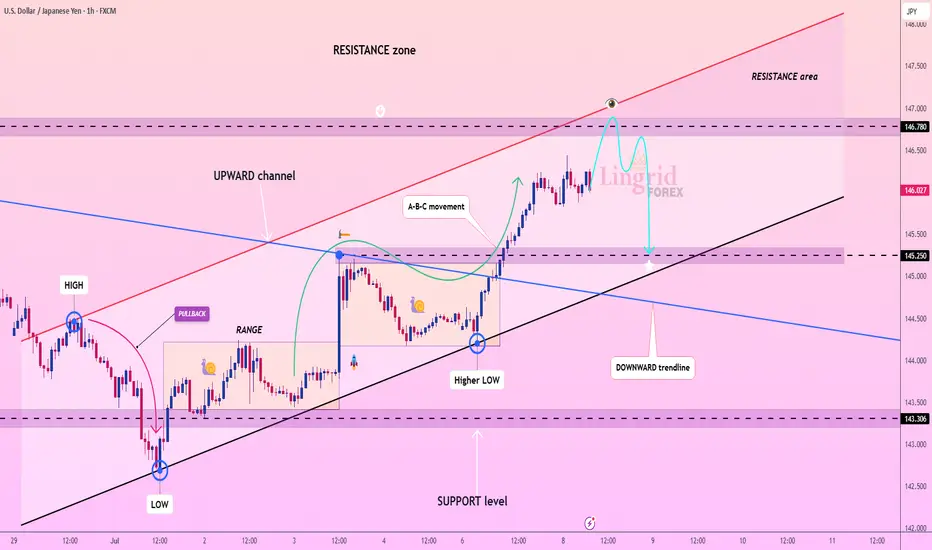
Lingrid | USDJPY Pullback From the Key Resistance ZoneThe price perfectly fulfilled my previous idea . FX:USDJPY is moving inside an upward channel after reclaiming support near 145.25 and breaking out from its previous range. The pair printed a higher low and is now approaching resistance around 146.78, testing the upper boundary of the ascending channel. If it fails to break through the red resistance trendline, a retracement toward the 145.25–145.00 support is likely.
📈 Key Levels
Buy zone: 146.78 - 147.00
Sell trigger: rejection from 146.78 and lower high below resistance
Target: 145.25
Buy trigger: bullish breakout above 147.00 with momentum confirmation
💡 Risks
Price rejection near 146.78 may cause a sharp pullback
A surge above 147.00 breaks trendline structure
Market reaction to macro data could distort short-term pattern
If this idea resonates with you or you have your own opinion, traders, hit the comments. I’m excited to read your thoughts!
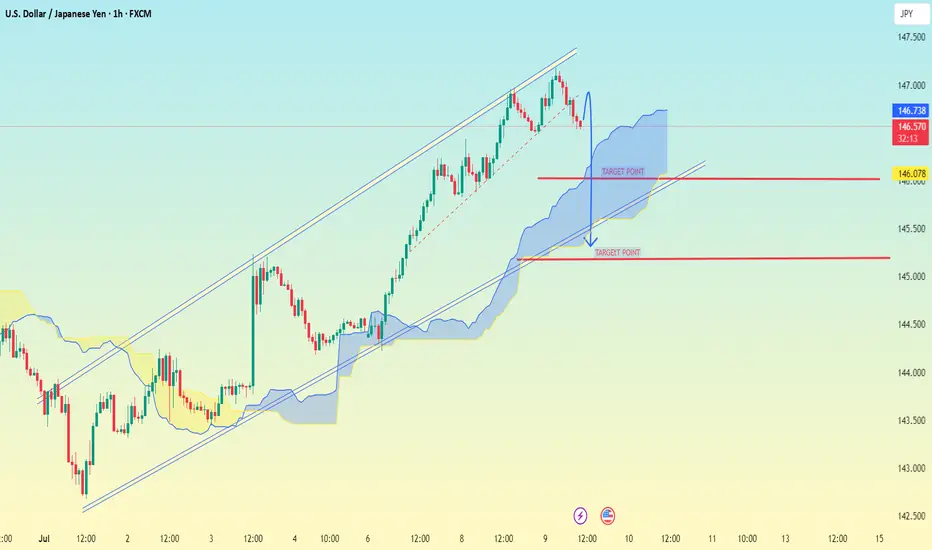
USD/JPY 1H chart PATTERNUSD/JPY 1H chart, the pair has broken below an ascending channel, which is typically a bearish signal. The price is currently inside the Ichimoku cloud, indicating uncertainty, but a breakdown seems likely.
📉 Bearish Target Points:
1. First Target:
✅ 146.078 — Near the bottom edge of the Ichimoku cloud and a horizontal support level.
2. Second Target:
✅ 145.300 — Clear support zone below the cloud, also aligns with previous consolidation area.
---
🔎 Additional Notes:
A breakdown below the Ichimoku cloud will confirm stronger bearish momentum.
Watch for a retest of the lower trendline or cloud support before a deeper drop.
Use stop-loss above 146.80 to manage risk if you're trading this setup.
Let me know if you want a buy/sell entry recommendation or SL/TP planning.
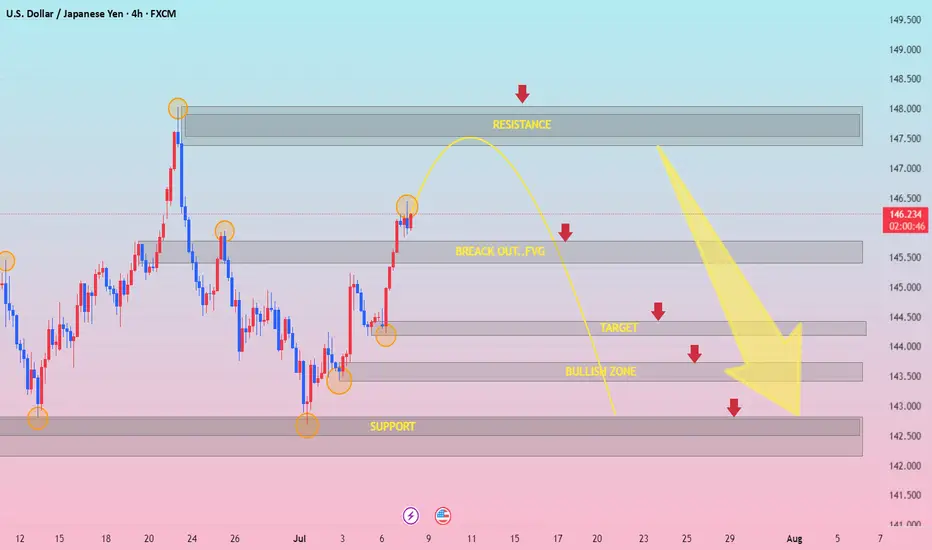
USDJPY h4 strongly downBearish Expectation Disruption / Bullish Counterpoint
Resistance (147.5) Rejection and drop Breakout and continuation toward 148.5+
Breakout FVG Fakeout and reversal True breakout — bullish trend continues
Bullish Zone (~144) Clean break below Accumulation zone, strong buying interest may emerge
Target (~143) Next leg down May not be reached if price stabilizes above 145
Support (~142.5) Final drop destination Could become irrelevant if trend flips decisively bullish Original Assumption: Market is behaving in isolation from fundamentals.
Disruption: If U.S. data (e.g., strong NFP, CPI, or Fed commentary) supports rate hikes, USD/JPY may remain bid and breakout to 148+ instead of reversing.
Watch For: Strong dollar narrative or dovish BOJ language.
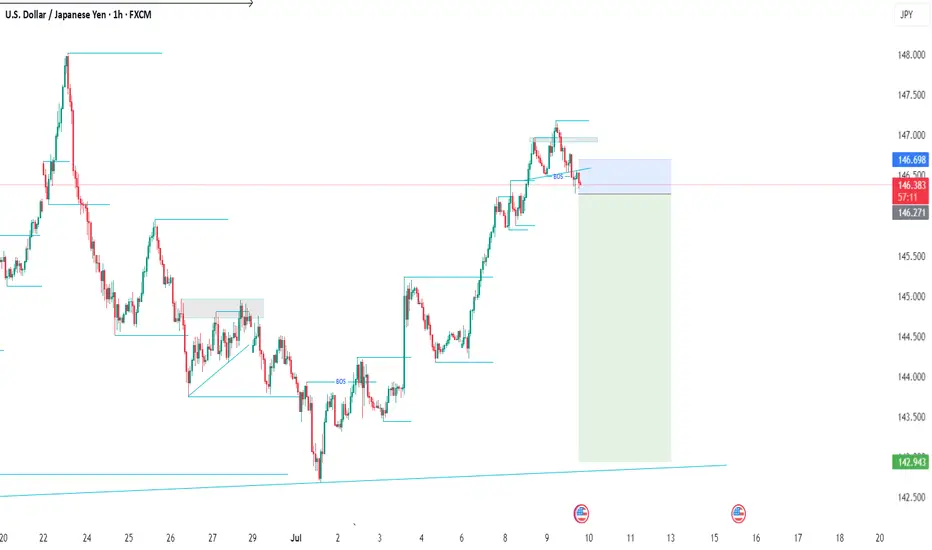
10.07.25 Morning ForecastPairs on Watch -
FX:USDJPY (live position)
FX:EURNZD
FX:EURUSD
A short overview of the instruments I am looking at for today, multi-timeframe analysis down to what I will be looking at for an entry. Enjoy!

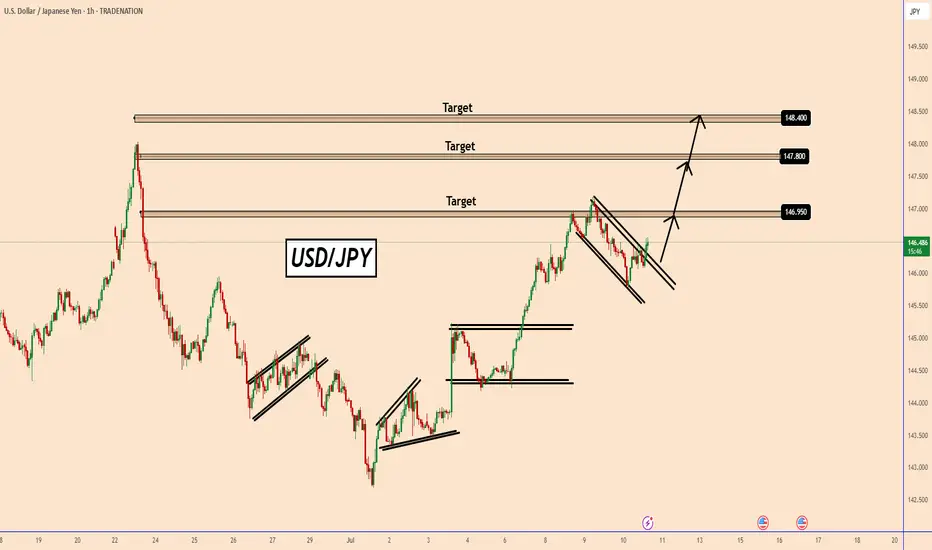
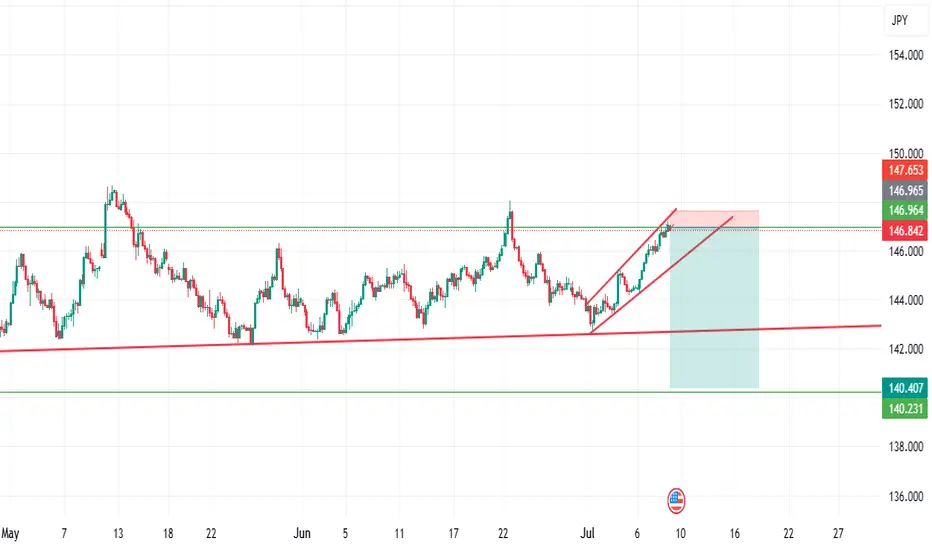
USDJPY : More Upside Ahead?USDJPY : More Upside Ahead?
USDJPY remains firmly in a bullish trend, largely driven by renewed tariff concerns.
The yen weakened sharply after U.S. President Donald Trump reaffirmed plans to impose 25% tariffs on Japanese goods starting August 1st.
Since that announcement, USDJPY has rallied nearly 200 pips before encountering some profit-taking.
Despite the brief pause, the broader trend remains intact, and the pair appears poised for further gains.
Key upside targets to watch:
146.95
147.80
148.40
You may find more details in the chart!
Thank you and Good Luck!
PS: Please support with a like or comment if you find this analysis useful for your trading day
Disclosure: I am part of Trade Nation's Influencer program and receive a monthly fee for using their TradingView charts in my analysis.
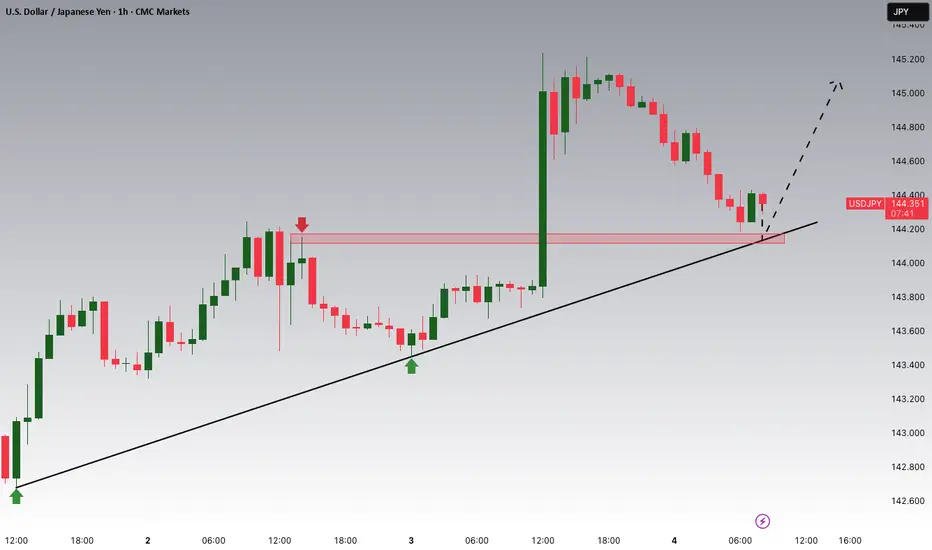
USDJPY Potential UpsidesHey Traders, in today's trading session we are monitoring USDJPY for a buying opportunity around 144.100 zone, USDJPY is trading in an uptrend and currently is in a correction phase in which it is approaching the trend at 144.100 support and resistance area.
Trade safe, Joe.
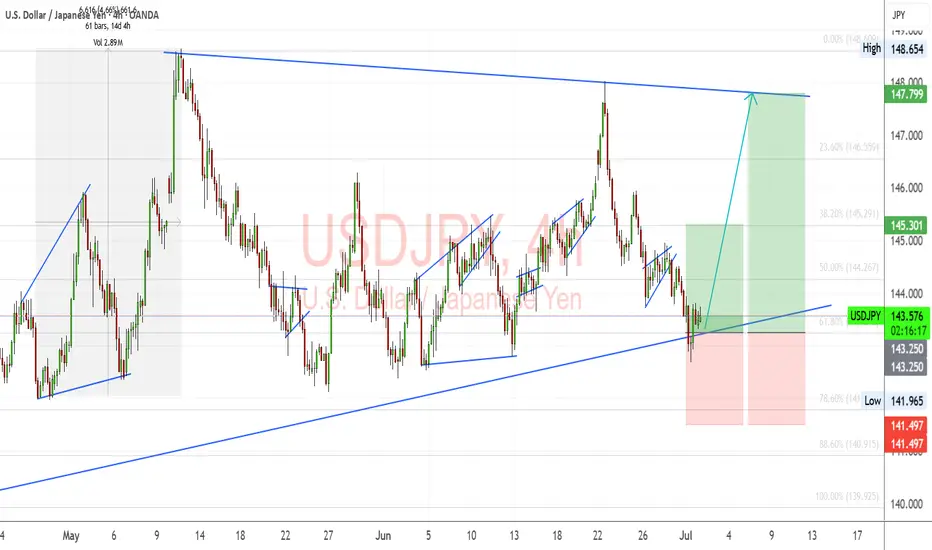
USDJPY – Key Support Bounce with Macro TailwindsUSDJPY is bouncing off a key trendline and 61.8% Fib zone (143.25–143.60) with confluence across multiple JPY crosses (EURJPY, AUDJPY, CADJPY). This area has historically triggered strong upside momentum, and the current setup aligns with both technical structure and macro drivers.
📊 Fundamentals Supporting the Move:
✅ US Yields Stable: US10Y is holding above 4.20%, keeping USDJPY supported. If yields push back toward 4.30%, expect USDJPY to retest 145.30 and potentially 147.80.
✅ BoJ Dovish: Japan shows no shift in policy. Despite weak Tankan data, BoJ remains patient, and no meaningful rate hike or YCC change is expected soon.
✅ USD Macro Resilience: Core PCE held firm at 2.6%. Focus now shifts to ISM Services PMI (Wed) and NFP (Fri). Markets are still pricing a soft landing – supporting risk-on and a stronger USD.
✅ JPY as a Fading Safe Haven: Even with geopolitical headlines (Trump tariff tensions, Taiwan, Middle East), JPY demand remains weak. Traders are favoring USD and Gold over JPY as risk hedges.
⚠️ Risks to Watch:
Dovish US Data Surprise: Weak NFP or ISM could drag yields down and trigger USDJPY reversal.
Verbal or Actual BoJ Intervention: If we approach 148.50–150, Japan may step in again.
Geopolitical Escalation: Any sharp risk-off could trigger safe haven demand for JPY, though this has underperformed recently.
🔎 Correlation Dynamics:
📈 USDJPY is leading JPY crosses like EURJPY and AUDJPY. The recent bounce started simultaneously across the JPY complex, with USDJPY slightly ahead.
📉 If US yields drop or risk sentiment shifts, USDJPY may lag gold or bonds but eventually catch up.
🧠 Trading Plan:
📍 Entry Zone: 143.30–143.60 (trendline + Fib confluence)
🎯 Target 1: 145.30 (38.2% Fib)
🎯 Target 2: 147.80 (channel resistance)
🛑 Invalidation: Daily close below 141.50 with US yields breaking down
📅 Upcoming Events to Watch:
Wed July 3: ISM Services PMI (key for USD reaction)
Fri July 5: US Non-Farm Payrolls + Average Hourly Earnings
JPY Risk: Verbal intervention possible near 148+
🧭 Summary:
USDJPY is positioned for a bullish continuation, backed by:
Rising yields
Resilient US macro
Weak JPY fundamentals
Technical structure respecting trendline support
Short-term traders can target the 145–147.80 range ahead of NFP, with a tight eye on yield and risk sentiment.
📌 If this analysis helps, drop a like and follow for more real-time macro-technical breakdowns. Stay nimble ahead of NFP! 🧠📈
USDJPY 1:3 4HR Trade Idea - ICTBeautiful 1:3 Trade idea on USDJPY - I am bearish on DXY and also bearish on JXY but the pair itself is shifting bullish so I am more inclined into a long (this is due to JXY dropping more rapidly than DXY shifting it bullish).
USDJPY ENTRY CHARTWe are still bullish on this pair, the JPY is still WEAK, and the trend on this Pair is BULLISH, price is sitting on a ZONE, we have our LTF confirmation set also, You can add to watch-list if this matches with your trade idea on this pair, and as for us, we advise you move BREAK-EVEN after price move +1r. THANK YOU.
USDJPY SELLWe have officially gotten a change of trend as proven by the transition from a sequence of higher highs and higher lows to a lower low and lower high. Stacked on top of this sequence is a pullback for a retest of a key level confirming our setup.
USDJPY is about to sellFrom my analysis, we can see that usdjpy is about to sell... because of the bearish signal ... wait for breakout for confirmation. Trade responsibly. Goodluck
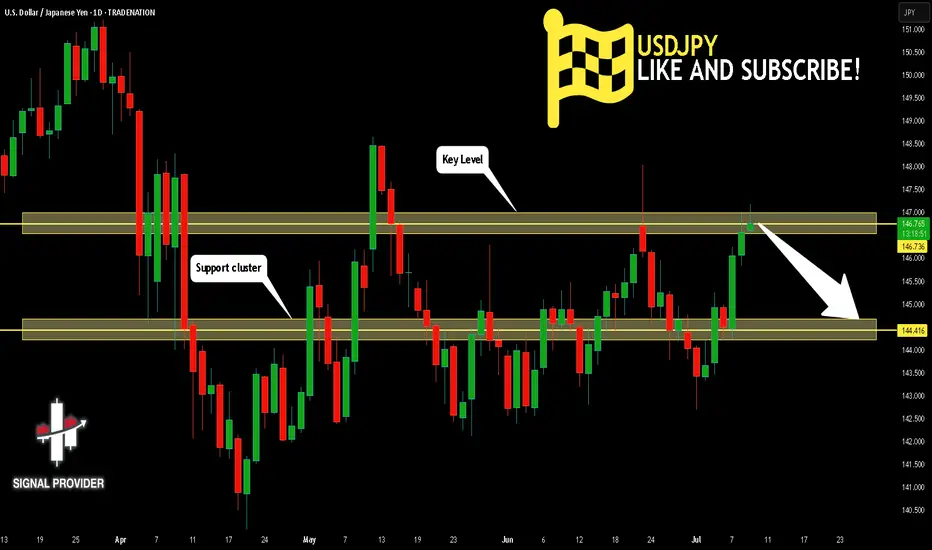
USDJPY Will Go Down! Sell!
Here is our detailed technical review for USDJPY.
Time Frame: 1D
Current Trend: Bearish
Sentiment: Overbought (based on 7-period RSI)
Forecast: Bearish
The market is approaching a significant resistance area 146.736.
Due to the fact that we see a positive bearish reaction from the underlined area, I strongly believe that sellers will manage to push the price all the way down to 144.416 level.
P.S
We determine oversold/overbought condition with RSI indicator.
When it drops below 30 - the market is considered to be oversold.
When it bounces above 70 - the market is considered to be overbought.
Disclosure: I am part of Trade Nation's Influencer program and receive a monthly fee for using their TradingView charts in my analysis.
Like and subscribe and comment my ideas if you enjoy them!
USDJPY 30Min Engaged ( Bullish Entry Detected )➕ Objective: Precision Volume Execution
Time Frame: 30-Minute Warfare
Entry Protocol: Only after volume-verified breakout
🩸 Bullish From now Price : 146.350
➗ Hanzo Protocol: Volume-Tiered Entry Authority
➕ Zone Activated: Dynamic market pressure detected.
The level isn’t just price — it’s a memory of where they moved size.
Volume is rising beneath the surface — not noise, but preparation.
🔥 Tactical Note:
We wait for the energy signature — when volume betrays intention.
The trap gets set. The weak follow. We execute.
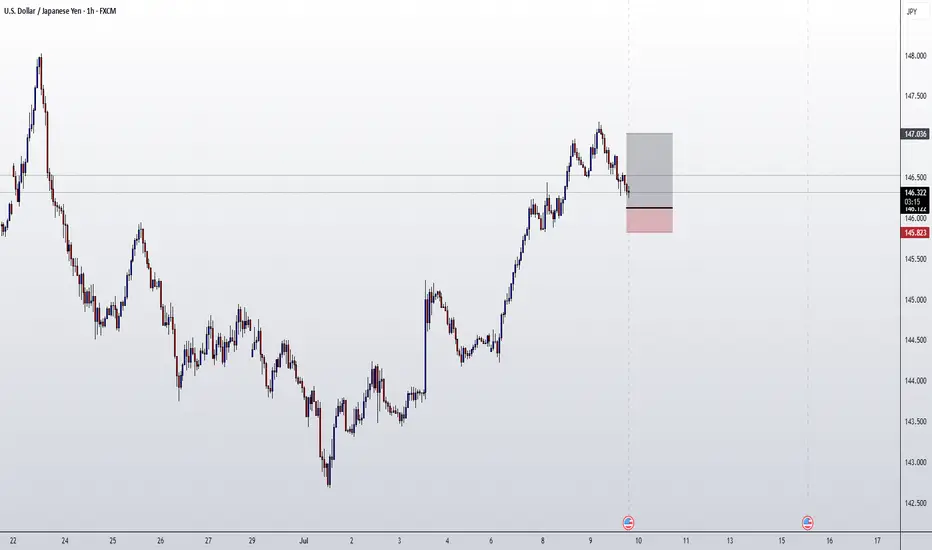
08.07.25 Morning ForecastPairs on Watch -
FX:EURUSD
FX:USDJPY
A short overview of the instruments I am looking at for today, multi-timeframe analysis down to what I will be looking at for an entry. Enjoy!

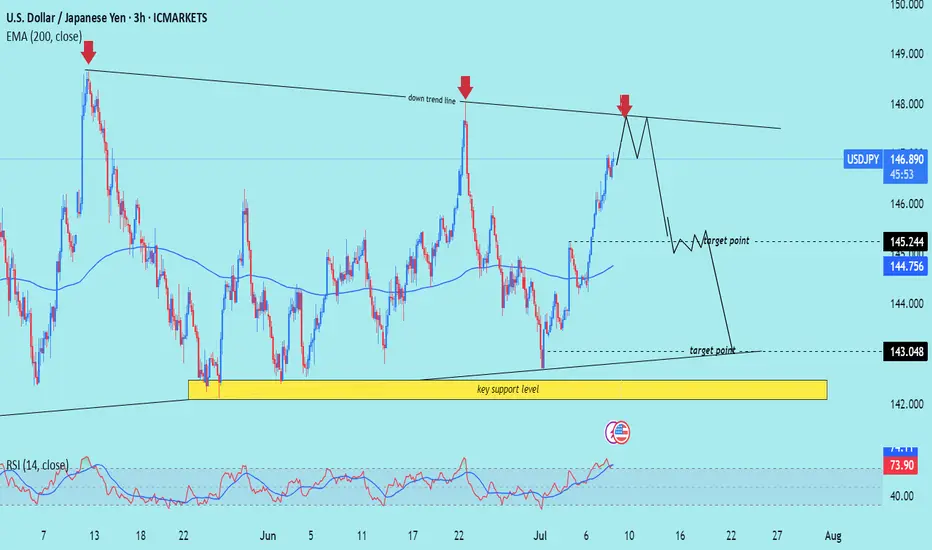
USD/JPY) back down Trend Read The captionSMC trading point update
Technical analysis of USD/JPY (U.S. Dollar / Japanese Yen) on the 3-hour timeframe, anticipating a rejection from a descending trendline resistance and a move down toward key support levels.
---
Analysis Overview:
Trend Bias: Bearish correction expected
Structure: Price is reacting at a descending trendline, which has held as resistance on multiple occasions.
Indicators:
EMA 200 (144.756): Price is currently above, but projected to break below it.
RSI (14): Overbought at ~74, signaling potential for a reversal.
---
Key Technical Components:
1. Descending Trendline Resistance:
Price is approaching/has touched a well-respected downtrend line, marked by three strong rejections (red arrows).
This trendline has consistently capped bullish moves, indicating strong seller interest.
2. Bearish Reversal Expectation:
The projected path suggests a potential fake breakout or double-top, followed by a steep decline.
A two-stage drop is anticipated, with price first targeting the EMA 200 zone, then extending lower.
3. Target Points:
First target: Around 145.244, near EMA 200.
Final target: 143.048, aligning with the key support zone (highlighted in yellow), where price previously bounced.
4. RSI (14):
Currently overbought (73.29), signaling a likely retracement.
Prior peaks at this level led to notable corrections.
---
Trade Setup Idea:
Parameter Level
Entry Near current price (~146.85) if bearish pattern confirms
Stop-Loss Above trendline (~147.30–147.50)
Target 1 145.24 (EMA 200 zone)
Target 2 143.05 (Support zone)
This setup offers a high-probability short opportunity if resistance holds.
---
Risk Factors:
Upcoming economic events could trigger volatility (news icon marked).
A clean breakout and close above the trendline (~147.50+) would invalidate this bearish thesis.
Mr SMC Trading point
---
Summary:
The analysis suggests a potential USD/JPY reversal from a descending trendline, supported by overbought RSI and prior rejections. The bearish projection targets a move toward 143.048, following a dip below the EMA 200 level at 145.244.
Please support boost 🚀 this analysis)
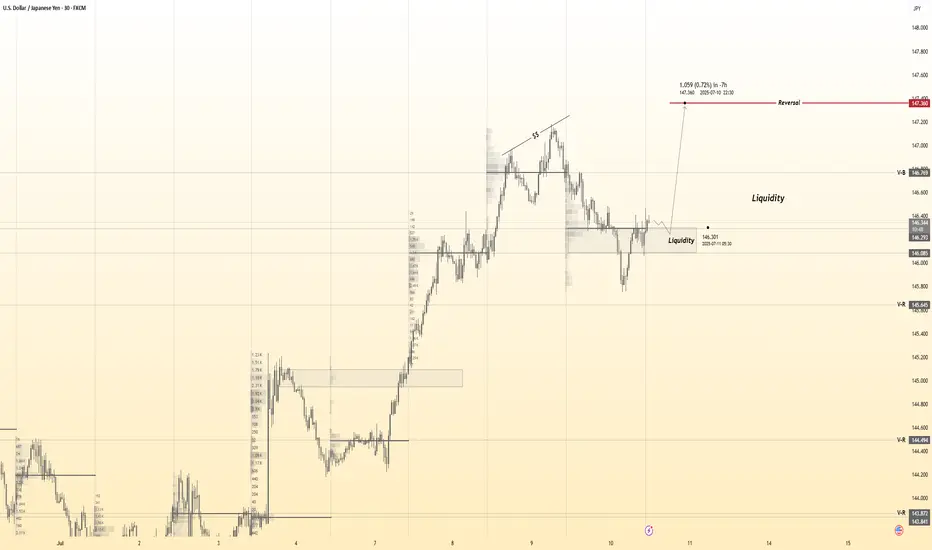
11.07.25 USDJPY Trade Recap + Re-Entry for +2.5%A long position taken on USDJPY for a breakeven, followed by a premature re-entry that I took a loss on. I also explain the true re-entry I should have taken for a 2.5% win.
Full explanation as to why I executed on these positions and also more details around the third position that I did not take.
Any questions you have just drop them below 👇

End of Week analysis (USDJPY)Sorry for the late video but we are looking good for another continuation day. we have some strong bullish momentum now to tap into that untapped daily wick. from there we will see some strong resistance.
Happy trading everyone hope everyone had a great week.

USDJPY: Up to +2000 Pips Move! Stay Tuned USDJPY has been accumulating for a long time, and we are confident that the price will enter the distribution phase. This phase will be extremely bullish, leading the price to new record highs and potentially surpassing 160. We wish you the best in trading and have a great week ahead.
Like and comment for more!
Team Setupsfx_
❤️🚀