U.S. Dollar / Japanese Yen forum
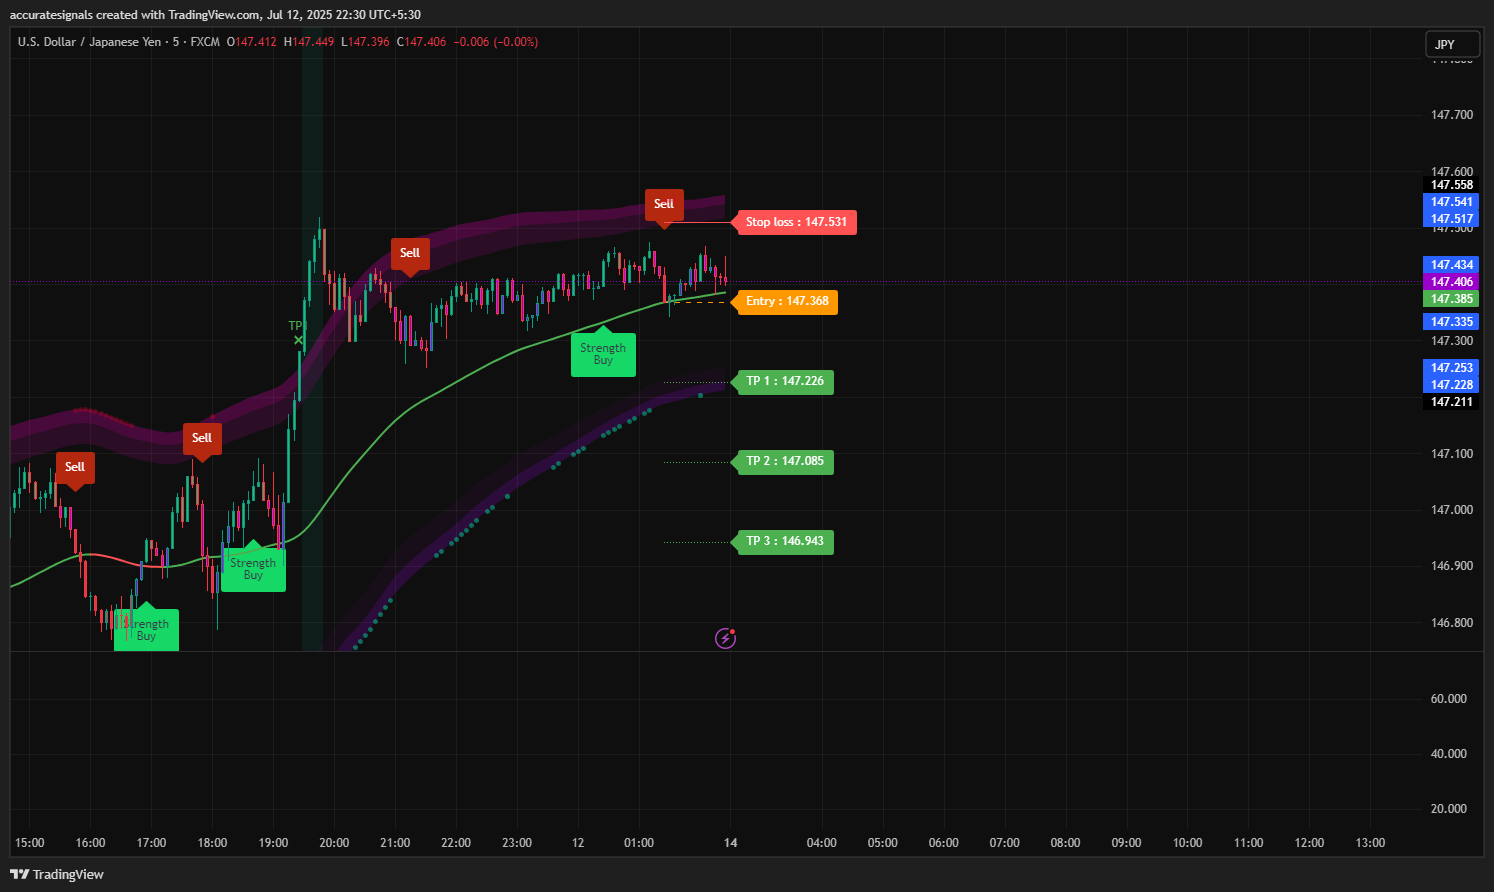
tp 147.550
tp 147.750
tp 147.970
tp 148.250
sl 146.850
Key drivers include Fed-BoJ policy divergence and strong U.S. yields.
You’re here to survive.
Trading is not a battle of strategy. It's a battle of survival.
2/2 Summary of Key Levels
Daily & 4-Hour Support and Resistance
Daily Support Levels: 145.500, 144.800, 144.200
Daily Resistance Levels: 147.500, 148.000, 148.500
4-Hour Support Levels: 146.200, 145.800, 145.300
4-Hour Resistance Levels: 147.000, 147.600, 148.000
Exponential Moving Average (EMA) Levels
Daily EMA Levels:
EMA 50: 146.500
EMA 100: 145.800
EMA 200: 144.300
EMA 400: 143.200
4-Hour EMA Levels:
EMA 50: 146.800
EMA 100: 146.200
EMA 200: 145.600
EMA 400: 144.500
Weekly and Daily Pivots
Weekly Pivots:
Pivot Point: 146.500
Resistance 1: 147.000
Support 1: 145.000
Daily Pivots:
Pivot Point: 146.750
Resistance 1: 147.250
Support 1: 146.250
Fibonacci Retracement Levels
23.6% Level: 146.034
38.2% Level: 145.500
50% Level: 145.357
61.8% Level: 144.214
78.6% Level: 143.500
Fundamental Analysis and Upcoming USD News
📈 As traders analyze the USDJPY market, it is essential to consider upcoming economic events that may influence the USD. This week, the following key U.S. economic indicators are scheduled for release:
Consumer Price Index (CPI): Expected to be released on July 12, 2025. A higher than expected CPI may bolster the USD, leading to potential upward pressure on USDJPY.
Retail Sales Data: Scheduled for July 15, 2025. Strong retail sales figures can indicate consumer confidence and spending, further supporting the USD.
Federal Reserve Meeting Minutes: Expected on July 18, 2025. Insights into future monetary policy could significantly impact market sentiment and the USDJPY exchange rate.
The outcomes of these events could create volatility in the USDJPY pair, making it crucial for traders to stay informed and adjust their strategies accordingly.
Conclusion
In summary, the USDJPY pair is currently trading at 146.896, situated between key support and resistance levels. The technical indicators analyzed—Fibonacci retracement levels, EMAs, RSI divergence, order blocks, and MACD—provide a comprehensive view of the market dynamics.