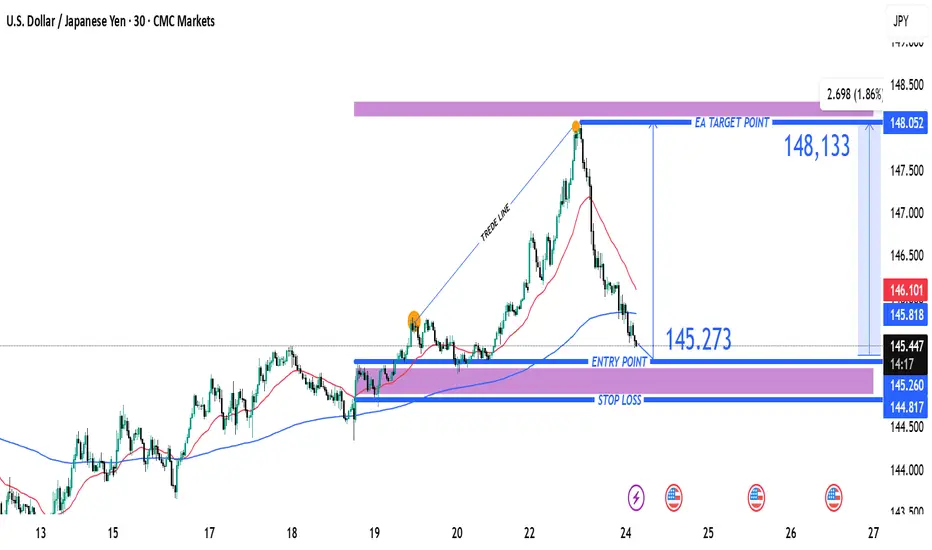
USD/JPY Bullish Reversal Trade Setup – Key Support Test at 145.2Entry Point: 145.273 (highlighted in blue)
Stop Loss: ~144.817–145.260 (purple zone)
Target Point (TP): 148.133 (upper resistance zone)
📉 Recent Price Action:
Price peaked near 148.05 before reversing sharply and breaking the trendline.
The market is currently testing the support zone (near the 145.273 entry level).
Moving averages (red = short-term, blue = long-term) show a crossover to the downside, suggesting short-term bearish momentum.
📈 Trade Setup:
Strategy Type: Long (Buy) Setup
Risk/Reward: Favorable, approximately 1:2+
Entry Zone: The current price is close to the entry level at 145.273, making this a timely area to watch for a bounce or confirmation.
⚠️ Risk Factors:
If price breaks below 144.817, the setup becomes invalid.
Short-term momentum is still bearish; confirmation (like a bullish engulfing candle or support hold) is important before entering.
✅ Confirmation Triggers for Entry:
Strong bullish candlestick pattern near entry zone.
RSI or MACD bullish divergence (not shown but useful to check).
Volume spike on bounce from support.
USDJPY trade ideas
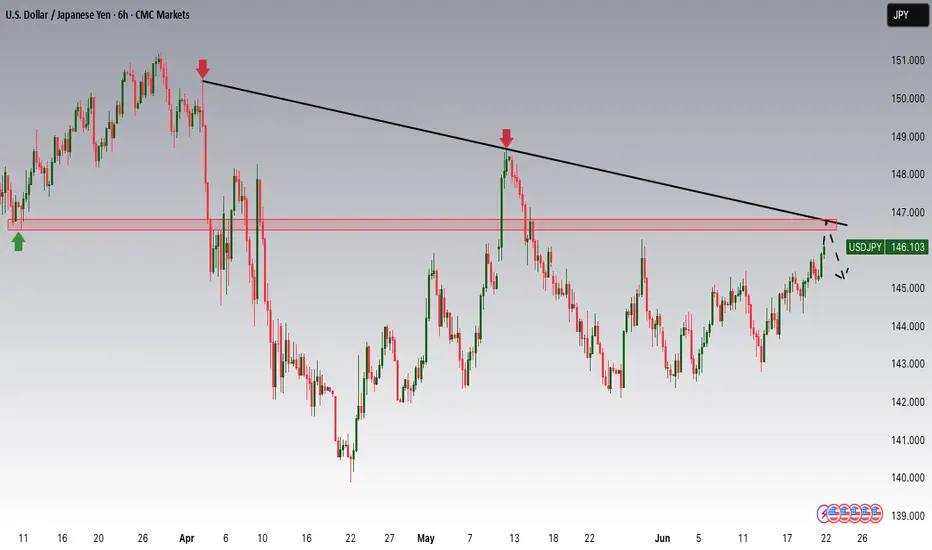
Trading Recommendations and Analysis for USDJPYThe technical picture on Monday may shape future developments in the medium term. The week began a gap up, followed by the formation of a long upper shadow. The daily close occurred exactly at the support level of 146.11 thereby closing the gap.
Today's trading also opened exactly at the same level, and the candle is already black in the early hours of trading. This defines Monday's movement as false, thus creating a strong bearish signal, with a potential breakdown of the 143.45 support and a subsequent decline toward the MACD line, which coincides with the target level of 141.70. The Marlin oscillator has turned downward. its return to negative territory will add additional pressure on the price.
In the H4 timeframe, the price has consolidated below the 146.11 level, making it easier to settle below the MACD line eventually.
A break below 145.48 -the June 11 high-will serve as confirmation. The Marlin oscillator appears to be fixed in bearish territory and has joined the new downward movement.
USDJPY h4 strongly bullish opportunity Dip into/under support (~144.5)
2. Trap and reverse hard
3. Break above 148 with momentum
4. Stretch target → 149.50–150.20
USD/JPY Bearish Flag (30.06.2025)The USD/JPY Pair on the M30 timeframe presents a Potential Selling Opportunity due to a recent Formation of a Bearish Flag Breakout Pattern. This suggests a shift in momentum towards the downside in the coming hours.
Possible Short Trade:
Entry: Consider Entering A Short Position around Trendline Of The Pattern.
Target Levels:
1st Support – 143.40
2nd Support – 142.86
🎁 Please hit the like button and
🎁 Leave a comment to support for My Post !
Your likes and comments are incredibly motivating and will encourage me to share more analysis with you.
Best Regards, KABHI_TA_TRADING
Thank you.
Disclosure: I am part of Trade Nation's Influencer program and receive a monthly fee for using their TradingView charts in my analysis.

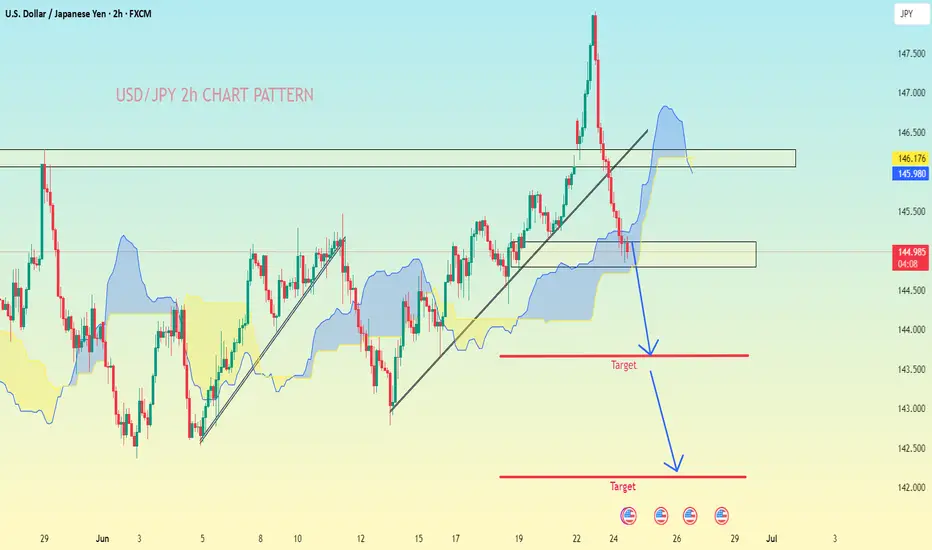
USD/JPY.2h chart patternI'm provided for USD/JPY on the 2-hour timeframe, here is a detailed breakdown and target analysis:
---
🔍 Technical Analysis Summary
Pair: USD/JPY
Timeframe: 2H
Current Price: ~144.98
Trend: Bearish
Breakdown Confirmation: Price broke structure support and the ascending trendline.
Indicators: Price is below the Ichimoku cloud, confirming bearish momentum.
---
🎯 Identified Targets (Based on Your Chart)
1st Target Level (Nearest Support Zone):
Price Level: Around 143.50
This is the first horizontal red line marked as a "Target" on your chart.
Likely to act as a short-term support level.
2nd Target Level (Major Support):
Price Level: Around 142.00
This is the second and lower red line marked on your chart.
Strong historical support zone based on previous consolidation.
---
✅ Final Target Levels
Target # Price Level Description
Target 1 143.50 Initial support; take partial profit here
Target 2 142.00 Major target; potential reversal/support zone
---
Would you like a suggested stop-loss level or entry refinement based on candlestick confirmation or indicators (like RSI or volume)?
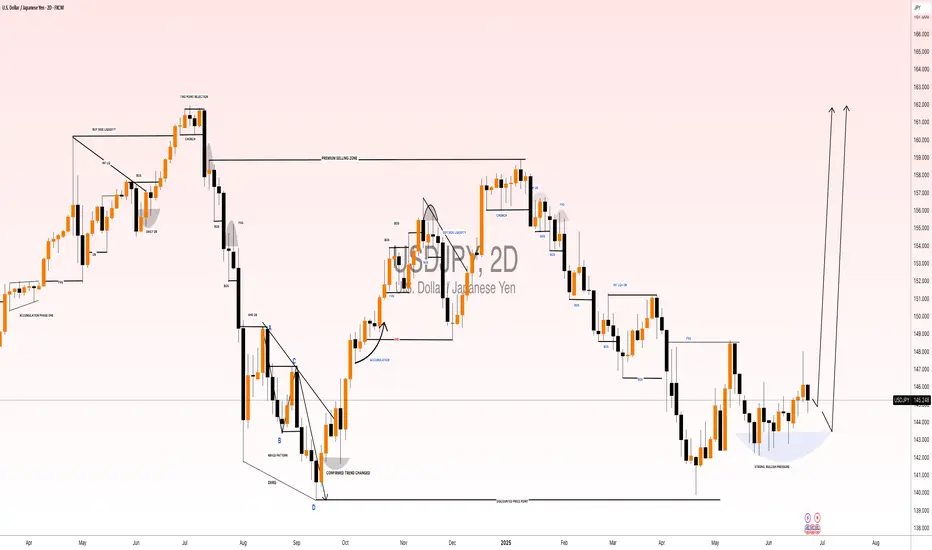
USDJPY: Up to +2000 Pips Move! Stay Tuned USDJPY has been accumulating for a long time, and we are confident that the price will enter the distribution phase. This phase will be extremely bullish, leading the price to new record highs and potentially surpassing 160. We wish you the best in trading and have a great week ahead.
Like and comment for more!
Team Setupsfx_
❤️🚀
USDJPY H2 Best Level to SHORT/HOLD TP +100/+200 pips🏆USDJPY H2 Market Update H2 chart
📊 Technical Outlook
🔸trading in well defined range
🔸trading near range highs now
🔸range highs set 148.40/148.80
🔸range lows set at 140.80/141.40
🔸strategy: SHORT SELL from resistance
🔸SL 60 pips TP1 +100 pips TP2 +200 pips
🔸swing trade setup for patient traders
🌍 FX Market Snapshot — June 2025
🇪🇺 EUR/USD (~1.1500)
Euro climbs near 1.15 as eurozone inflation cools and ECB turns more dovish.
Stable German sentiment provides support, but softer CPI could limit gains.
🔑 Support: 1.1445 | Resistance: 1.1550
🇬🇧 GBP/USD (~1.3435)
Pound slips toward 1.34 after recent highs, as UK data remains mixed.
Manufacturing picks up, but falling inflation boosts BoE rate cut bets.
🔑 Support: 1.3400–1.3420 | Resistance: 1.3500
🇺🇸 DXY (US Dollar Index, ~99.14)
Dollar edges higher as investors seek safety amid geopolitical tensions.
Mixed US economic signals; eyes on upcoming job data.
🔑 Support: 98.80 | Resistance: 100.00
🇯🇵 USD/JPY (~147.4)
Dollar rallies above 147 as yen weakens; BOJ stays ultra-loose.
Oil price spikes add extra pressure on JPY.
🔑 Support: 145.0 | Resistance: 148.5
📊 Quick View
Pair Rate Support Resistance Key Theme
🇪🇺 EUR/USD ~1.1500 1.1445 1.1550 Dovish ECB, soft CPI
🇬🇧 GBP/USD ~1.3435 1.3400–1.3420 1.3500 Mixed UK data
🇯🇵 USD/JPY ~147.4 145.0 148.5 Yen weakness
🇺🇸 DXY ~99.14 98.80 100.00 Geopolitical risks

USD/JPY) bearish Trand analysis Read The captionSMC trading point update
Technical analysis of USD/JPY (U.S. Dollar vs Japanese Yen) on the 1-hour timeframe. Here's a clear breakdown of the idea presented:
---
Overview of the Setup
Current Price: 144.620
EMA 200 (Blue Line): 144.973 – price is trading below the EMA, indicating bearish momentum.
Resistance Zone: Around 145.000 – 145.500
Support/Target Zone: Around 142.799
RSI Indicator: ~51.11 – neutral zone (not overbought or oversold)
---
Interpretation of Chart Structure
1. Resistance Level:
Price tested the resistance zone and sharply rejected it.
This zone has held multiple times historically, making it strong.
2. EMA 200 as Resistance:
Price rejected just under the EMA, further confirming downside pressure.
3. Bearish Flag / Rising Wedge Breakdown:
There is a visible bearish continuation pattern (likely a rising wedge or bear flag).
Price is projected to break down from this pattern, continuing the downtrend.
4. Measured Move Projection:
Previous drop of ~230 pips (-1.5%) is mirrored for the next expected move.
The same size move projects the price to reach the target zone around 142.799.
5. Support/Target Zone:
Marked as the final take-profit zone.
Corresponds with historical demand and likely buyer interest.
---
Trade Idea Summary
Bias: Bearish
Entry Idea: After breakdown confirmation below wedge structure or rejection from resistance zone.
Target: 142.799
Stop-Loss Consideration: Above the resistance zone (~145.500) or just above the recent swing high.
Confirmation: Breakdown of rising wedge + below EMA + repeated resistance rejections.
Mr SMC Trading point
---
Key Considerations
Upcoming News Events (Three Icons):
These symbols signal potential USD or JPY volatility, so watch out for data releases that could disrupt the pattern.
RSI Neutral:
RSI is not yet oversold, allowing room for more downside before hitting exhaustion levels.
False Breakouts Possible:
Price may fake a break upward before continuing lower – wait for strong candle confirmation if entering a trade.
plesse support boost 🚀 this analysis)
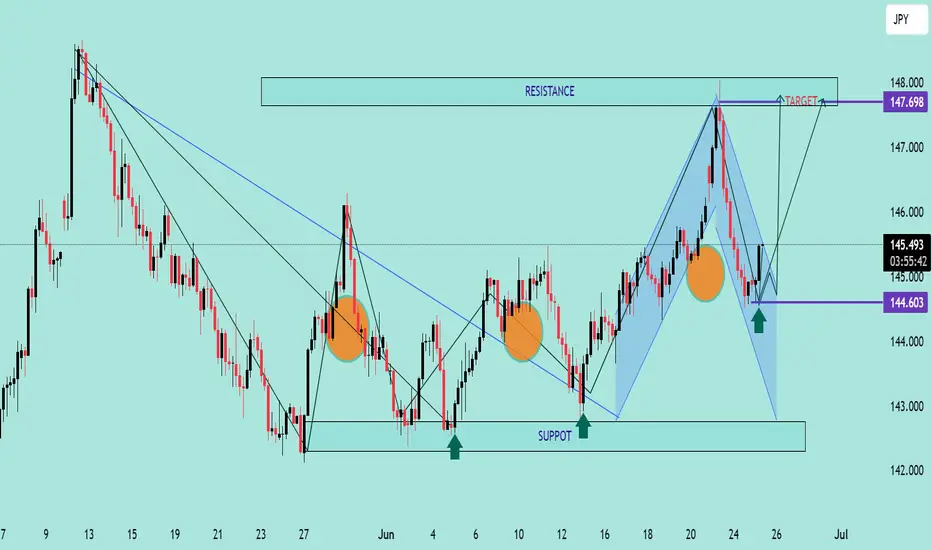
USD/JPY Bullish Reversal AnalysisUSD/JPY Bullish Reversal Analysis 📈💹
🔍 Technical Overview:
The chart illustrates a strong bullish reversal pattern forming on USD/JPY after price reacted from a key support zone at 144.600. This level has held firm multiple times, marked by green arrows, signaling strong buying interest.
📐 Chart Patterns & Structure:
✅ A bullish harmonic pattern (possibly a bullish Bat or Gartley) is completing near the 144.600 zone.
🔄 Multiple rejection wicks and bullish engulfing patterns indicate a potential upside reversal.
🔵 Descending trendlines have been broken, confirming momentum shift.
🔁 Previous resistance turned support (near 145.000) is acting as a possible launchpad for the next move.
🎯 Upside Target:
The projected move targets the resistance zone at 147.698, aligning with previous highs and a significant supply area.
If price breaks above 145.900 convincingly, continuation toward this resistance is expected.
🔻 Downside Risk:
A break below 144.600 would invalidate the bullish setup and expose price to the lower support range near 142.000–143.000.
📊 Conclusion:
USD/JPY is showing signs of bullish reversal from a strong demand zone. If price sustains above 145.000 and breaks the minor consolidation, the pair could rally toward 147.698 🎯.
Bias: Bullish ✅
Support: 144.600
Resistance: 147.698
USDJPY Potential UpsidesHey Traders, in tomorrow's trading we are monitoring USDJPY for a buying opportunity around 144.400 zone, USDJPY is trading in an uptrend and currently is in a correction phase in which it is approaching the trend at 144.400 support and resistance area.
Trade safe, Joe.

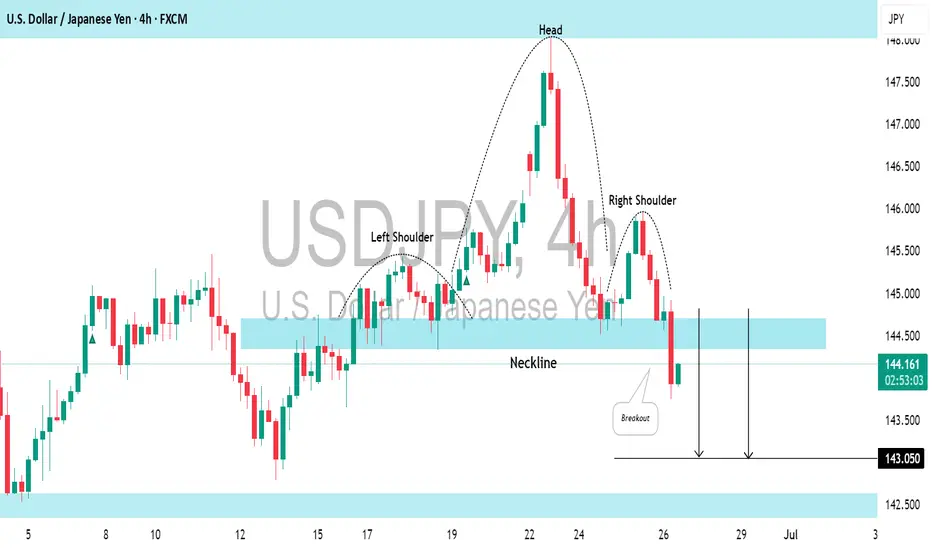
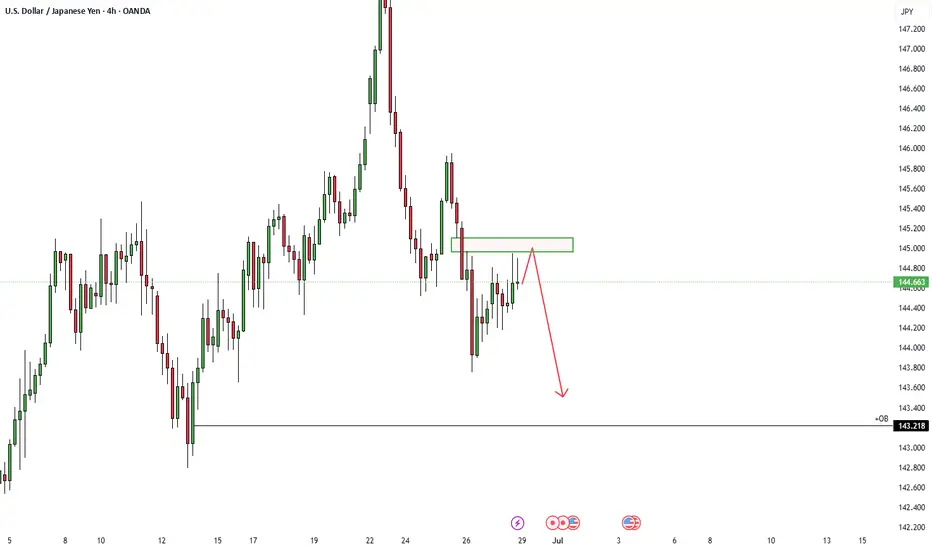
USDJPY: Classic Bearish PatternThe USDJPY has developed a significant head and shoulders pattern on the 4-hour time frame.
We see a confirmed breach of the neckline and an intraday candle closing below it.
The pair is likely to keep falling, with the next target at 143.05.
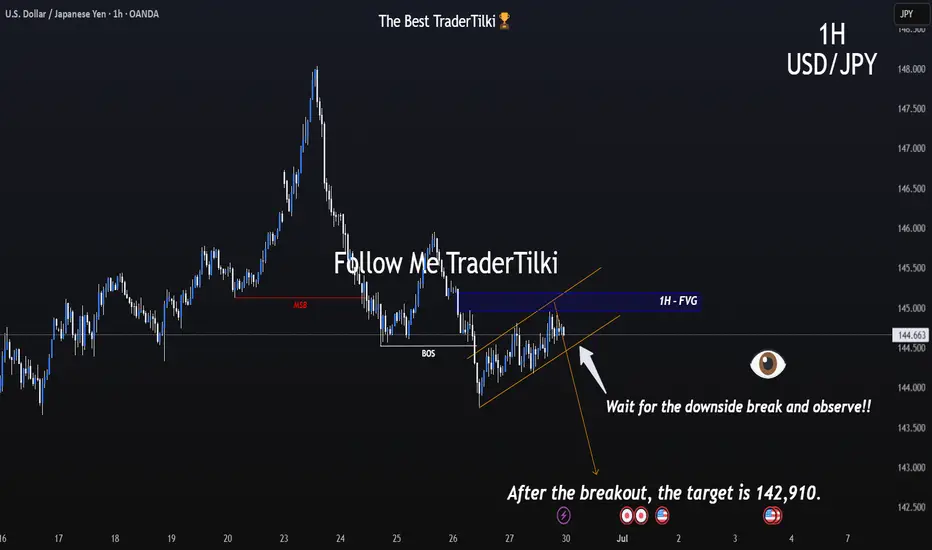
Critical Channel Watch Begins on the 1-Hour Chart of USDJPY.Hey everyone,
📉 My Latest USDJPY Analysis:
USDJPY is currently moving within a downtrend. If the price breaks below the lower boundary of the parallel channel, our first target level will be 142.910. The most crucial factor here is the downward breakout of that channel—don’t overlook it.
Also, keep a close eye on key economic data releases on the fundamental side, as they could significantly influence your strategy.
I meticulously prepare these analyses for you, and I sincerely appreciate your support through likes. Every like from you is my biggest motivation to continue sharing my analyses.
I’m truly grateful for each of you—love to all my followers💙💙💙
USDJPY is about to be bearish after a long retracement From the chart, you will see that usdjpy is about to sell for a long time.
Reasons;
1] Hanging man in daily timeframe
2] Trendline violation
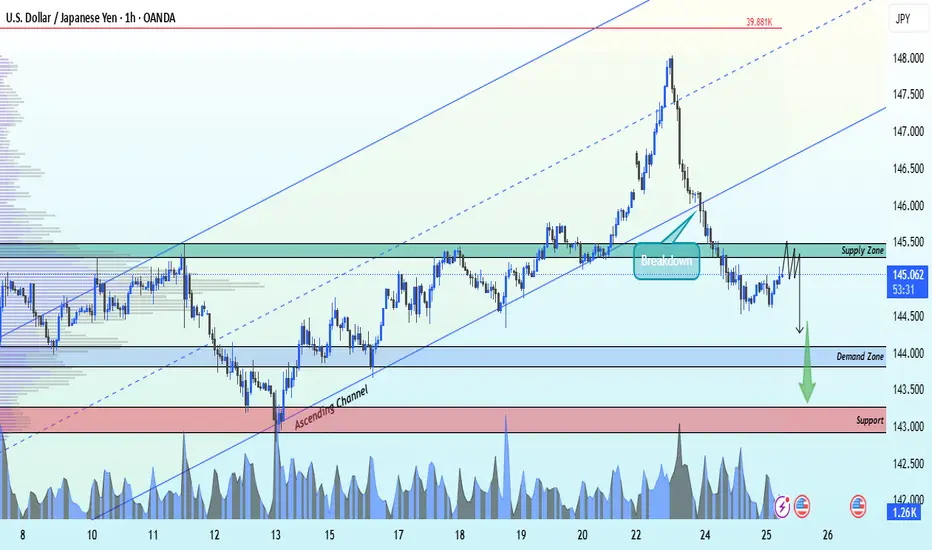
USDJPY Ascending channel breakdown ahead selling strong📉 USDJPY Breaks Down!
Strong sell-off from the key supply zone at 145.500 – the ascending channel has been broken on the 1H timeframe, signaling momentum shift.
🎯 Technical Targets:
🔹 1st Target: 144.000 – key demand zone
🔹 2nd Target: 143.000 – strong support level
Bearish pressure is building — price action confirms the shift. Eyes on lower zones as sellers take control. 📊
🔔 Like, Follow, and Comment your thoughts!
💬 Join us for more timely market updates and clean setups!
#USDJPY #ForexAnalysis #TechnicalTrading #PriceAction #FXSetup #LiviaTrades 😜
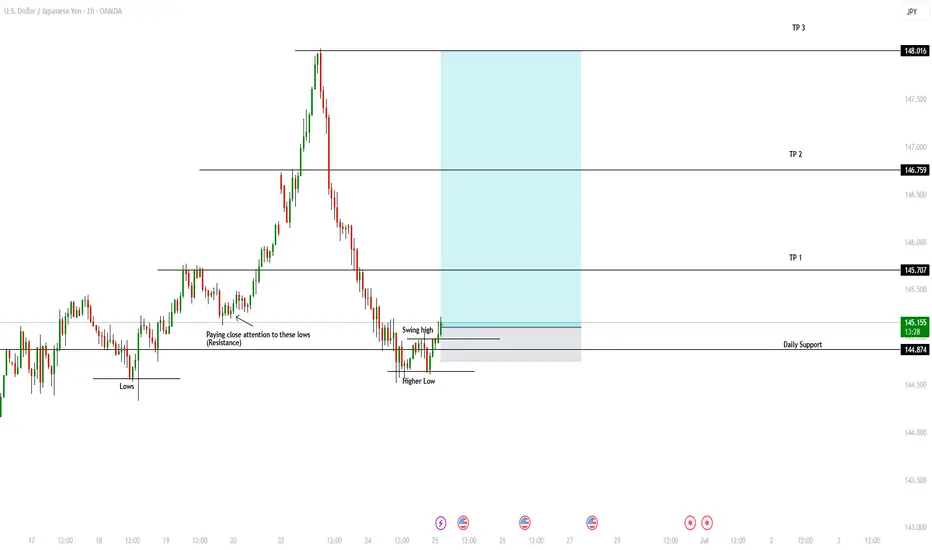
OANDA:USDJPY Buy SetupUSDJPY Buy Setup – Bullish Structure & Daily Rebound
USDJPY is showing signs of renewed bullish momentum after rejecting a significant daily low. Price action on the 1-hour timeframe has confirmed the formation of a higher low, followed by a clean break above a key daily support level—now turned support once again. This shift in market structure indicates a potential continuation of the uptrend, supported by higher highs and higher lows on the intraday chart.
Technical Highlights:
Strong rejection from a daily low zone
Bullish structure confirmed on the 1H timeframe
Price reclaiming a key support level and holding above it
Momentum suggests potential continuation toward higher targets
Trade Setup:
Entry: 145.110
Stop Loss: 144.754
Target Levels:
Take Profit 1: 145.709
Take Profit 2: 146.747
Take Profit 3: 148.014
This setup offers a favorable risk-to-reward ratio within a well-defined bullish context. Wait for a solid candle confirmation if not already entered, and always manage your risk according to your trading plan.
Drop your thoughts or questions in the comments, and if you found this valuable, hit boost and follow for more structured trade ideas. Wishing you precision and profits!
USD JPY --->>> SHORT!Sell on dollar against yen. Analysis based on the daily chart. Entry based on the hourly time frame.
USDJPY H4 Golden zone The USDJPY pair has finally reached the H4 golden Zone. M15 previous highs under threat. Are we bullish for the day
USD/JPY💰Symbol: { USD/JPY }
🟩Price: { 144.790 & 145.856 }
🟥Stop: { 145.415 & 146.660 }
1️⃣profit: { 144.279 & 144.916 }
2️⃣profit: { 143.780 & 143.780 }
3️⃣profit: { 142.746 & 142.746 }
4️⃣profit: { 142.139 }
📊Check your chart before entering.
🚨Check before use to make sure there is no important news.🚨
USDJPY Potential DownsidesHey Traders, in today's trading session we are monitoring USDJPY for a selling opportunity around 146.700 zone, USDJPY is trading in a downtrend and currently is in a correction phase in which it is approaching the trend at 146.700 support and resistance area.
Trade safe, Joe.
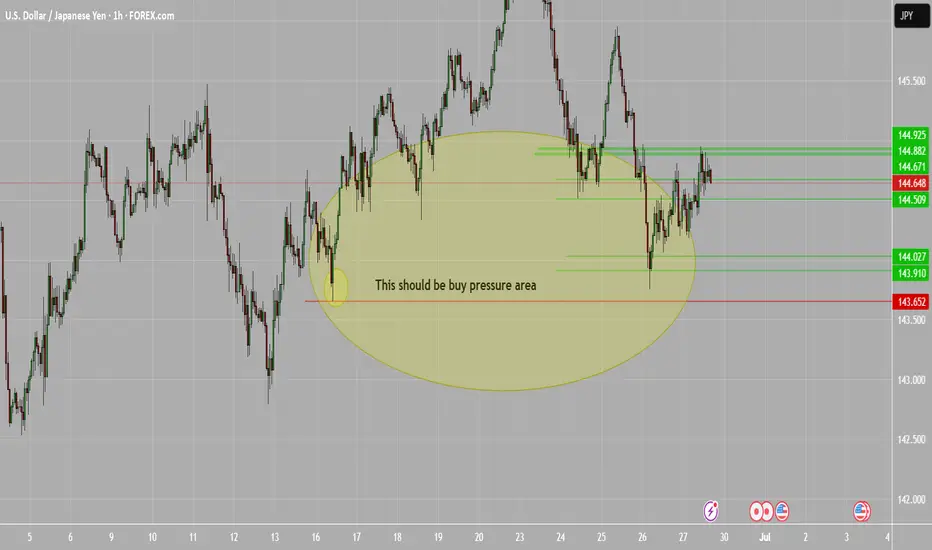
Buy pressure USD/JPYBuyers seeking to continue overall movement to 160 area. From the outside looking in all aspects of final test are being made and have been made at 144 area. This is a good number! Looking even closer, the sellers are selling too fast and are not going to be able to keep up that momentum in comparison to the overall pressure from the bottom. The top has been tested 3 strikes you out. Followed by the long steady ride up with bumps and traps along the way of course. Get your ticket now to get a good seat and watch.
Forecast USDJPY This is not financial advice. Educational purpose only."
I am preparing to take a short position on USDJPY starting next week, in alignment with the upcoming rollover of futures contracts. My analysis is based on a combination of technical, macroeconomic, behavioral, and institutional elements.
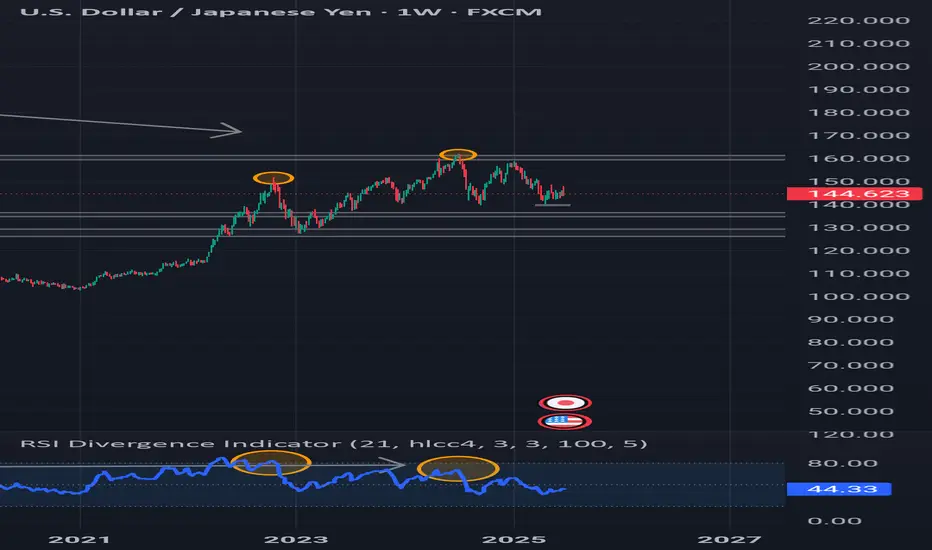
From a technical perspective, a clear bearish reversal divergence is visible on the weekly chart using the 21-period RSI based on HLCC/4. While the price is making higher highs, momentum is weakening, indicating a loss of bullish strength. This setup is reinforced by a long-term continuation divergence that has been forming since the major tops of 1971, suggesting a possible terminal phase in the current cycle.
COT data supports this view. Large speculators have been steadily reducing their long positions on USDJPY over recent weeks. More significantly, these same institutional players have begun accumulating long positions on Japanese yen futures (6J), often a precursor to a monetary rotation. The upcoming rollover of futures contracts next week could trigger a more pronounced shift in institutiona positioning.
Macroeconomic data from the United States also confirms a slowdown. Core PCE came in at 0.1%, below expectations. Nonfarm Payrolls underperformed, and the ISM Services Index dropped below 50, signaling contraction. In contrast, Japan maintains stable inflation around 2.3%, which gives the Bank of Japan room to begin policy normalization. The yield differential is starting to narrow, a historically bearish factor for USDJPY.
Finally, market sentiment remains skewed. Retail traders are still heavily positioned long on USDJPY. Such imbalances, where retail crowds are long and institutional players are exiting, often precede sharp reversals.
If the expected institutional reallocation materializes after the futures rollover, I will enter a short position. Technical, fundamental, and cyclical factors are now fully aligned.
"This is a personal market view. Always do your own research before making trading decisions."