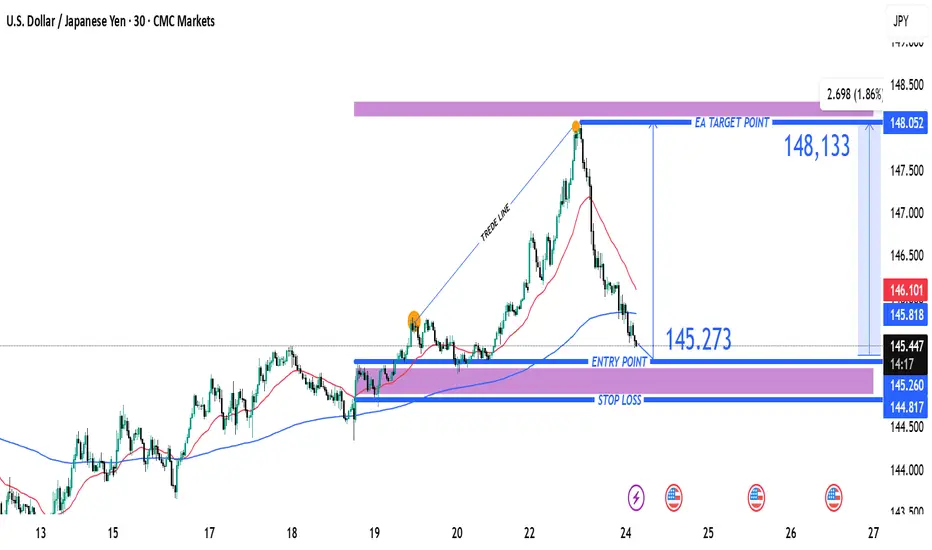
USD/JPY Bullish Reversal Trade Setup – Key Support Test at 145.2Entry Point: 145.273 (highlighted in blue)
Stop Loss: ~144.817–145.260 (purple zone)
Target Point (TP): 148.133 (upper resistance zone)
📉 Recent Price Action:
Price peaked near 148.05 before reversing sharply and breaking the trendline.
The market is currently testing the support zone (near the
About U.S. Dollar / Japanese Yen
Also known as trading the “gopher” the USDJPY pair is one of the most traded pairs in the world. The value of these currencies when compared to each other is affected by the interest rate differential between the Federal Reserve and the Bank of Japan.
Related currencies
Trading Recommendations and Analysis for USDJPYThe technical picture on Monday may shape future developments in the medium term. The week began a gap up, followed by the formation of a long upper shadow. The daily close occurred exactly at the support level of 146.11 thereby closing the gap.
Today's trading also opened exactly at the same level
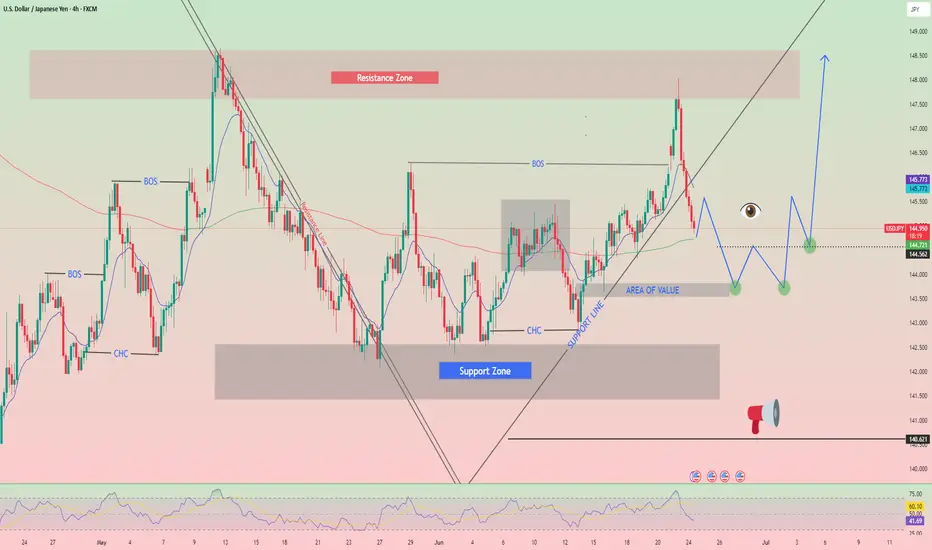
USDJPY h4 strongly bullish opportunity Dip into/under support (~144.5)
2. Trap and reverse hard
3. Break above 148 with momentum
4. Stretch target → 149.50–150.20
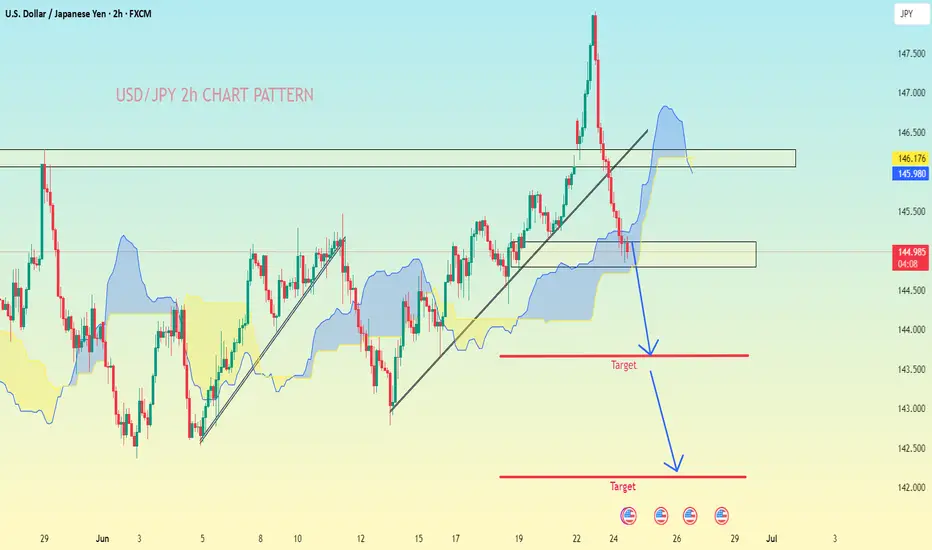
USD/JPY.2h chart patternI'm provided for USD/JPY on the 2-hour timeframe, here is a detailed breakdown and target analysis:
---
🔍 Technical Analysis Summary
Pair: USD/JPY
Timeframe: 2H
Current Price: ~144.98
Trend: Bearish
Breakdown Confirmation: Price broke structure support and the ascending trendline.
Indicato
USD/JPY Bearish Flag (30.06.2025)The USD/JPY Pair on the M30 timeframe presents a Potential Selling Opportunity due to a recent Formation of a Bearish Flag Breakout Pattern. This suggests a shift in momentum towards the downside in the coming hours.
Possible Short Trade:
Entry: Consider Entering A Short Position around Trendl

USDJPY H2 Best Level to SHORT/HOLD TP +100/+200 pips🏆USDJPY H2 Market Update H2 chart
📊 Technical Outlook
🔸trading in well defined range
🔸trading near range highs now
🔸range highs set 148.40/148.80
🔸range lows set at 140.80/141.40
🔸strategy: SHORT SELL from resistance
🔸SL 60 pips TP1 +100 pips TP2 +200 pips
🔸swing trade setup for patient traders

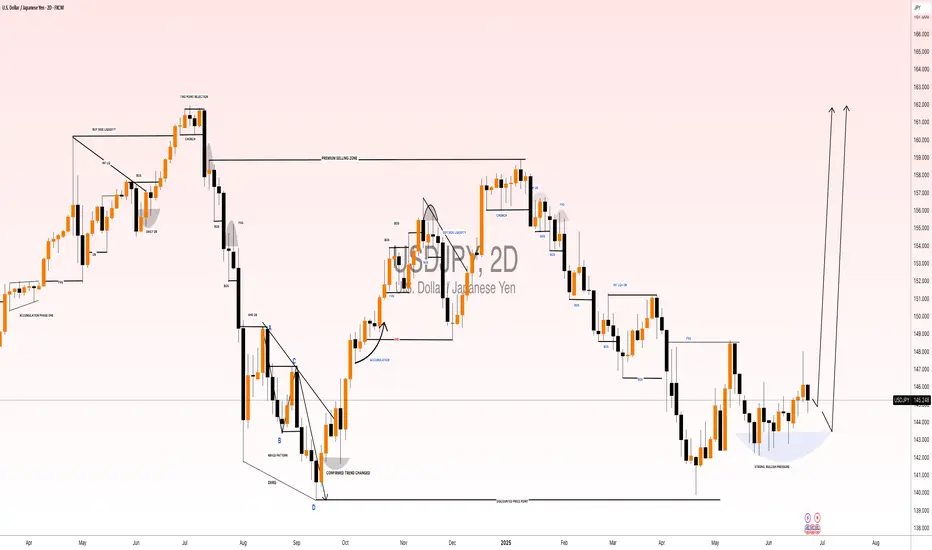
USDJPY: Up to +2000 Pips Move! Stay Tuned USDJPY has been accumulating for a long time, and we are confident that the price will enter the distribution phase. This phase will be extremely bullish, leading the price to new record highs and potentially surpassing 160. We wish you the best in trading and have a great week ahead.
Like and comm
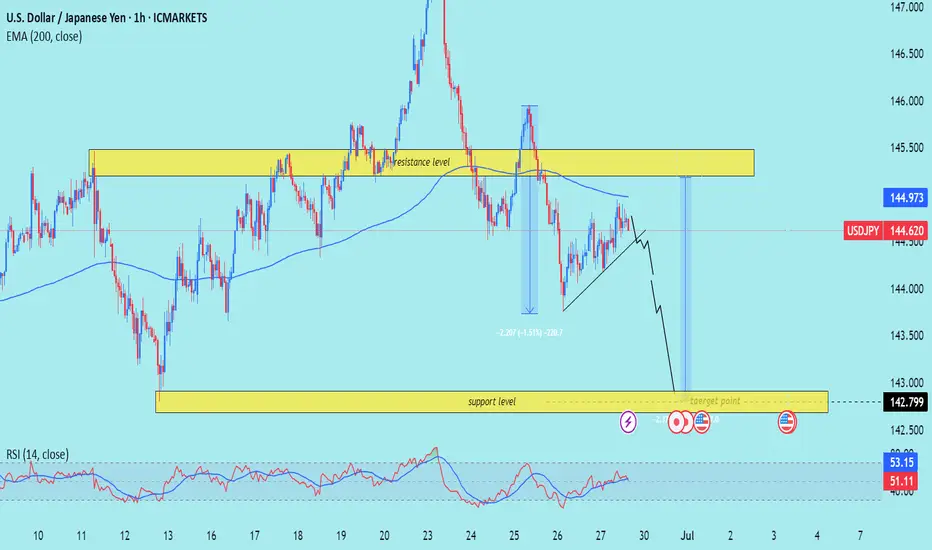
USD/JPY) bearish Trand analysis Read The captionSMC trading point update
Technical analysis of USD/JPY (U.S. Dollar vs Japanese Yen) on the 1-hour timeframe. Here's a clear breakdown of the idea presented:
---
Overview of the Setup
Current Price: 144.620
EMA 200 (Blue Line): 144.973 – price is trading below the EMA, indicating bearish
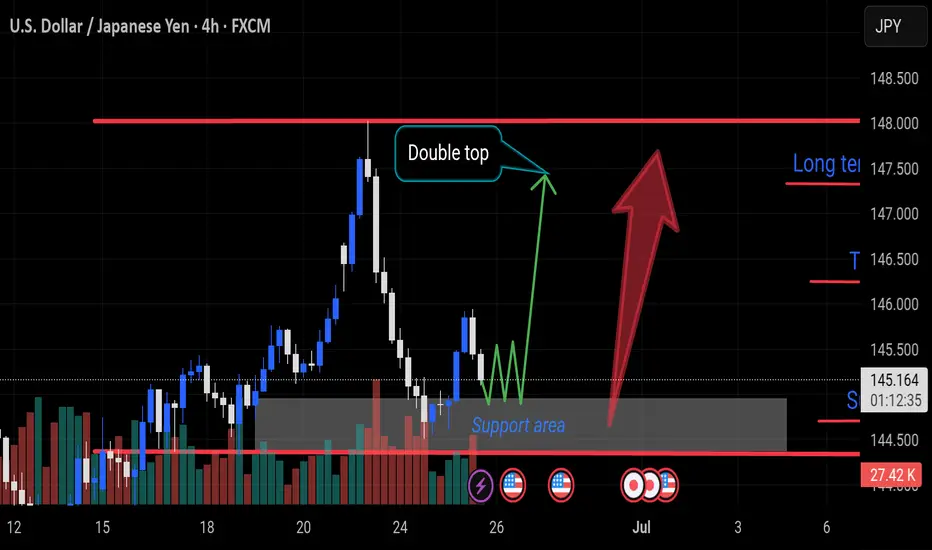
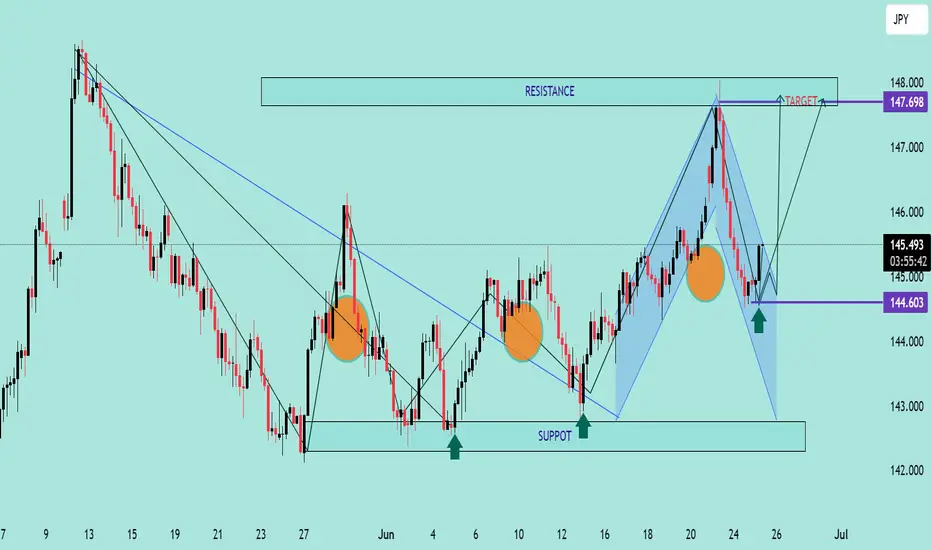
USD/JPY Bullish Reversal AnalysisUSD/JPY Bullish Reversal Analysis 📈💹
🔍 Technical Overview:
The chart illustrates a strong bullish reversal pattern forming on USD/JPY after price reacted from a key support zone at 144.600. This level has held firm multiple times, marked by green arrows, signaling strong buying interest.
📐 Chart P
USDJPY Potential UpsidesHey Traders, in tomorrow's trading we are monitoring USDJPY for a buying opportunity around 144.400 zone, USDJPY is trading in an uptrend and currently is in a correction phase in which it is approaching the trend at 144.400 support and resistance area.
Trade safe, Joe.

See all ideas
Displays a symbol's price movements over previous years to identify recurring trends.
Frequently Asked Questions
The value of the USDJPY pair is quoted as 1 USD per x JPY. For example, if the pair is trading at 1.50, it means it takes 1.5 JPY to buy 1 USD.
USDJPY is a major currency pair, i.e. a popular currency paired with USD.
Currencies are usually traded through forex brokers — choose the one that suits your needs and go ahead. You can trade USDJPY right from TradingView charts — just log in to you broker account. Check out the list of our integrated brokers and find the best one for your needs and strategy.