U.S. DOLLAR / WTI CRUDE OIL forum
📉 Key Reasons for the SPR and Oil Price Decline
1. Crude Inventory Drop
- U.S. crude stockpiles fell by 3.9 million barrels, far exceeding analyst expectations of a 552,000-barrel draw.
- This signals stronger export activity but also raises concerns about domestic supply tightness.
2. Surge in Exports
- Crude exports jumped by 760,000 barrels/day, reaching 3.5 million bpd, which contributed to the inventory draw.
- While this supports global supply, it reduces domestic reserves like the SPR.
3. Weak Fuel Demand
- Gasoline and distillate inventories rose sharply:
- Gasoline: +3.4 million barrels
- Distillates (diesel/heating oil): +4.2 million barrels
- This reflects sluggish demand, with gasoline consumption dropping by 670,000 bpd.
4. Geopolitical Easing
- The White House softened its stance on a 50-day deadline for Russia, reducing fears of immediate supply disruptions.
- Traders responded by taking profits, pushing WTI crude below $66.00.
5. Market Sentiment
- The EIA report was seen as “disappointing on the demand side,” which weighed on sentiment.
- Brent and WTI futures both extended losses, with WTI falling to $65.81 per barrel.
I don't think CUSHING has the oil for delivery.
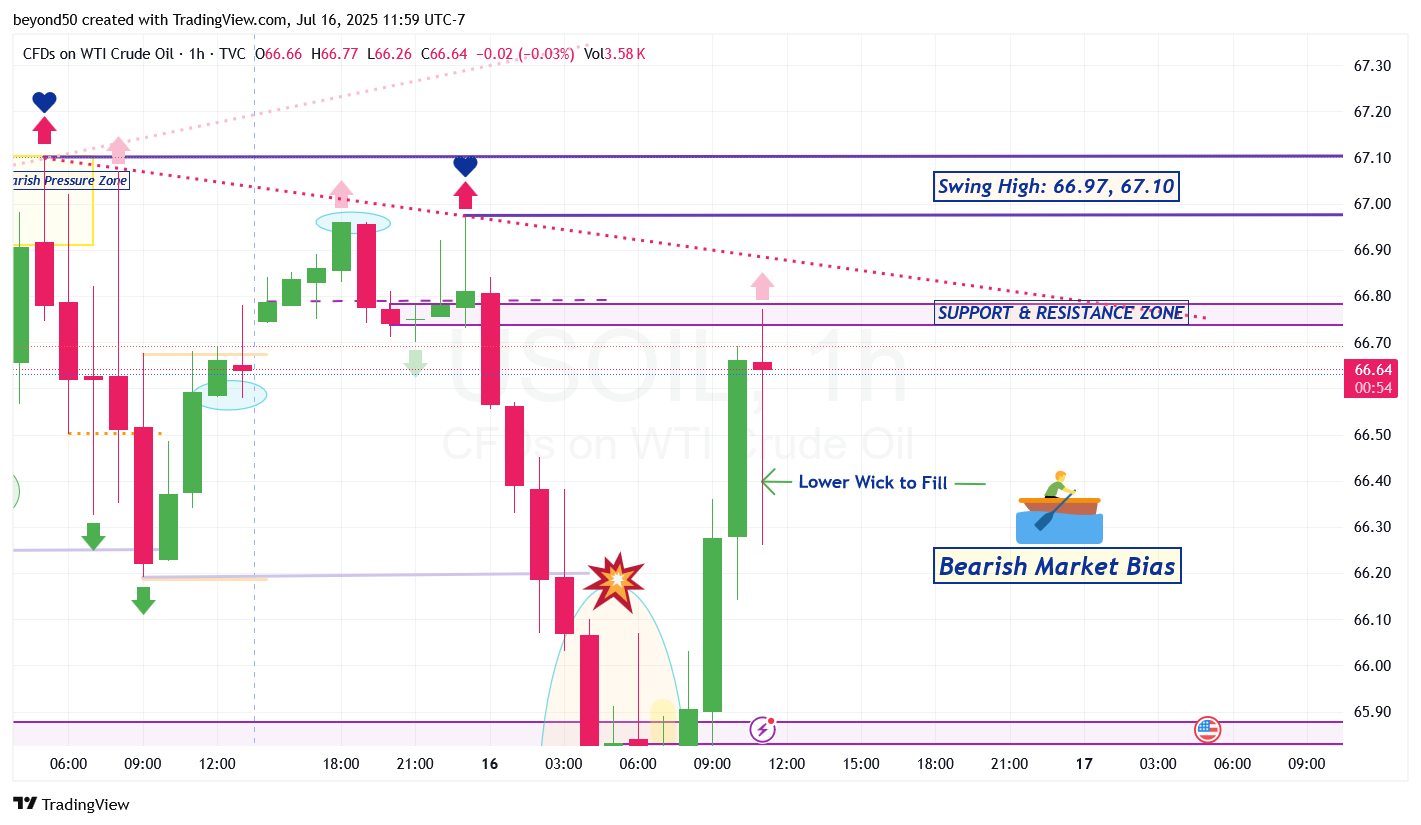
With a change in market bias to bullish from the trendline break, the bulls can rise more to potentially breach the Swing Highs of 66.97 and 67.10, then back down for a retest of the Bearish Trendline.
Afterwards, it can rise again.