USDZAR. The USDZAR is ready to rally but the daily equal lows are suspect. It would be great to see them swept before it rallies, but that will depend on how they use the news.
About U.S. Dollar / South African Rand
The U.S. Dollar vs. the South African Rand. The Rand was and became legal tender in the late 50’s to early 60’s for South Africa, Swaziland, Lesotho and Namibia after moving away from the Pound. After the apartheid era sanctions the Rand experienced a great deal of volatility and depreciation.
Related currencies

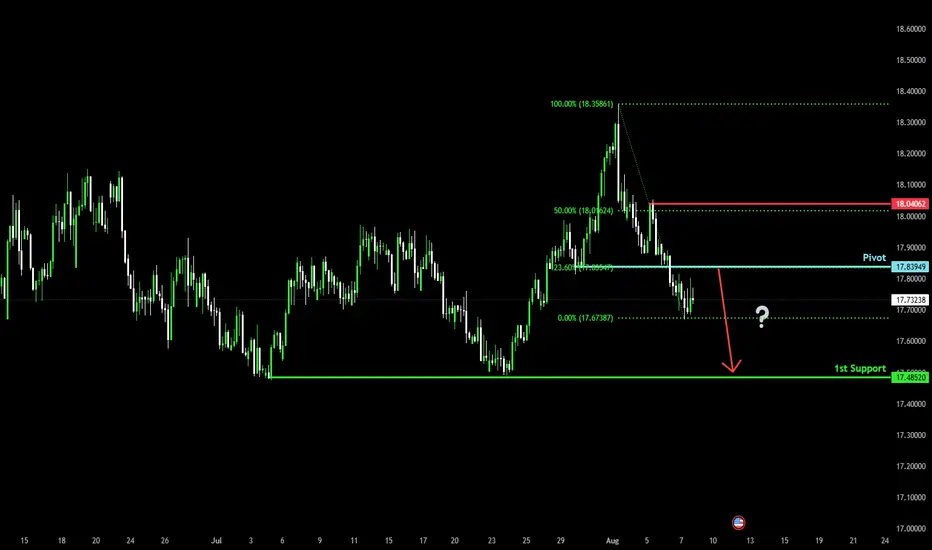
Bearish drop?USD/ZAR has reacted off the pivot and could drop to the 1st support which acts as a multi-swing low support.
Pivot: 17.8949
1st Support: 17.4852
1st Resistance: 18.0406
Risk Warning:
Trading Forex and CFDs carries a high level of risk to your capital and you should only trade with money you can
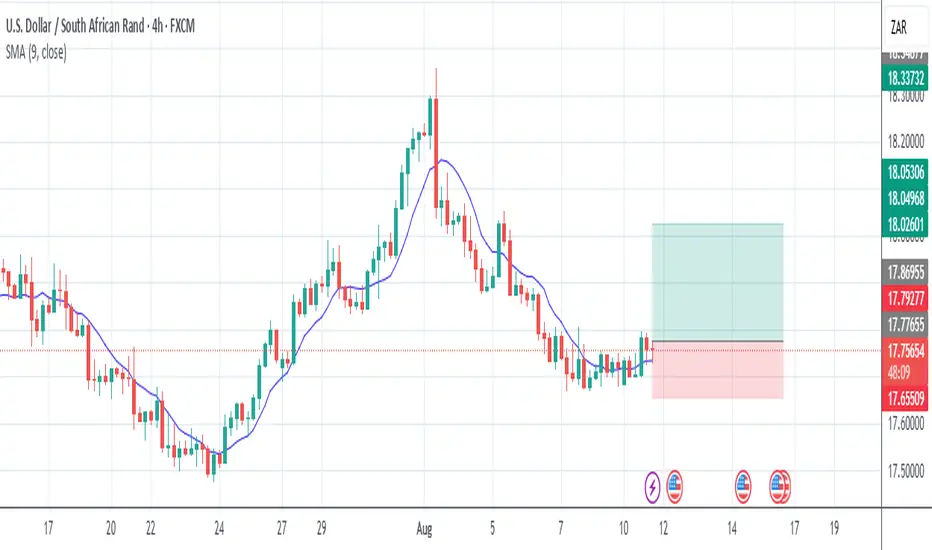
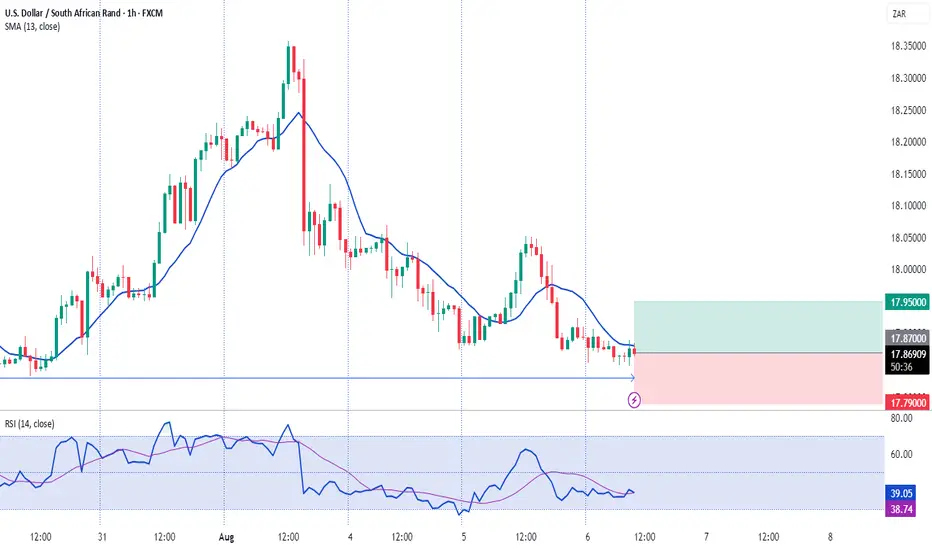
usdzar buy tradeThe Relative Strength Index (RSI) is showing an upward trend, indicating increasing momentum. Additionally, the Moving Average Convergence Divergence (MACD) is showing a bullish crossover, further supporting the potential for an upward move
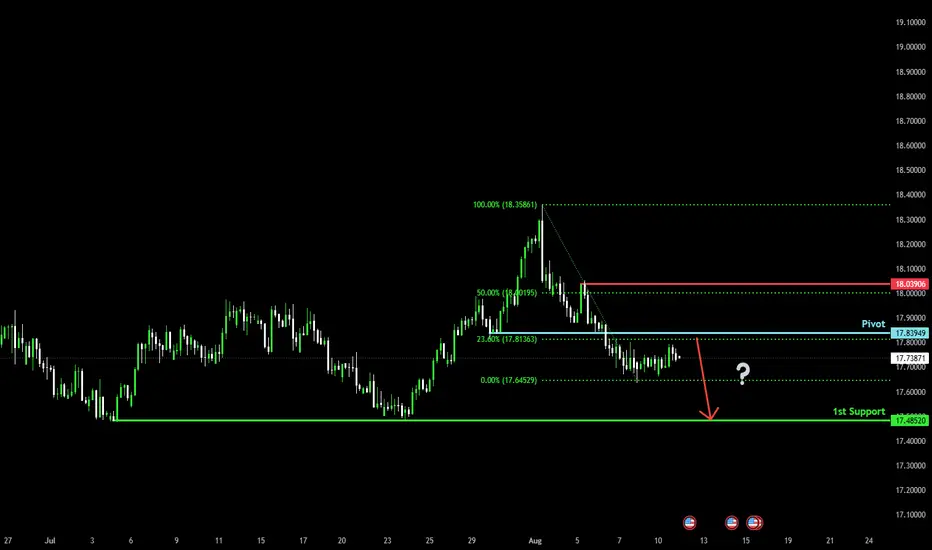
Bearish reversal?USD/ZAR is rising towards the pivot which is a pullback resistance and could reverse to the 1st support.
Pivot: 17.8394
1st Support: 17.4852
1st Resistance: 18.0390
Risk Warning:
Trading Forex and CFDs carries a high level of risk to your capital and you should only trade with money you can affo
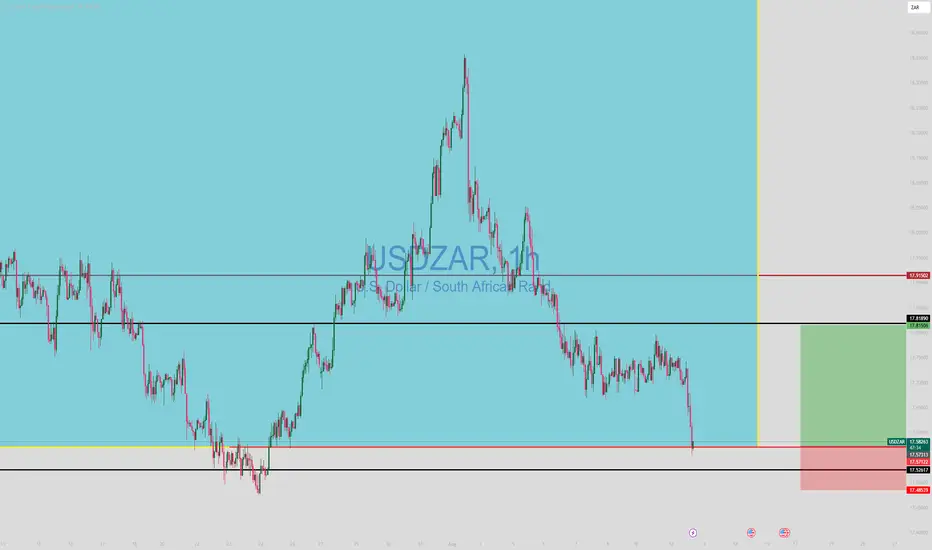
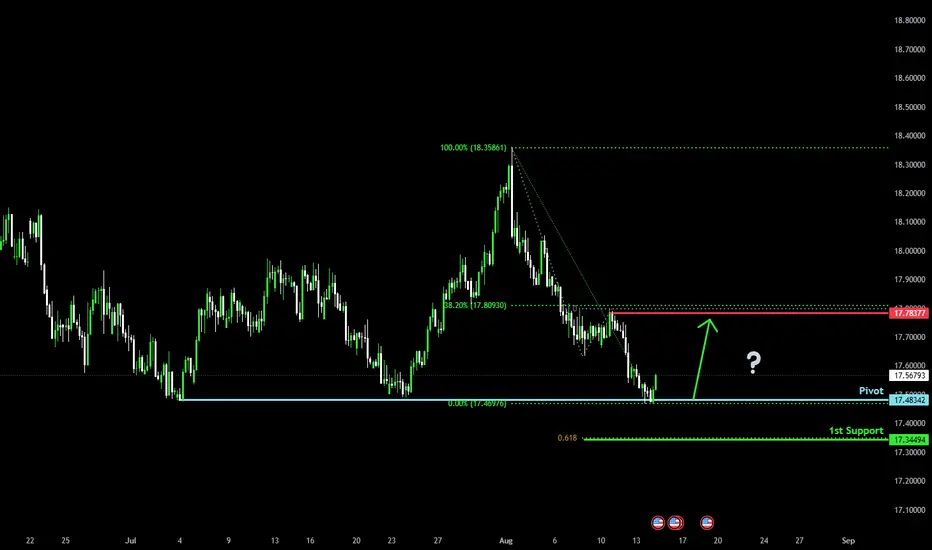
Bullish bounce off multi swing low support?USD/ZAR has bounced off the pivot, which is a multi-swing low support, and could rise to the 1st resistance.
Pivot: 17.4834
1st Support: 17.3449
1st Resistance: 17.7837
Risk Warning:
Trading Forex and CFDs carries a high level of risk to your capital and you should only trade with money you can
USDZAR-BUY strategy 6 hourly chart GANNThe pair has not been able to sustain the higher levels, and came down sharply. Now we are basing I feel and this may be a BUY opportunity this time around. Indicators are starting to look positive, and supports the likely hood for a move higher again.
Strategy BY @ 17.6875-17.7350 and take profit
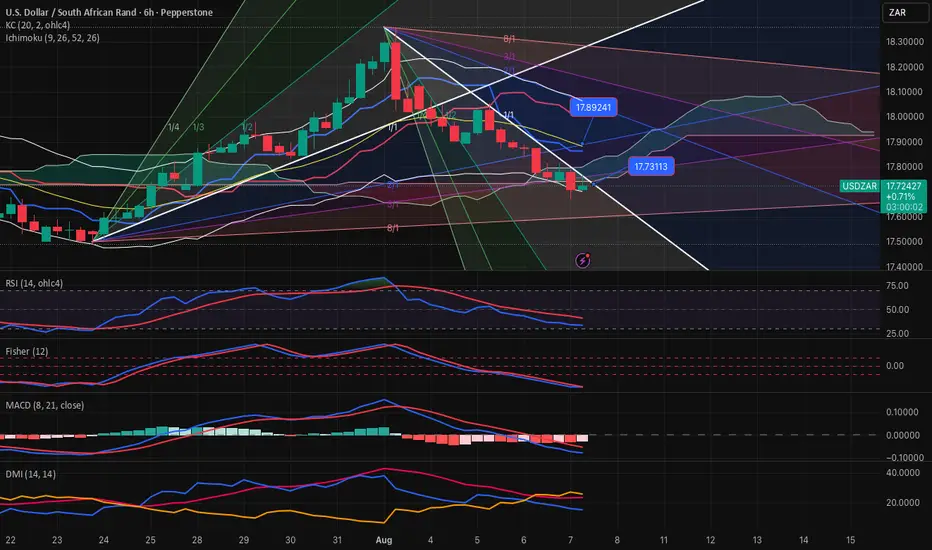
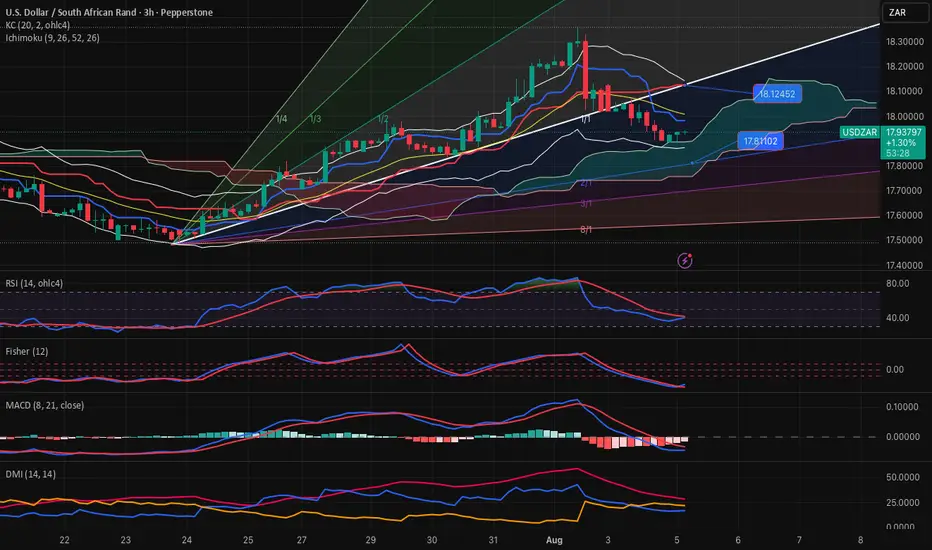
USDZAR-BUY strategy 3 hourly chart GANNThe pair has moved sharply lower on USDX movement, and NOT GOLD price. Right now we have kind of confirmed upward momentum, and this seems pointing us back towards 17.8875-17.9350 area. This is my personal viewpoint of course.
Strategy BUY @ 17.5100-17.5450 and take profit near 17.8650 for now.

USDZXAR-NEUTRAL BUY strategy 3 hourly chartThe pair has moved lower as expected, however the decline has not been severe, and besides, other currencies show slightly oversold status, and this provide a good basis for BUY entry instead now.
Strategy BUY @ 17.9000-17.9300 and take profit near 18.0875 for now.
See all ideas
Summarizing what the indicators are suggesting.
Oscillators
Neutral
SellBuy
Strong sellStrong buy
Strong sellSellNeutralBuyStrong buy
Oscillators
Neutral
SellBuy
Strong sellStrong buy
Strong sellSellNeutralBuyStrong buy
Summary
Neutral
SellBuy
Strong sellStrong buy
Strong sellSellNeutralBuyStrong buy
Summary
Neutral
SellBuy
Strong sellStrong buy
Strong sellSellNeutralBuyStrong buy
Summary
Neutral
SellBuy
Strong sellStrong buy
Strong sellSellNeutralBuyStrong buy
Moving Averages
Neutral
SellBuy
Strong sellStrong buy
Strong sellSellNeutralBuyStrong buy
Moving Averages
Neutral
SellBuy
Strong sellStrong buy
Strong sellSellNeutralBuyStrong buy
Displays a symbol's price movements over previous years to identify recurring trends.
Frequently Asked Questions
The current rate of USDZAR is 17.58142 ZAR — it has increased by 0.69% in the past 24 hours. See more of USDZAR rate dynamics on the detailed chart.
The value of the USDZAR pair is quoted as 1 USD per x ZAR. For example, if the pair is trading at 1.50, it means it takes 1.5 ZAR to buy 1 USD.
The term volatility describes the risk related to the changes in an asset's value. USDZAR has the volatility rating of 0.37%. Track all currencies' changes with our live Forex Heatmap and prepare for markets volatility.
The USDZAR showed a −0.70% fall over the past week, the month change is a −1.44% fall, and over the last year it has decreased by −2.53%. Track live rate changes on the USDZAR chart.
Learn how you can make money on rate changes in numerous trading ideas created by our community.
Learn how you can make money on rate changes in numerous trading ideas created by our community.
Currencies are usually traded through forex brokers — choose the one that suits your needs and go ahead. You can trade USDZAR right from TradingView charts — just log in to you broker account. Check out the list of our integrated brokers and find the best one for your needs and strategy.
When deciding to buy or sell currency one should keep in mind many factors including current geopolitical situation, interest rates, and other. But before plunging into a deep research, you can start with USDZAR technical analysis. The technical rating for the pair is sell today, but don't forget that markets can be very unstable, so don't stop here. According to our 1 week rating the USDZAR shows the sell signal, and 1 month rating is sell. See more of USDZAR technicals for a more comprehensive analysis.