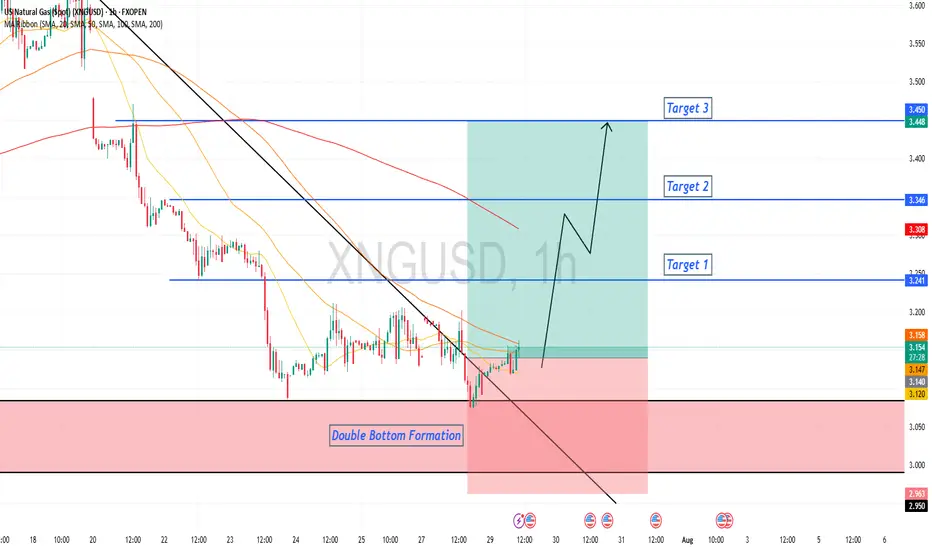
Natural Gas is in the Buying DirectionHello Traders
In This Chart NATGAS HOURLY Forex Forecast By FOREX PLANET
today NATGAS analysis 👆
🟢This Chart includes_ (NATGAS market update)
🟢What is The Next Opportunity on NATGAS Market
🟢how to Enter to the Valid Entry With Assurance Profit
This CHART is For Trader's that Want to Improve Their Te
Natural Gas Bullish Reversal...Are the Lows in?U.S. natural gas inventories increased by 48 billion cubic feet last week to 3,123 Bcf, increasing the surplus over the five-year average.
Consensus / forecast was 37Billion Cubic feet.
Despite a much higher build than expected Nat gas saw positive price action.
This appears to simply be a dead

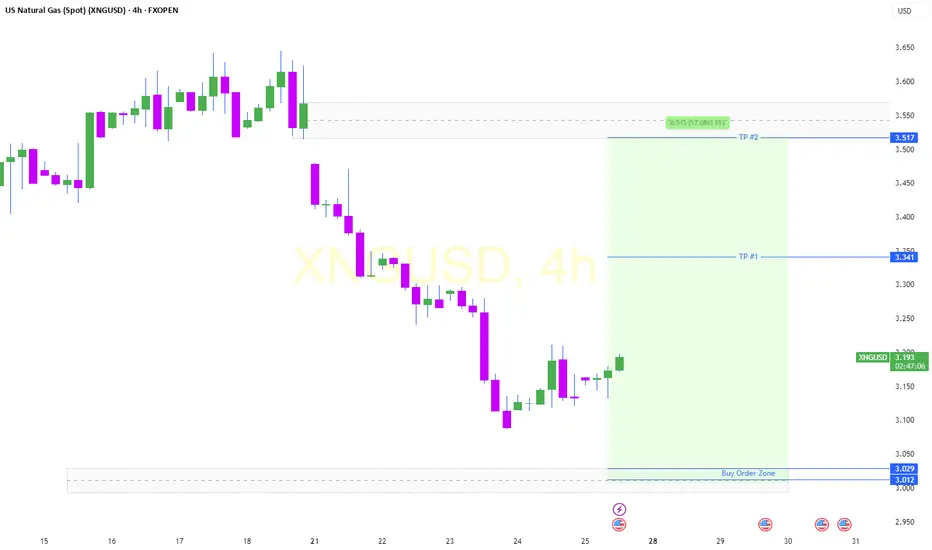
XNGUSD CONTINUES ITS DOWNWARD TREND. FOR HOW LONG?XNGUSD CONTINUES ITS DOWNWARD TREND. FOR HOW LONG?
Recent bearish impulse started at the beginning of this week may come to an end soon. Yesterday the U.S. Natural Gas Storage report came out. Numbers appeared to be lower than expected and lower than previous. (23b vs 28b vs 46b). This is bullish s
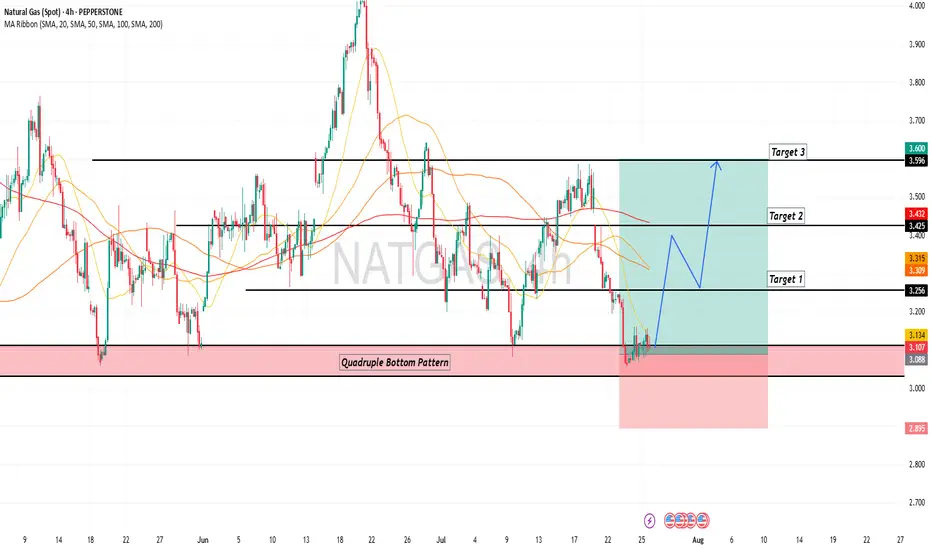
Natural Gas is in the Buying DirectionHello Traders
In This Chart NATGAS HOURLY Forex Forecast By FOREX PLANET
today NATGAS analysis 👆
🟢This Chart includes_ (NATGAS market update)
🟢What is The Next Opportunity on NATGAS Market
🟢how to Enter to the Valid Entry With Assurance Profit
This CHART is For Trader's that Want to Improve Their Te
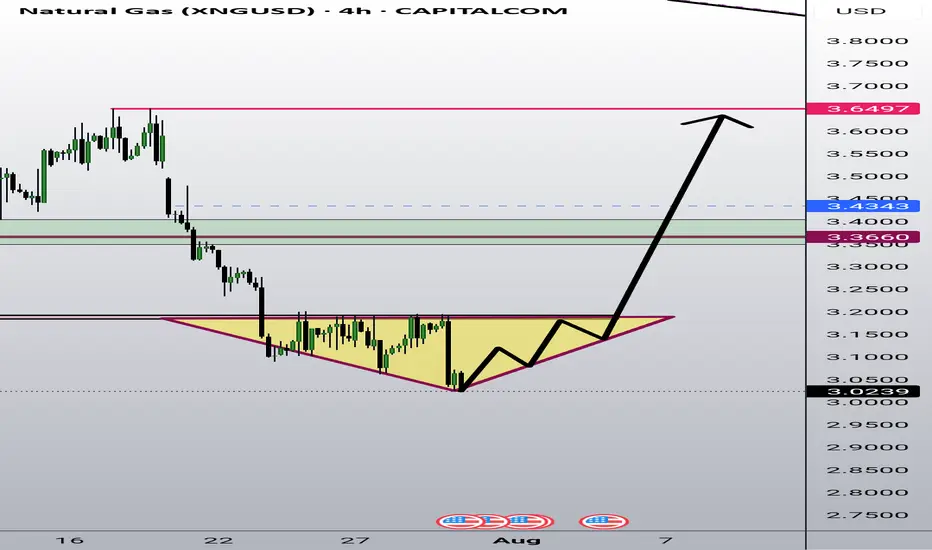
Bullish Diamond pattern (Reversal) is forming in Natural GasNatural Gas is show Classical bullish Diamond pattern character supported by oversold Rsi & triple bottom in weekly
Any good positive data will trigger sharp reversal in Natural Gas
Reversal will be brutual
Seller be cautious trail your stoploss
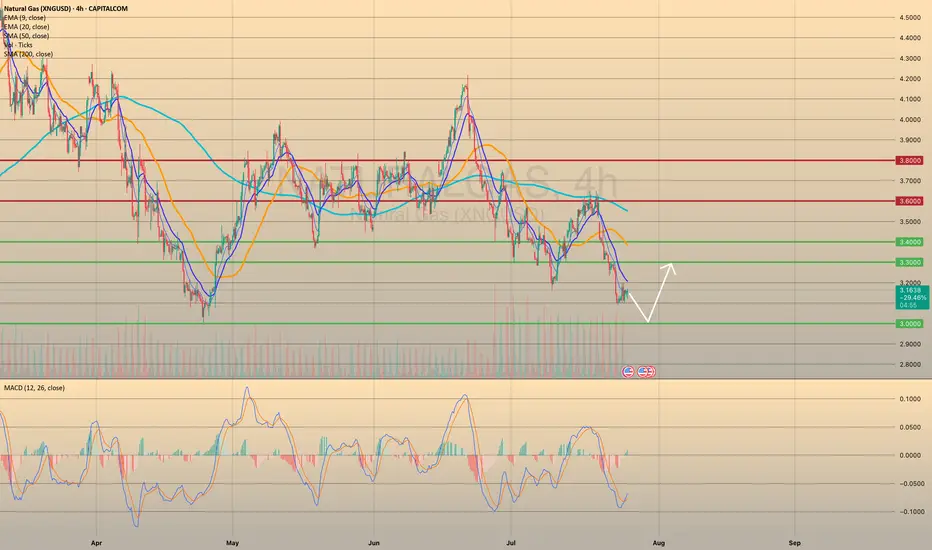
Natural Gas Rebounds from Key SupportNatural gas has bounced off its strong support level and is showing signs of upward movement, particularly evident on the hourly chart. Dips are being bought up, with the price quickly returning to previous levels.
Downsides: The downtrend is still in place (though it may potentially be broken),
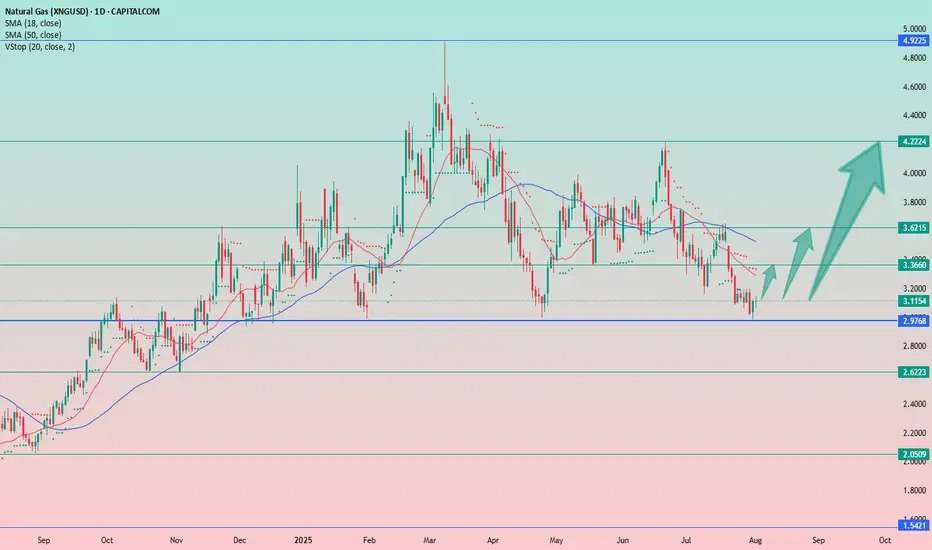
NATURAL GAS REACHED THE KEY SUPPORT LEVEL. WHERE TO GO NEXT?NATURAL GAS REACHED THE KEY SUPPORT LEVEL. WHERE TO GO NEXT?
XNGUSD has come to a crucial support level of 3.0000. Although the sentiment here stays as quite bearish (seasonally, August is not the perfect month for natgas buyers), we expect the price to rebound from the level of 3.0000 towards 3.30
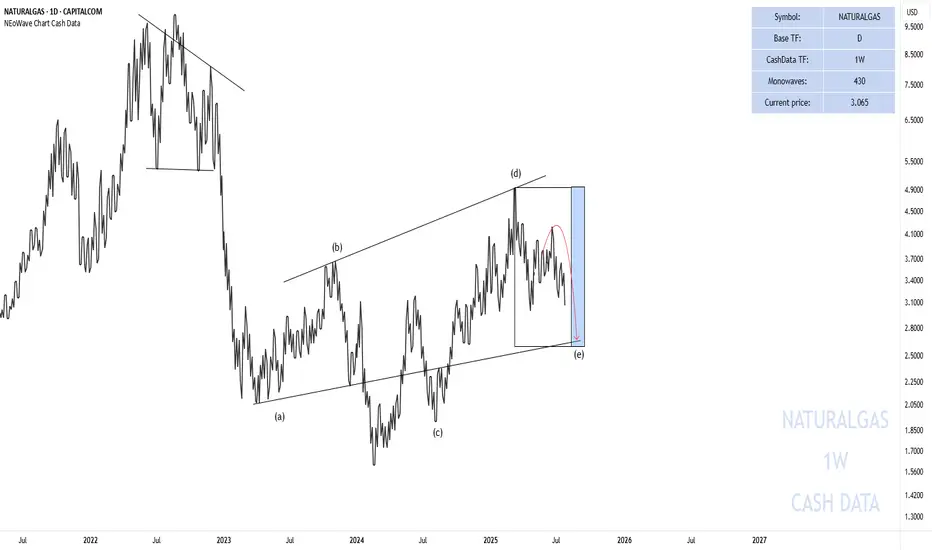
End of the Wave-(e) Natural Gas
In the previous analysis I said that:
Currently, wave-(e) is forming and I do not expect a strong upward movement until August 12-September 12 and this wave can take time until the time range I specified for it.
In the picture you can see that the price has started to decline again exactly from w
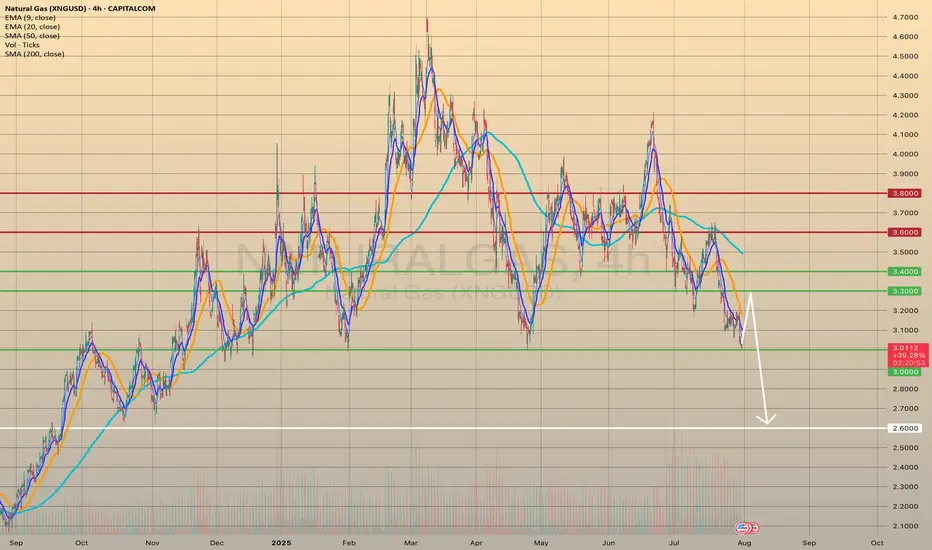
Sell NATGAS into OCT/NOVNatalie has fromed a H&S and has broke through all of the supporting EMAs leading to most of the indicators turning bearish.
My approach for the forseeable is seeling bounces until the winter season approaches.
Of course Natalie is extremely susceptible to trend changes due to economical data and

See all ideas
Displays a symbol's price movements over previous years to identify recurring trends.