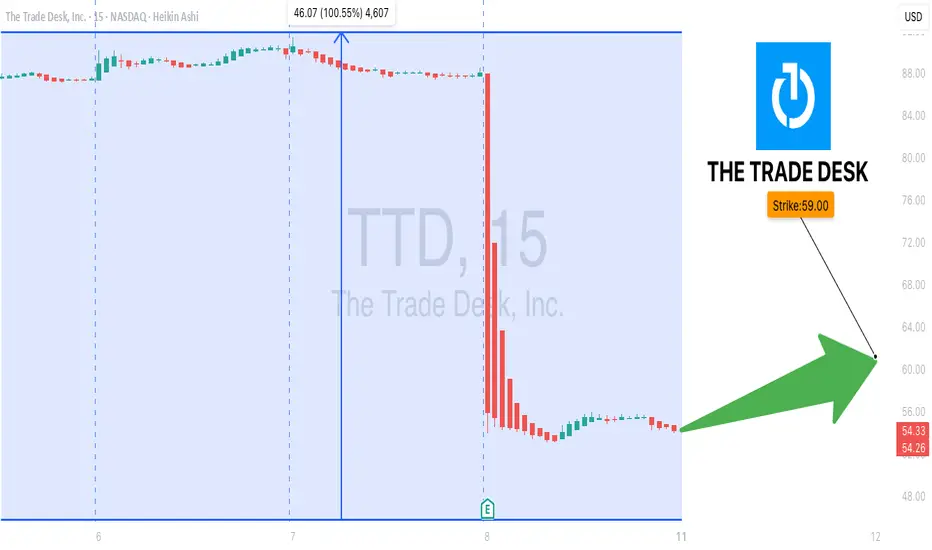
TTD Oversold Bounce Play — Call Option for Next Week🔥 TTD Oversold Bounce Play — Call Option for Next Week**
The Trade Desk (TTD) is deep in oversold territory (RSI daily 19.6, weekly 33.4) with 3.7x volume surge last week — signaling heavy institutional activity. While the macro bias leans bearish, a speculative bullish flow (call/put ratio 1.42) h
Key facts today
Next report date
—
Report period
—
EPS estimate
—
Revenue estimate
—
0.720 EUR
379.70 M EUR
2.36 B EUR
443.18 M
About The Trade Desk, Inc.
Sector
Industry
CEO
Jeffrey Terry Green
Website
Headquarters
Ventura
Founded
2009
FIGI
BBG00P0PBWW0
The Trade Desk, Inc. engages in the provision of a self-service and cloud-based ad-buying platform. It operates through the United States and International geographical segments. The firm offers omnichannel advertising, audience targeting, solutions for identity, application programming interface (API), custom, and programmatic, measurement and optimization. The company was founded by Jeffrey Terry Green and David Pickles in November 2009 and is headquartered in Ventura, CA.
Related stocks
$TTD is ready to move into triple digits - Lock n load Pretty straight forward in the face setup.
Here are pros-
+Got added to s&p500
+massive volume shelf from multi year above 80 which we are above
+beautiful gap from q1 2025 to ride from $85 to $120
++Relative strength strong vs spy for 55 period(thats what I use)
+++ $100 Psych level is a MAGNET -
TTD crashIn the long term, this stock is in a side cycle and after seeing the top, it starts moving towards the bottom and goes through the natural market cycle, but very fast and intense.
The first support area for this stock is $48-50 and if it encounters strong buyers, it will move towards $69 and after
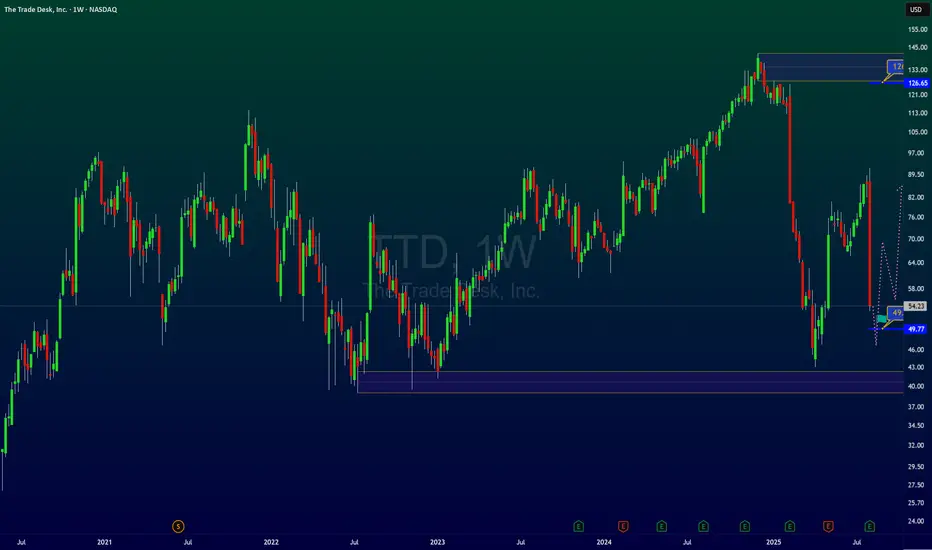
TTD is giving a second chance A few days ago, we mentioned that NASDAQ:TTD could have reached a great buying level around the $44 area. After a recent rally, we’re now seeing a typical bullish continuation pattern. If the flag breaks to the upside, you’ll have a new opportunity to join the upward move.
Once again, a tight sto
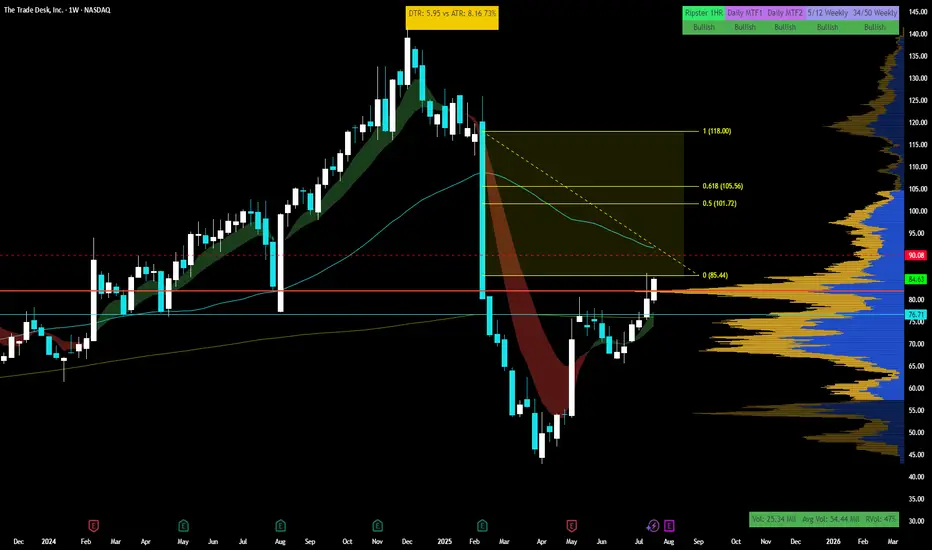
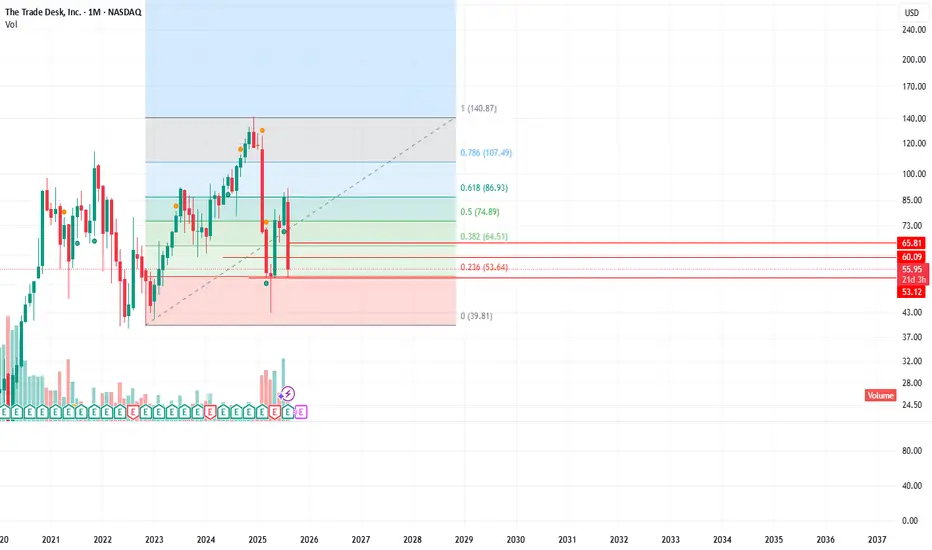
breakdown of TTD monthly chartPotential Target Levels
If bullish momentum continues:
First target: $60.09 (minor resistance before 0.382 Fib)
Second target: $64.51 (Fib 0.382 + close to SMA 20)
Third target: $74.89 (Fib 0.5, major resistance zone)
Extended target: $86.93 (Fib 0.618)
If bearish reversal occurs:
Support 1: $
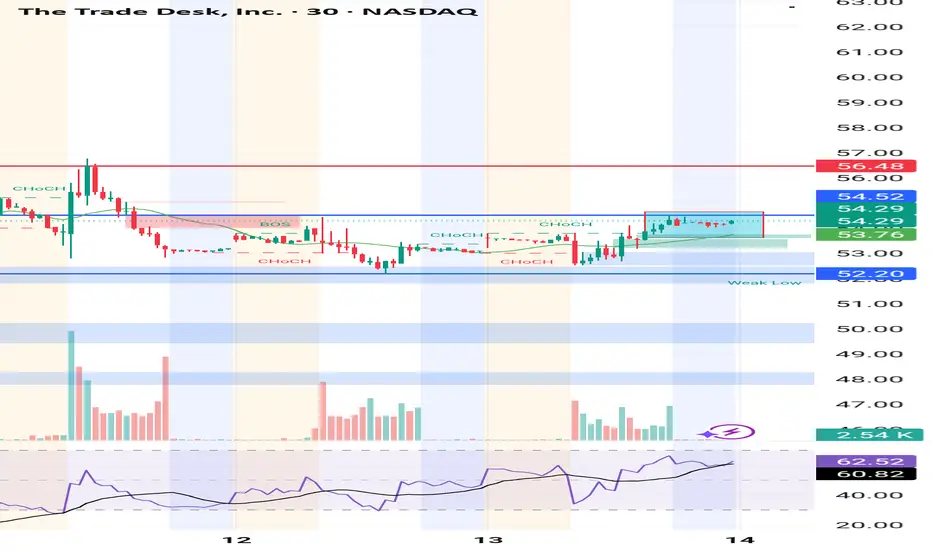
Breakout in process?Have been ranging, slight pullback and curl up at close.
If we break im looking for a test of the red line.
If that happens stop loss set.
Would like to close with profit and enter again at a retest of range top.
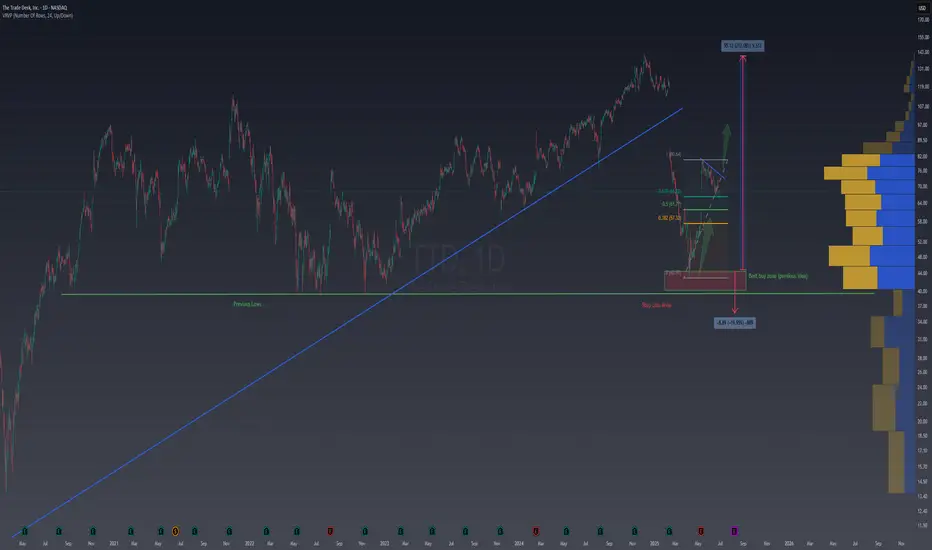
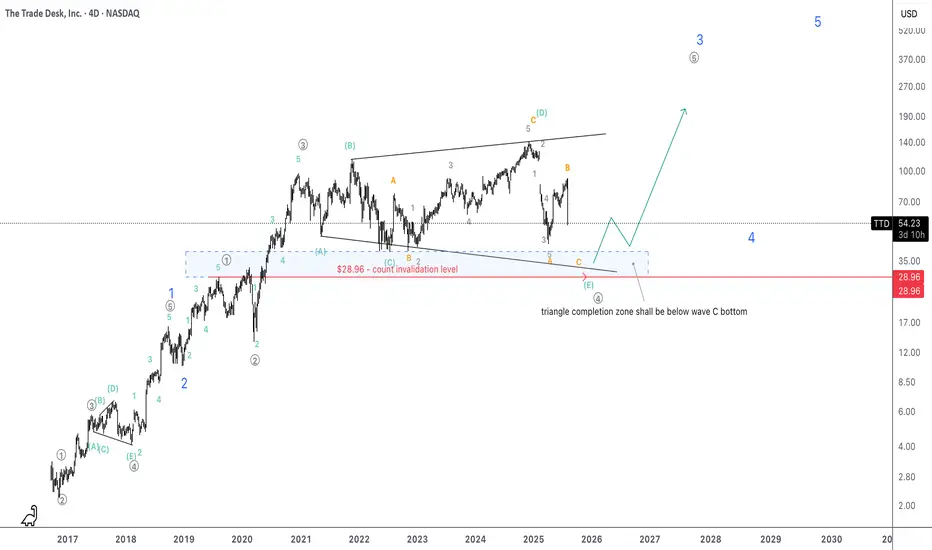
TTD poised to take off as expanding triangle completesIt is magnificent how the current triangle proves EW fractal aspect since there was an expanding triangle at the same wave degree within blue wave 1.
I'd put SL at around $29 where grey 4 (with the current triangles wave E) would overlap grey wave 1.
Magnitude of the unfolding grey wave 5 might be
TTD Dropping HaRd / NoT DonE!Because the universe said so... We must be patient, unless executing B Wave for profit.
Note:
40% in oNe DaY!

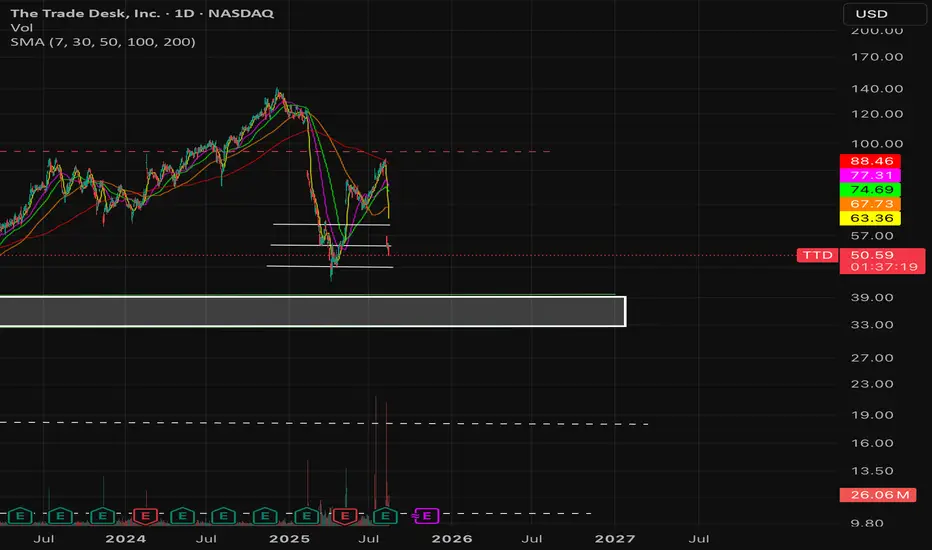
I'm ready to size up TTDIf you've been following me you know i've got TTD at a good price. I'm ready to size up position if we get a sell off in the next few weeks. The 9 take profit is coming up, sell could come sooner, but i'm looking for a test of previous levels (green horizontals) before the next leg up. I also contin

Multiple Compression of $TTD- NASDAQ:TTD is no longer the high flying market darling
- Growth has been coming down from high 30s to 20s and now to high teens. This calls for lowering multiple
Fundamentally,
Year | 2025 | 2026 | 2027 | 2028
EPS | 0.82 | 1.09 | 1.41 | 1.89
eps% | -49.61% | 32.28% | 29.08% | 34.47%
- Thi
See all ideas
Summarizing what the indicators are suggesting.
Neutral
SellBuy
Strong sellStrong buy
Strong sellSellNeutralBuyStrong buy
Neutral
SellBuy
Strong sellStrong buy
Strong sellSellNeutralBuyStrong buy
Neutral
SellBuy
Strong sellStrong buy
Strong sellSellNeutralBuyStrong buy
An aggregate view of professional's ratings.
Neutral
SellBuy
Strong sellStrong buy
Strong sellSellNeutralBuyStrong buy
Neutral
SellBuy
Strong sellStrong buy
Strong sellSellNeutralBuyStrong buy
Neutral
SellBuy
Strong sellStrong buy
Strong sellSellNeutralBuyStrong buy
Displays a symbol's price movements over previous years to identify recurring trends.
Curated watchlists where TTD is featured.

Software stocks: US companies at our finger tips
49 No. of Symbols
See all sparks
Frequently Asked Questions
The current price of TTD is 43.245 EUR — it has decreased by −4.37% in the past 24 hours. Watch TRADE DESK INC/THE -CLASS A stock price performance more closely on the chart.
Depending on the exchange, the stock ticker may vary. For instance, on VIE exchange TRADE DESK INC/THE -CLASS A stocks are traded under the ticker TTD.
TTD stock has fallen by −43.61% compared to the previous week, the month change is a −41.45% fall, over the last year TRADE DESK INC/THE -CLASS A has showed a −51.97% decrease.
We've gathered analysts' opinions on TRADE DESK INC/THE -CLASS A future price: according to them, TTD price has a max estimate of 115.89 EUR and a min estimate of 38.63 EUR. Watch TTD chart and read a more detailed TRADE DESK INC/THE -CLASS A stock forecast: see what analysts think of TRADE DESK INC/THE -CLASS A and suggest that you do with its stocks.
TTD stock is 1.62% volatile and has beta coefficient of 1.18. Track TRADE DESK INC/THE -CLASS A stock price on the chart and check out the list of the most volatile stocks — is TRADE DESK INC/THE -CLASS A there?
Today TRADE DESK INC/THE -CLASS A has the market capitalization of 21.31 B, it has increased by 1.90% over the last week.
Yes, you can track TRADE DESK INC/THE -CLASS A financials in yearly and quarterly reports right on TradingView.
TRADE DESK INC/THE -CLASS A is going to release the next earnings report on Nov 6, 2025. Keep track of upcoming events with our Earnings Calendar.
TTD earnings for the last quarter are 0.15 EUR per share, whereas the estimation was 0.15 EUR resulting in a 1.34% surprise. The estimated earnings for the next quarter are 0.17 EUR per share. See more details about TRADE DESK INC/THE -CLASS A earnings.
TRADE DESK INC/THE -CLASS A revenue for the last quarter amounts to 589.17 M EUR, despite the estimated figure of 581.90 M EUR. In the next quarter, revenue is expected to reach 616.80 M EUR.
TTD net income for the last quarter is 76.51 M EUR, while the quarter before that showed 46.84 M EUR of net income which accounts for 63.33% change. Track more TRADE DESK INC/THE -CLASS A financial stats to get the full picture.
No, TTD doesn't pay any dividends to its shareholders. But don't worry, we've prepared a list of high-dividend stocks for you.
As of Aug 15, 2025, the company has 3.52 K employees. See our rating of the largest employees — is TRADE DESK INC/THE -CLASS A on this list?
EBITDA measures a company's operating performance, its growth signifies an improvement in the efficiency of a company. TRADE DESK INC/THE -CLASS A EBITDA is 484.36 M EUR, and current EBITDA margin is 21.05%. See more stats in TRADE DESK INC/THE -CLASS A financial statements.
Like other stocks, TTD shares are traded on stock exchanges, e.g. Nasdaq, Nyse, Euronext, and the easiest way to buy them is through an online stock broker. To do this, you need to open an account and follow a broker's procedures, then start trading. You can trade TRADE DESK INC/THE -CLASS A stock right from TradingView charts — choose your broker and connect to your account.
Investing in stocks requires a comprehensive research: you should carefully study all the available data, e.g. company's financials, related news, and its technical analysis. So TRADE DESK INC/THE -CLASS A technincal analysis shows the sell today, and its 1 week rating is strong sell. Since market conditions are prone to changes, it's worth looking a bit further into the future — according to the 1 month rating TRADE DESK INC/THE -CLASS A stock shows the strong sell signal. See more of TRADE DESK INC/THE -CLASS A technicals for a more comprehensive analysis.
If you're still not sure, try looking for inspiration in our curated watchlists.
If you're still not sure, try looking for inspiration in our curated watchlists.