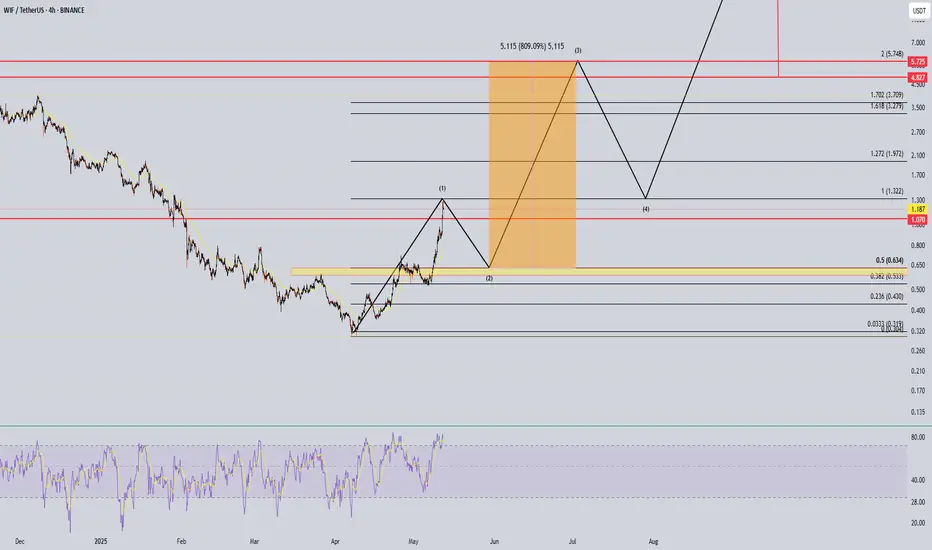
WIF buy order for that 800%5 waves up for the wave 1. Im only going for that wave 3. Looks like a nice 800% move.
WIFUSDT.P trade ideas
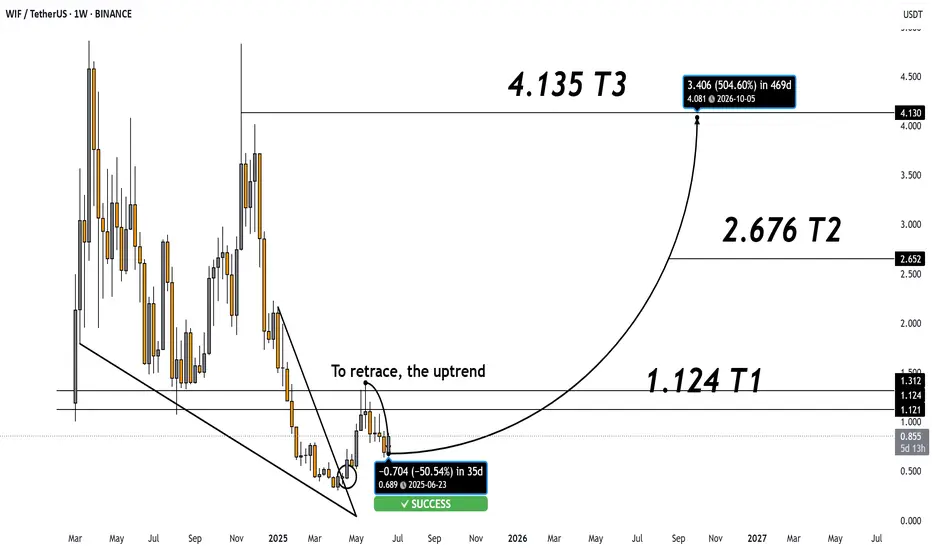
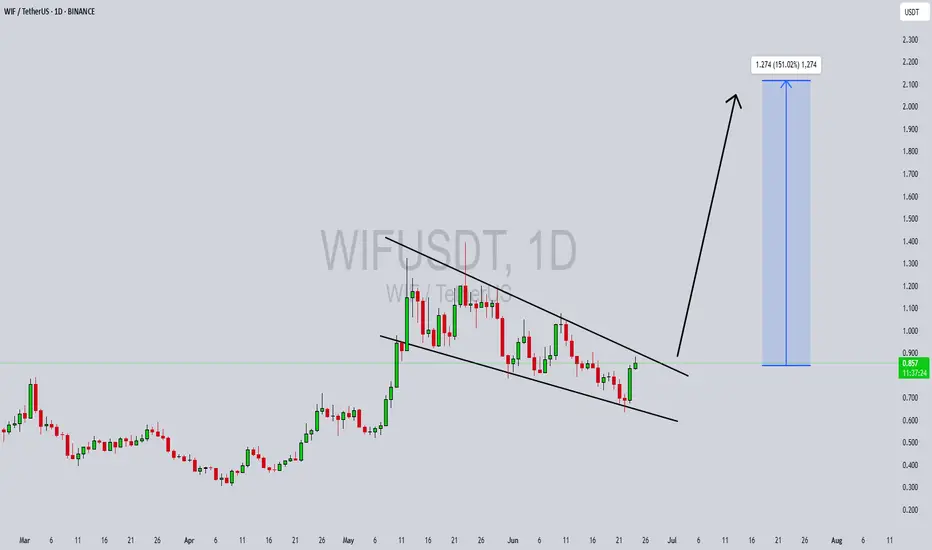
Market’s been slow, but #WIF is setting up beautifully.
Just bounced from the bottom of a falling wedge —
I still believe it’s heading to $4+ in this cycle.
📈 T1: $1.124
📈 T2: $2.676
🎯 T3: $4.135
Loading phase won’t last forever.
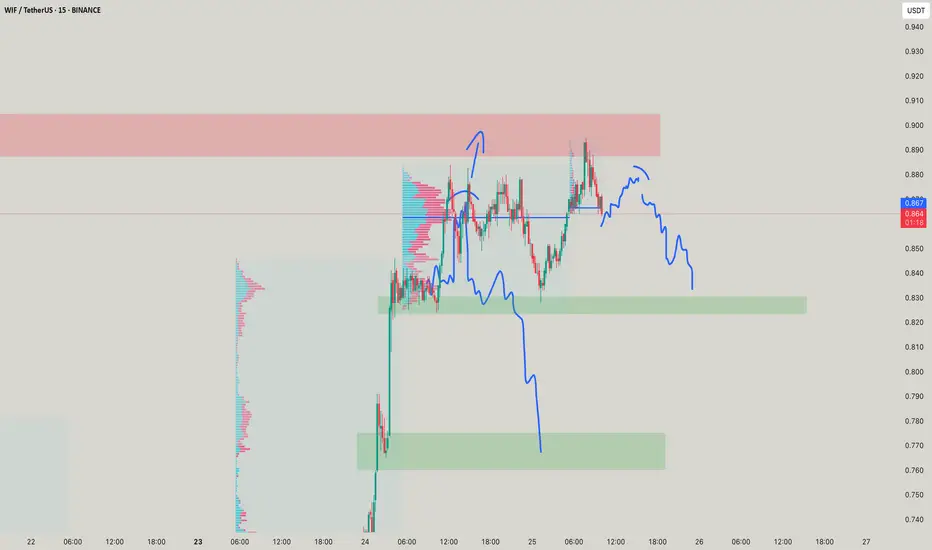
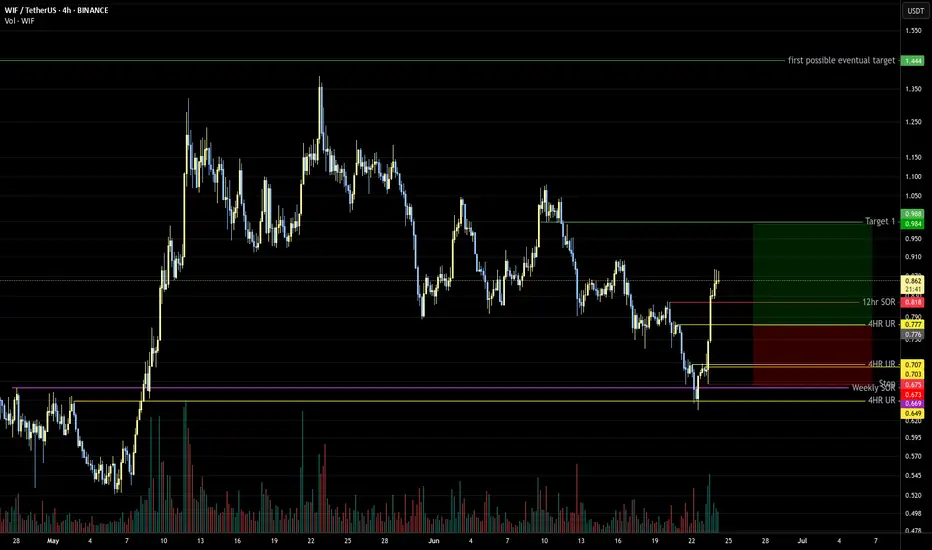
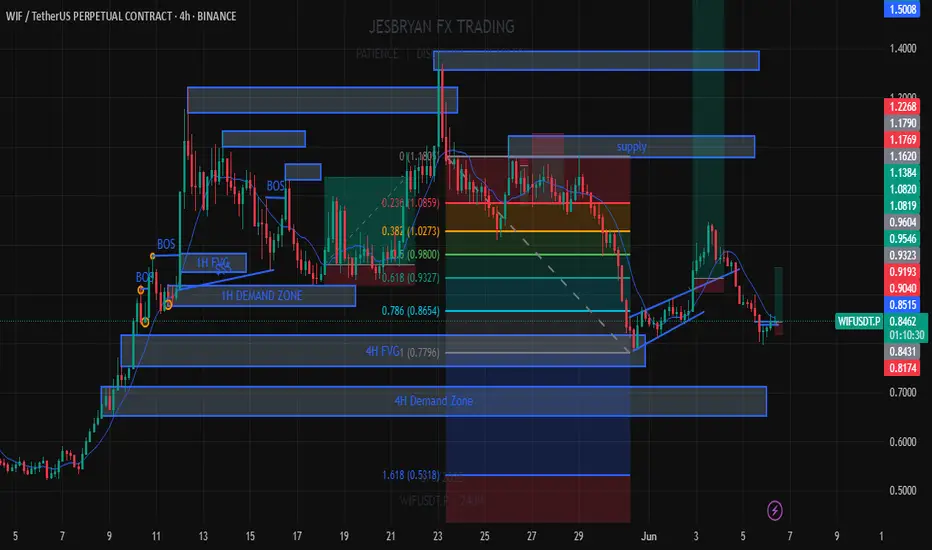
WIF 4H. Make or Break ZoneBINANCE:WIFUSDT The asset is still moving within a defined range and is now brushing against the lower boundary of its structure. This area has historically triggered buyer interest — and if that repeats, we could be looking at a recovery toward $0.97+ in the short term.
However, failure to defend this support could send price cascading down to the $0.58–$0.60 zone.
Given the ongoing uncertainty in global markets, especially due to rising geopolitical tension, any long positions should be executed with tight risk management and a hard stop-loss.
Entry range (EP):
• Market
• $0.8120
• $0.7790
Take-Profit targets (TP):
• $0.8880
• $0.9425
• $0.9765
I’m managing risk carefully and limiting exposure per trade to no more than 2% of my portfolio. This is my personal trading log and not financial advice — always DYOR and trade responsibly.
Let the market decide — I'm prepared either way.
Stay sharp. Stay safe. 🧠📊
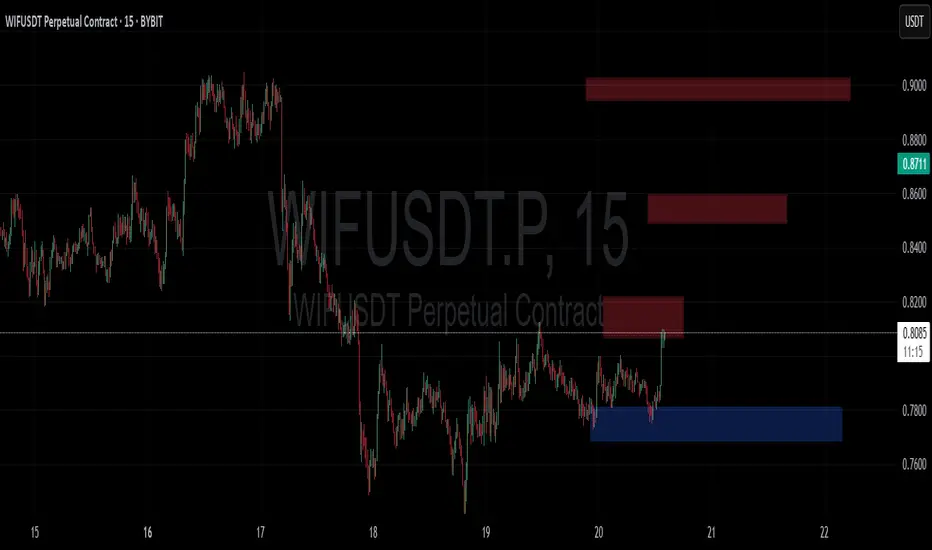
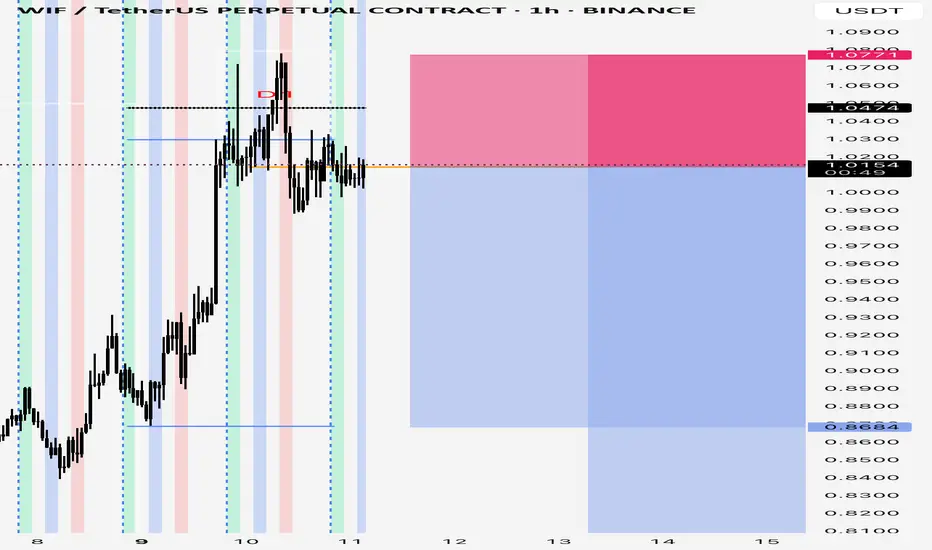
WIF can it break the red zone ?
Mastering Zones: Your Quick Trading Guide!
Remember the core logic:
🔵 Blue Zone:
PUMPS FROM BLUE (Look for buys!)
DUMPS IF BREAKS BLUE (Consider sells/exit longs!)
🔴 Red Zone:
DUMPS FROM RED (Look for sells!)
PUMPS IF BREAKS RED (Consider buys/enter longs!)
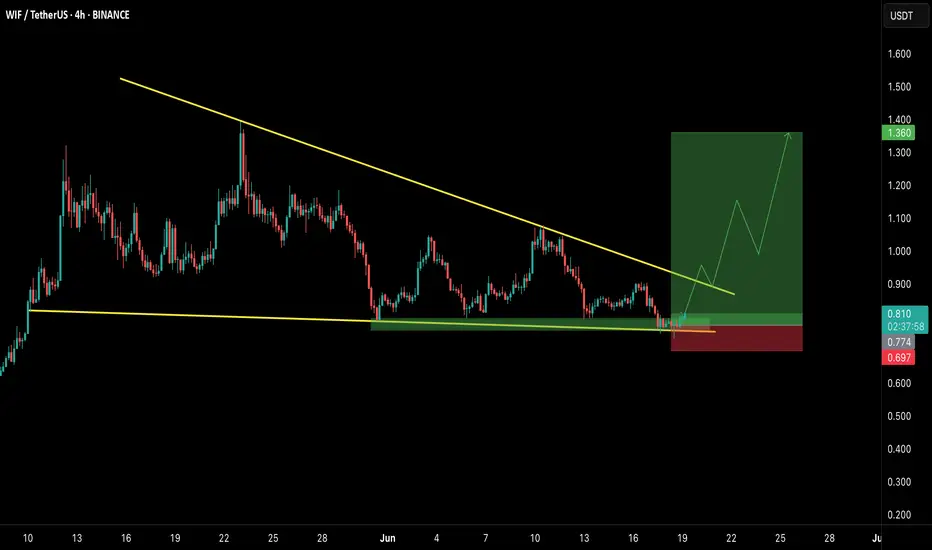
WIFUSDT Long Setup – Falling Wedge Breakout Incoming?Hey Traders — if you're into high-conviction setups with real momentum, this one’s for you.
WIF has been consolidating inside a falling wedge structure and is now showing signs of strength from the major horizontal support zone around $0.77. The structure is tightening, and the recent bounce from support could be the early signal of a breakout.
Here’s the trade idea:
Entry Zone: $0.77 – $0.81
Breakout Confirmation: 4H close above the wedge trendline (~$0.87)
Targets:
Target 1: $0.95
Target 2: $1.10
Target 3: $1.35
Invalidation / SL: Below $0.74
Risk-Reward: High (3R+ depending on entry)
Strategy:
Wait for a confirmed breakout with volume. Early entries around current support with tight SLs offer favorable setups if you’re comfortable with added risk.
Keep an eye on Bitcoin’s volatility and global macros, as they may influence alt momentum.
WIF to the destiny!SO i didnt posted here but on my channel - not advertisng admin!!!
SO This is what you can observe or play to the lower ob marked in green!
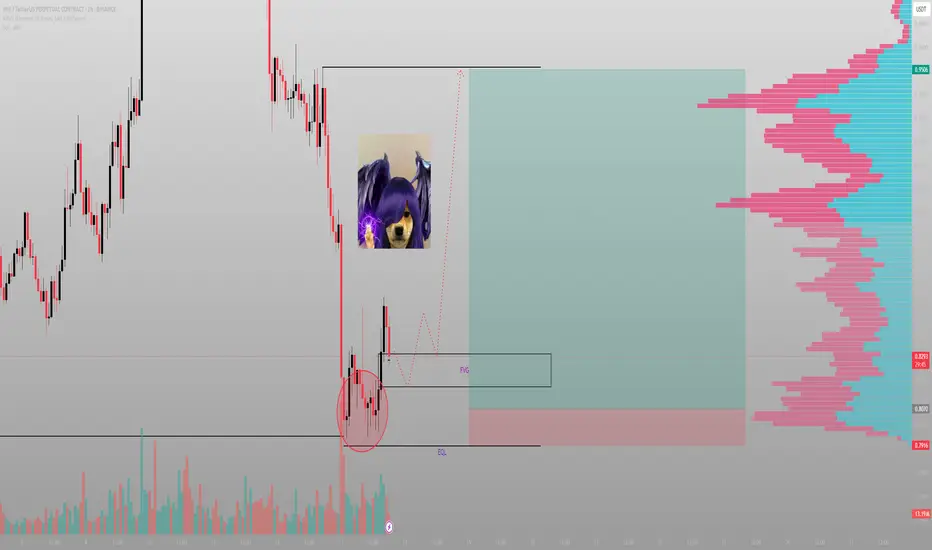
You saw a meme. I saw imbalanceWIF doesn’t need to be serious — because I am. This move isn’t about hype. It’s about inefficiency, reclaimed structure, and a clear delivery path.
The logic:
Price swept the lows and gave a clean reaction off the OB. From there, it filled the local FVG but didn’t expand — it paused. That tells me it’s not finished building. The first push wasn’t the move. It was the positioning.
The real draw is layered above:
TP1: 0.9591 — inefficiency midpoint
TP2: 1.0469 — external liquidity and high-volume cluster
The FVG-OB combo below (0.8736–0.8565) is the reload zone. That’s where Smart Money buys. Not above. Not late.
Execution:
Entry: 0.857–0.875 zone
SL: Below 0.825
TP1: 0.959
TP2: 1.046
Let retail react to candles. I’m reacting to context.
Final thought:
“You can laugh at the ticker. Just don’t laugh at the R/R.”

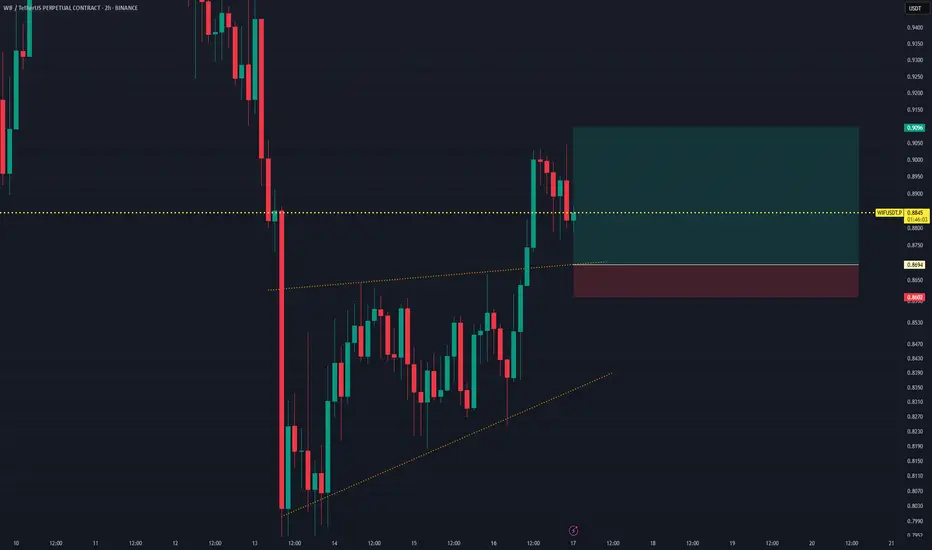
WIFUSDT Bullish Retest Setup – Breakout Confirmation EntryThis setup highlights a bullish breakout from an ascending triangle pattern on WIFUSDT. After the breakout, price pulls back and retests the former resistance line (now turned support), providing a clean entry signal with a favorable Risk:Reward ratio. The setup aims to capture further upward movement following the retest confirmation.
Trade Details:
Entry Price: 0.8694 USDT
Take Profit (TP): 0.9096 USDT
Stop Loss (SL): 0.8602 USDT
Risk:Reward Ratio (RRR): 1 : 4.37
Potential Gain: +0.0402 USDT → +4.62%
Potential Loss: -0.0092 USDT → -1.06%
Price collapsed. I didn’t flinch. Here’s whyThat wick didn’t scare me — it confirmed the setup. Volume spiked, price swept an equal low, and printed the reaction I was waiting for.
The logic:
Clean FVG formed on the drop
Price returned to rebalance
Reaction from that FVG confirms Smart Money intent
It’s not about chasing the reversal — it’s about understanding the anatomy of one. And that’s exactly what just unfolded here.
Below price? An untouched EQ level. Above? A full inefficiency gap into 0.99. That’s the delivery map.
Trade framework:
Re-entry: Into the FVG zone (~0.825–0.807)
SL: Below EQ (~0.79)
TP1: 0.91 POC sweep
Final objective: Full push into 0.99
This isn't hype. This is precision. You don't need magic indicators when price gives you the story in volume and imbalance.
Final words:
“I don’t chase the move. I identify where it started — and wait for it to return.”
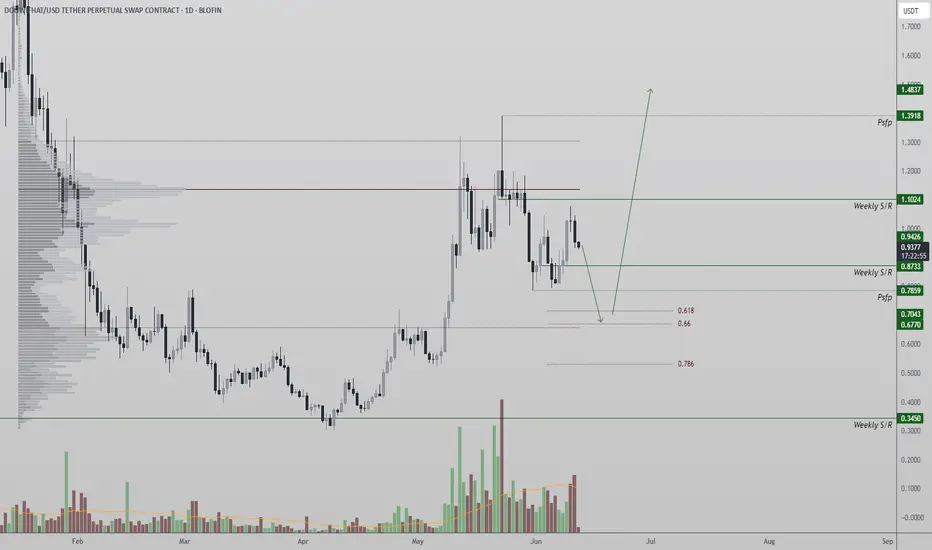
WIF Rejection at Resistance — Deeper Correction Toward $1.87 PosWIFCOIN (WIF) has rejected from a major resistance confluence, posting a swing failure pattern at the value area high. The rejection has pushed price below the point of control (POC) — a high-volume node that previously acted as support but is now flipped into resistance.
This region also included the 0.618 Fibonacci retracement and a weekly SR level, forming a strong cluster of resistance now capping upside potential in the short term.
As long as price remains below this confluence, WIF may be in the early stages of a pullback toward $1.87, a prior swing low and a logical liquidity zone. This would be a healthy corrective move within the context of a larger uptrend and could help form a higher low.
Further downside could lead to a test of the $1.67–$1.50 region, where value area low support and an untested order block converge — ideal conditions for a potential bullish reaction.
Until WIF reclaims the POC and breaks back above $2.15, short-term momentum remains in favor of sellers.
Key Levels to Watch:
Resistance: $2.15 (POC + 0.618 + Weekly SR)
Support: $1.87 / $1.67–$1.50
Bias: Bearish short-term, bullish macro (if higher low forms)
20% in the bagkey take away. inside week -> tuesday false break at the high and closing back inside monday's range-> wednesday's london session opened below the highest low among all the sessions low which in this case was tuesday's london session, then pullback into it and start to drop about 10 hr later. eighter it hit the other side of the range or i will close it at next monday open. after wednesday closing in profit, moved my stop to BE and Thursday continued the move to hit Tp$$
on the way to glorygoing to hold until the next Monday open unless it hit my tp. Not even moving my stop to break even, let it the market do what ever it wants.Inside week+ D1, back to the other side of the range
WIF WIF! _ Its done!So as said and mentioned about WIF in my previous chart, smooth moves as usual!!

WIFUSDT Forming Classic Wedge WIFUSDT has recently formed a classic wedge pattern, a powerful technical indicator often associated with upcoming breakouts. Wedge patterns, especially those with tightening price action and consistent volume, suggest a coiled market preparing for a strong directional move. In the case of WIFUSDT, this wedge structure is showing all the right characteristics for a bullish breakout, supported by growing trading volume and increasing investor interest.
The price structure within the wedge is narrowing, indicating a possible compression before expansion. This typically precedes a sharp breakout, and current market behavior around WIFUSDT suggests bulls are positioning themselves for a significant upside move. Technical projections show a strong potential for gains ranging between 140% to 150%+, especially if the breakout is accompanied by momentum confirmation on higher timeframes.
What adds to the bullish thesis is the noticeable uptick in trading volume, which confirms that accumulation might already be underway. When volume supports a pattern breakout, it often adds strength and sustainability to the move. With market sentiment slowly shifting and capital rotating into altcoins, WIFUSDT stands out as a high-potential candidate in the current environment.
WIFUSDT is quickly becoming a favorite among breakout traders and short-term investors looking to ride explosive setups. If the wedge breaks to the upside as expected, it could mark the beginning of a strong rally phase. Traders may want to monitor closely for entry signals as the breakout unfolds.
✅ Show your support by hitting the like button and
✅ Leaving a comment below! (What is You opinion about this Coin)
Your feedback and engagement keep me inspired to share more insightful market analysis with you!
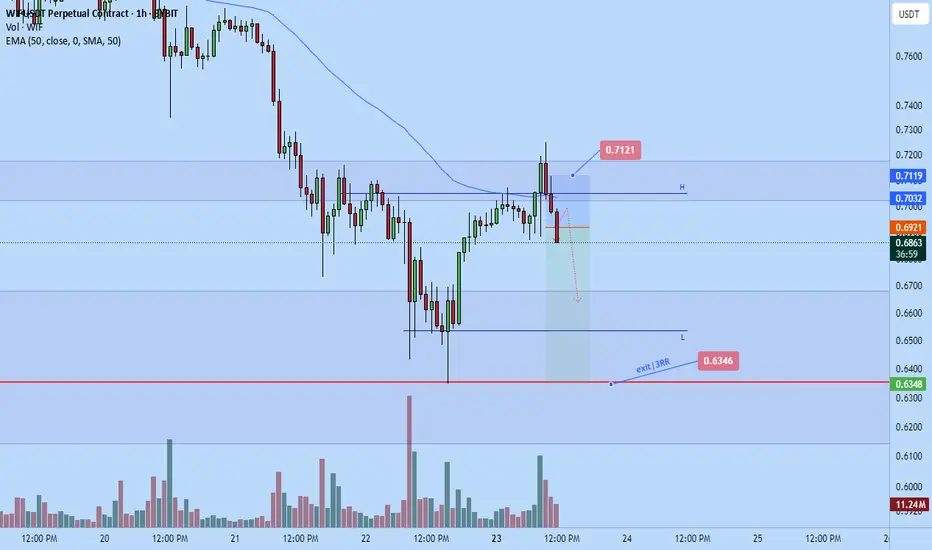
Wif short to $0.6346I recently opened a short position on WIF.
Targeting $0.6346
Stop: $0.7121
Roughly 3RR
Time sensitive
Call an Ambulance - But for Shorters - WIF WIFWIF is in such a position that all orders(sell) has been observed by the buyers, on accumulation on darvas box and soon to slice of the sellers! wait and watch!

Looking good so farWednesday is often the reversal day into the back side of the week. This week the Wednesday did its job perfectly. When Monday broke the the high of previous week (inside week), it has a high probability to reverse to the other side of the inside week. Looking to hold this to the low of current week which was Monday or even to the other side of the inside week if the market gives it before Sunday candle closes,if not I will close at Sunday , or it could just rally back up and clean me out. Its ok, if it doesn’t hit the target, next week it still have a chance to continue the reversal back towards the low

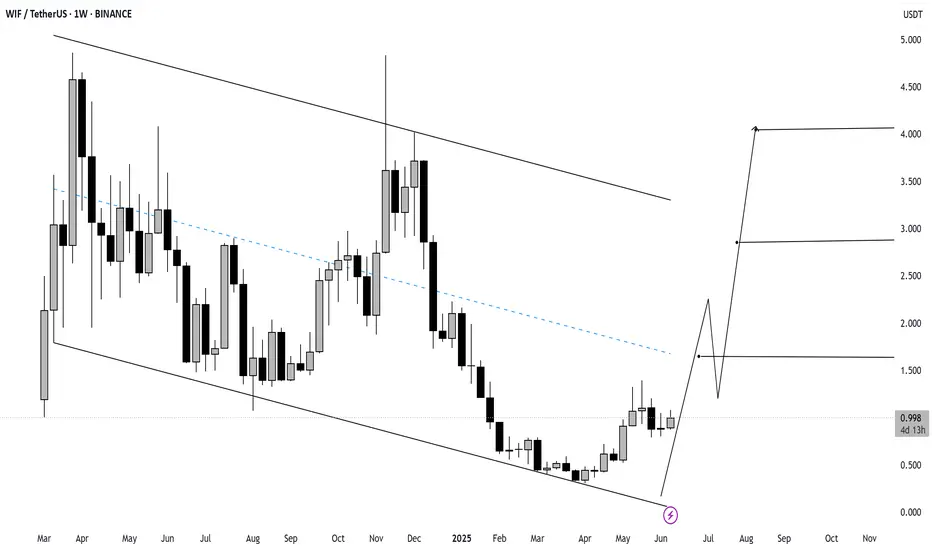
WIF/USDT Weekly Chart Analysis – June 11, 2025
The chart for WIF (Dogwifhat) on the weekly timeframe shows a bullish breakout setup emerging from a long-term descending channel. Price has bounced off the lower boundary and is now pushing higher.
🔍 Key Technical Highlights:
Current Price: $0.996
Structure: Descending channel (breakout in progress)
Momentum: Weekly candle closed +12.04%, indicating strength
🎯 Potential Upside Targets:
$1.70 – Breakout confirmation zone
$3.00 – Mid-channel horizontal resistance
$4.20 – Full breakout target at channel top
📈 Technical Outlook:
A clean breakout above $1.00 and hold above it may validate the bullish reversal.
Watch for a retest of $1.00 as support before continuation.
If momentum continues, WIF could target $3.00 and $4.20 in the coming weeks.
📌 Summary Strategy:
Buy Zone: On confirmation of breakout & retest (~$1.00)
TP1: $1.70
TP2: $3.00
TP3: $4.20
Invalidation: Break below $0.85 (channel base)
Might be a quick drop , could be 20% in this or the next weekPrevious week was inside week,this week opened up and Monday pumped to previous weeks high, then put in a false break on Tuesday, which coincide with Wednesday, the back side of the week,it was making higher low every session during the front side of the move, In Wednesday’s London session it open below a prior session low. So I put a limit order when it pull back up to that level, because last week was an inside week, we could see a violence drop in this or the next week back toward or to the low of the previous week, minimum target is current week’s low and another target is previous week’s low
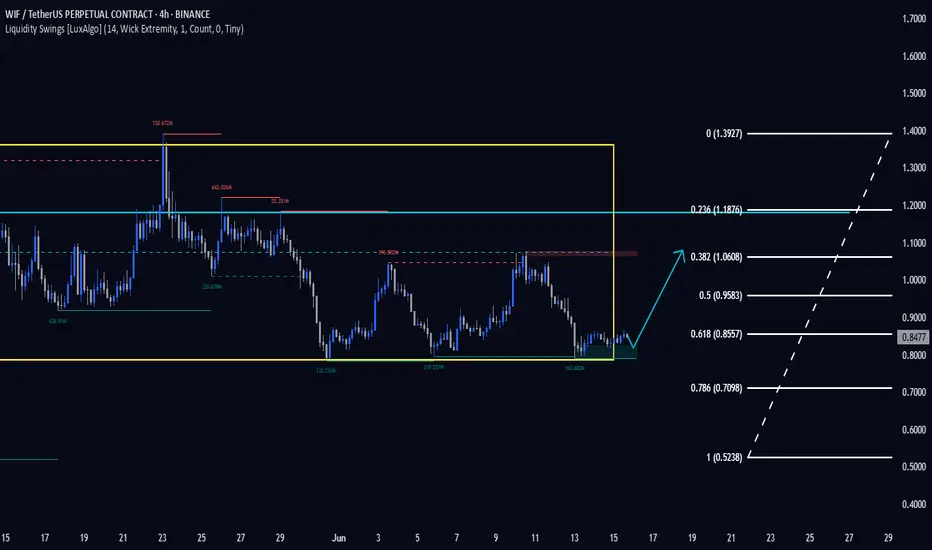
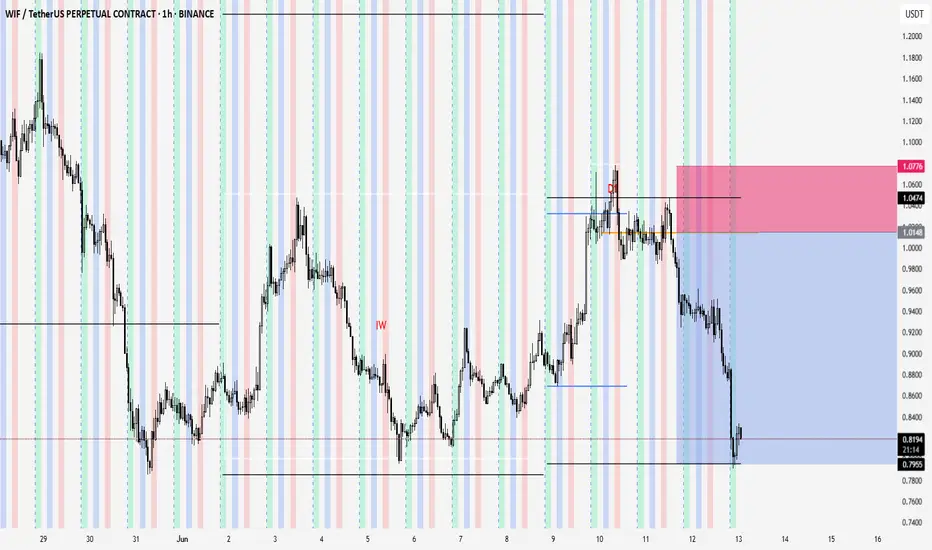
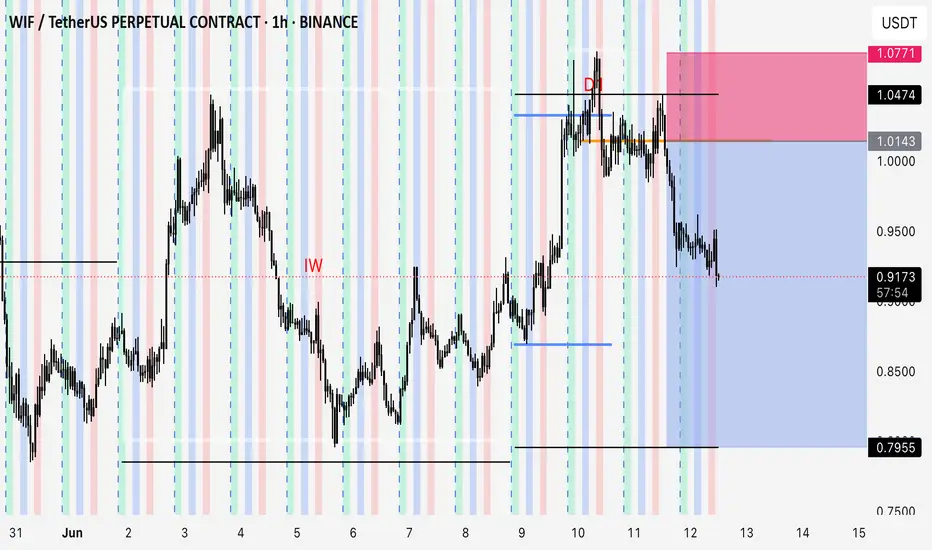
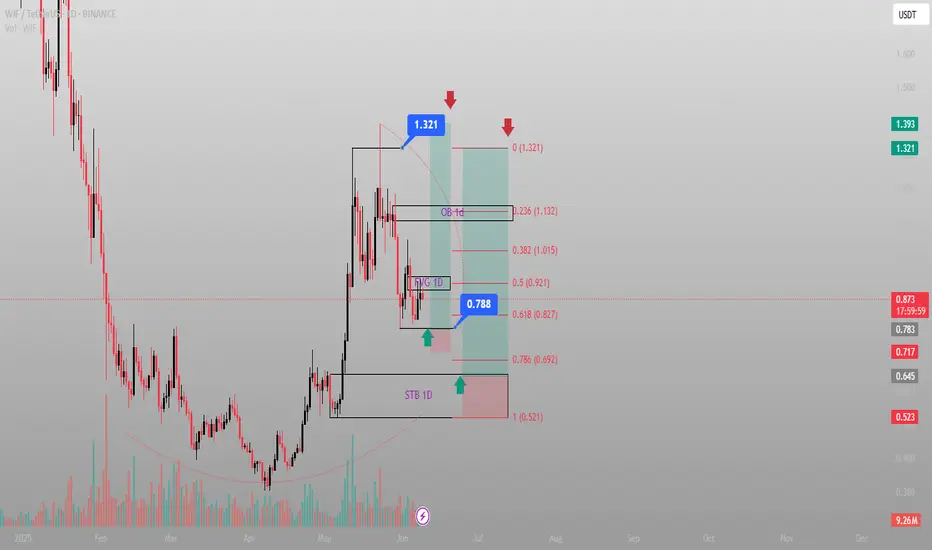
They brought it down for the fill — now it's time to see who’s rBINANCE:WIFUSDT just reacted perfectly off the 0.618 golden zone at 0.827 with bullish intent. The STB 1D and FVG 1D combo formed a high-probability demand zone that Smart Money won't ignore lightly.
Here’s the bullish roadmap:
Entry: 0.788 (bottom wick through 0.618 fib)
Structure: Clear higher low with mitigation of FVG 1D
Volume: Climax candle into key levels — classic absorption
Targets:
TP1: 0.921 (mid-level fib and consolidation ceiling)
TP2: 1.015 - 1.132 (FVG to OB 1D imbalance fill)
TP3: 1.321 (full expansion target — optimal trade entry delivery)
Moonshot: 1.393 if bulls dominate past OB retest
Invalidation: Daily close below 0.692 (STB 1D)
Price doesn’t just reverse — it transfers power. This is that shift.
For more plays just like this — all based in structure and timing — check the profile for setups that speak precision, not prediction.
analysis on wif Check out WIF Lets see if Wif can do $1.50 in the coming weeks let me know your ideal.
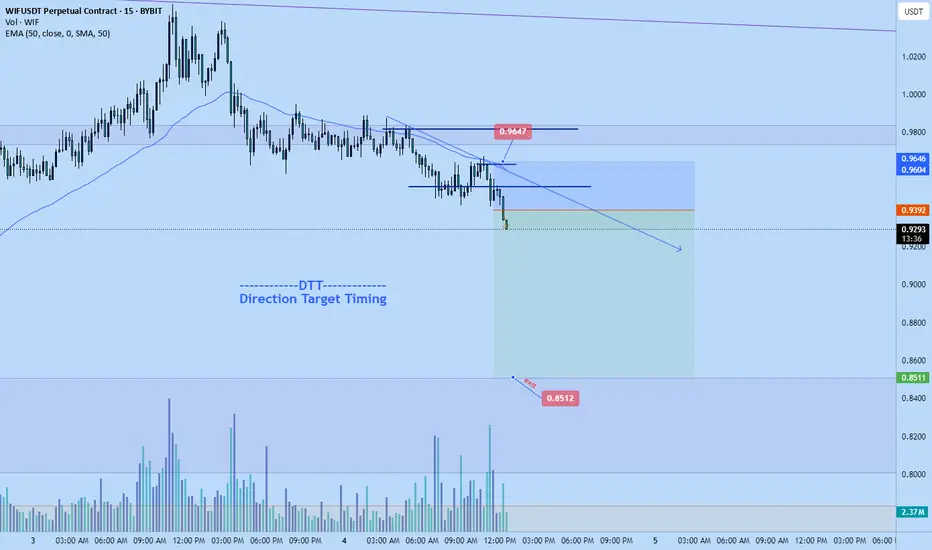
Wif big dump to 0.9647just recently hopped into a short position on wif. Targeting $0.8512
Time sensitive.
Big short likely in play. .
3.5+RR
Weekly tf was already high, market seems to be heading back down to try and find a new HL to continue the bullish move...or maybe not