Crude Oil Found Support: What's Next?FenzoFx—Crude oil tested the $58.9 level as support and bounced back from it. The primary trend is bearish; therefore, it will likely resume if the price closes and stabilizes below this support.
If this scenario unfolds, the next bearish target could be the $55.15 support level.
>>> Win $160.0 prize every week by joining FenzoFx contest.
WTICOUSD trade ideas
Remove Impulsiveness by planning your trade!! BUY OIL All the information you need to find a high probability trade are in front of you on the charts so build your trading decisions on 'the facts' of the chart NOT what you think or what you want to happen or even what you heard will happen. If you have enough facts telling you to trade in a certain direction and therefore enough confluence to take a trade, then this is how you will gain consistency in you trading and build confidence. Check out my trade idea!!
tradingview.sweetlogin.com

What Happens to Global Markets When the Ukraine-Russia War Ends?What Happens to Global Markets When the Ukraine-Russia War Ends?
The end of the Ukraine-Russia war will undoubtedly impact major global markets,
here’s what we can expect:
Oil Market : With tensions easing, oil prices could drop as supply concerns lessen and sanctions ease. However, global demand could still keep prices stable or even high.
Gold Market : Gold, a safe-haven asset, might face a decrease in demand as geopolitical uncertainty fades, but if the end of the war leads to global economic instability, gold could remain a strong choice for investors.
Forex Market : The end of the conflict could boost the Euro and USD as stability returns to the market. At the same time, the Russian Ruble might face fluctuations as Russia’s economy adjusts to post-war conditions.
Crypto Market : Cryptocurrencies may see mixed reactions—some may retreat as confidence in traditional markets rises, but others could flow in if economic uncertainty continues to prevail globally.
🔮 The war's end could bring hope, but it also presents new challenges for markets worldwide. Stay tuned to see how it all plays out!
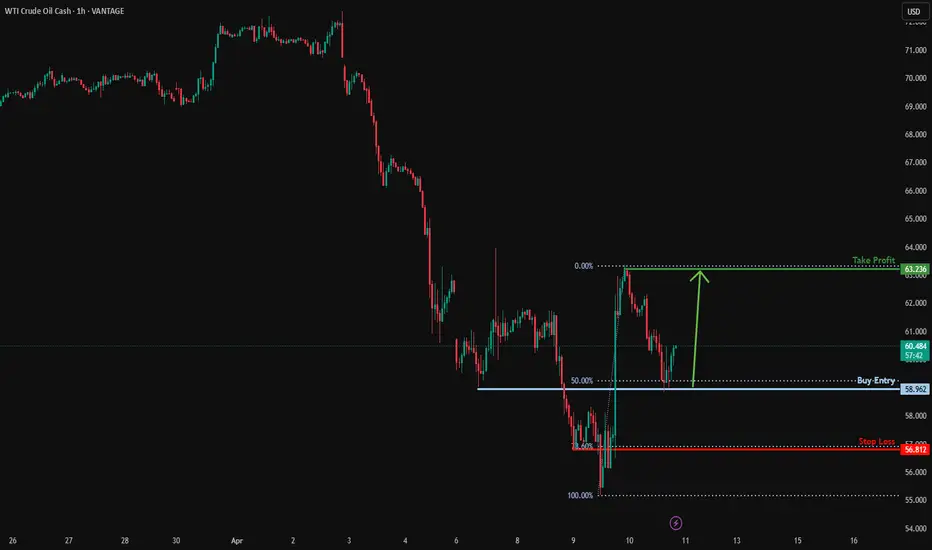
Bullish bounce?USO/USD has bounced off the support level which is a pullback support that lines up with the 50% Fibonacci retracement and could potentially rise from this level to our take profit.
Entry: 58.96
Why we like it:
There is a pullback support level that lines up with the 50% Fibonacci retracement.
Stop loss: 56.81
Why we like it:
There is a pullback support level that lines up with the 78.6% Fibonacci retracement.
Take profit: 63.23
Why we like it:
There is a pullback resistance level.
Enjoying your TradingView experience? Review us!
Please be advised that the information presented on TradingView is provided to Vantage (‘Vantage Global Limited’, ‘we’) by a third-party provider (‘Everest Fortune Group’). Please be reminded that you are solely responsible for the trading decisions on your account. There is a very high degree of risk involved in trading. Any information and/or content is intended entirely for research, educational and informational purposes only and does not constitute investment or consultation advice or investment strategy. The information is not tailored to the investment needs of any specific person and therefore does not involve a consideration of any of the investment objectives, financial situation or needs of any viewer that may receive it. Kindly also note that past performance is not a reliable indicator of future results. Actual results may differ materially from those anticipated in forward-looking or past performance statements. We assume no liability as to the accuracy or completeness of any of the information and/or content provided herein and the Company cannot be held responsible for any omission, mistake nor for any loss or damage including without limitation to any loss of profit which may arise from reliance on any information supplied by Everest Fortune Group.
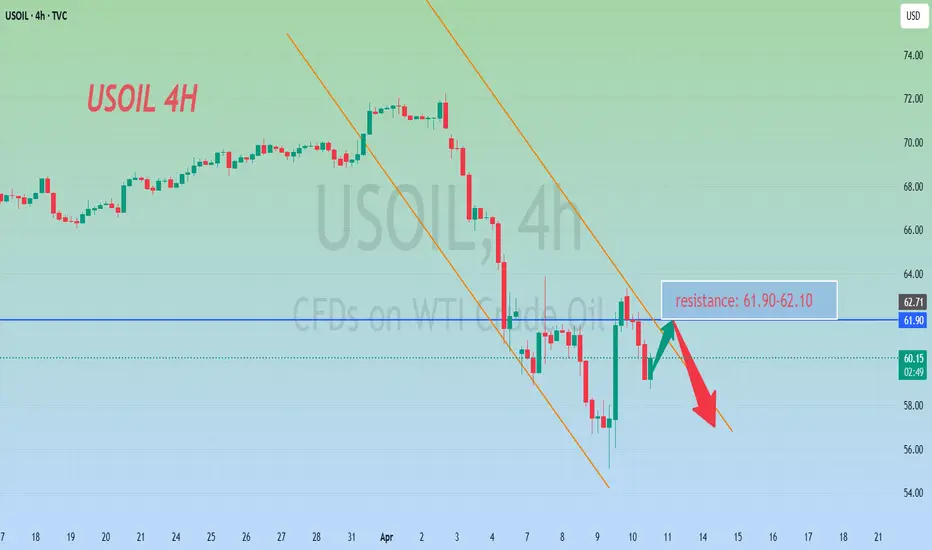
Analysis of Crude Oil StrategiesCrude oil bottomed out and rebounded sharply on Wednesday. This was also due to the impact of the tariff war, which is currently dominating the trend of the financial market. However, on Thursday, it didn't continue to rise. Instead, it fell successively and retraced. Pay attention to going long at the support level of 58.20 below, and consider going short at the resistance level of 61.90 above.
Oil trading strategy:
sell @ 61.90-62.10
sl 62.80
tp 60.95-61.10
If you approve of my analysis, you can give it a thumbs-up as support. If you have different opinions, you can leave your thoughts in the comments.Thank you!
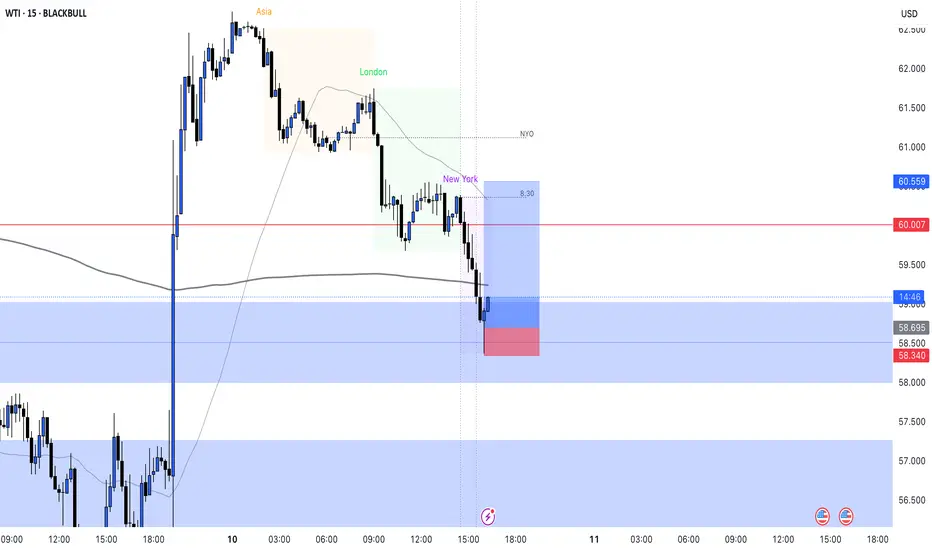
Oil Bounces from Demand LONG📈 WTI Crude Oil – 15M Long Setup | Demand Zone + Macro Confluence
This long setup on WTI was taken after price tapped into a key 15-minute demand zone, following a sharp NY session selloff. The entry aligns with both technical and macroeconomic confluences, suggesting a potential intraday reversal.
⸻
🔍 Macro Context
• Recent volatility triggered by geopolitical tensions in the Middle East and a larger-than-expected U.S. crude inventory build.
• Early DXY strength pressured oil prices, but a pullback around the New York Open created ideal conditions for a bounce.
• Market participants are repositioning ahead of U.S. CPI data and Fed speakers, creating liquidity sweeps and short-term inefficiencies.
• OPEC+ supply discipline and long-term underinvestment in energy infrastructure continue to support a bullish medium-term narrative.
⸻
📊 Technical Setup
• Entry: Rejection from 15M demand zone after liquidity sweep
• Stop Loss: Below demand zone and intraday low
• Take Profit: Imbalance fill near NYO and previous intraday structure (Target 60.55)
• R:R: 5.25
• Session: New York – increased volume and volatility
This setup is a great example of combining Smart Money Concepts (SMC) with macro catalysts, aiming to capture a high-probability reaction from an institutional zone during peak liquidity hours.
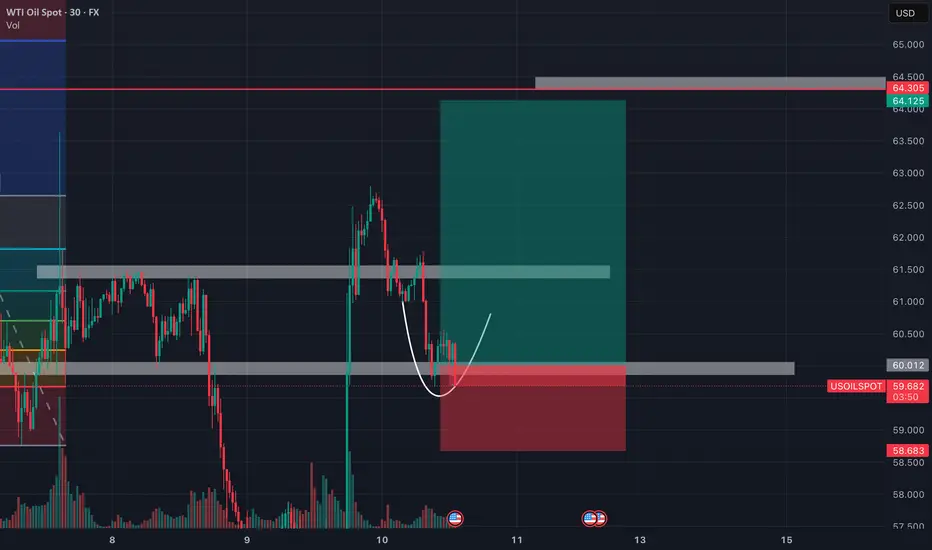
WTI Crude Oil | Potential Cup Formation with Volume Support.I’m spotting a potential Cup formation on the 30-min chart of WTI Crude Oil (USOILSPC), backed by strong volume profile zones. The price has recently pulled back to a low-volume area and is now consolidating with higher lows forming the right side of the cup.
A break above the $60.60–$60.80 zone could trigger bullish continuation toward $64+, with strong support seen around the $59–$59.30 range (volume shelf).
Setup Details:
• Pattern: Cup (early stage)
• Entry idea: Break & retest above $60.60
• TP: $64.00
• SL: Below $58.90
• Volume profile confirms accumulation near the lows
Watching closely for confirmation before adding more size. This is part of a low-risk entry using a funded account model.
#CrudeOil #WTI #VolumeProfile #CupFormation #BreakoutTrade #SmartMoneyConcepts
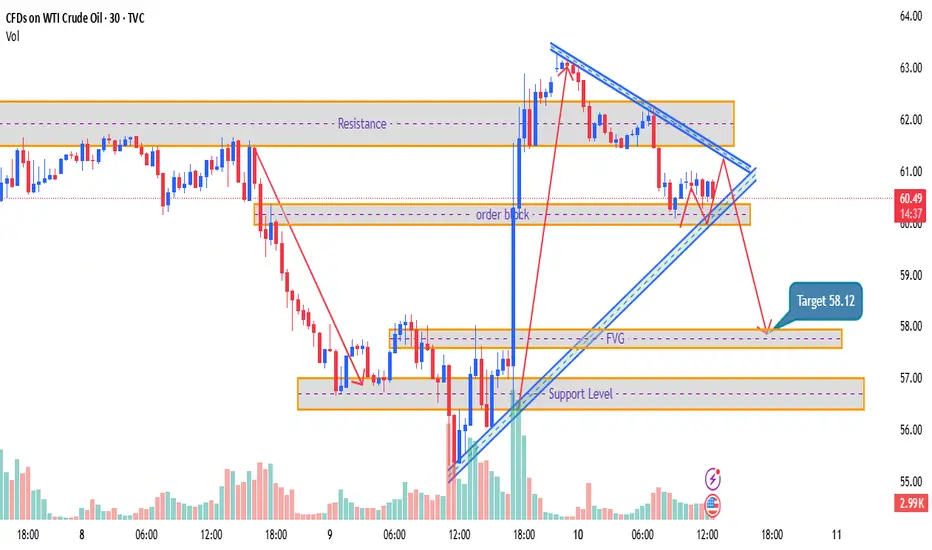
USOIL Oil – April 10, 2025
Price Action & Trend Analysis:
- Current Market Position:
- WTI Crude Oil is showing a bearish trend within a falling wedge pattern, a technical formation that often signals a potential breakout after consolidation. This pattern is visible with converging trendlines (blue), which suggest a potential move to the downside.
- The resistance zone is marked at 61.50, and the price is struggling to break above this level. If it does not break out of this level, further downside momentum may be expected.
Key Levels:
1. Resistance Zone:
- The resistance level is clearly marked near 61.50, and price action has repeatedly struggled to move above this level, showing signs of rejection. A failure to break this l…
ChatGPT: 4. FVG (Fair Value Gap):
- There is a Fair Value Gap (FVG) near 58.12, which indicates a possible area of imbalance where price could potentially retrace to fill the gap before moving in its next direction.
Volume Analysis:
- The volume profile indicates decreasing volume as the price approaches the resistance zone at 61.50, which may suggest a weakening of bullish momentum.
- The increasing volume near the support level at 58.00 suggests that buyers are looking to step in at these levels, but this remains to be seen as the price moves toward this region.
Key Observations:
- The bearish divergence observed between price and momentum suggests that bearish pressure is mounting, especially with the price failing to breach resistance and forming lower highs.
- T
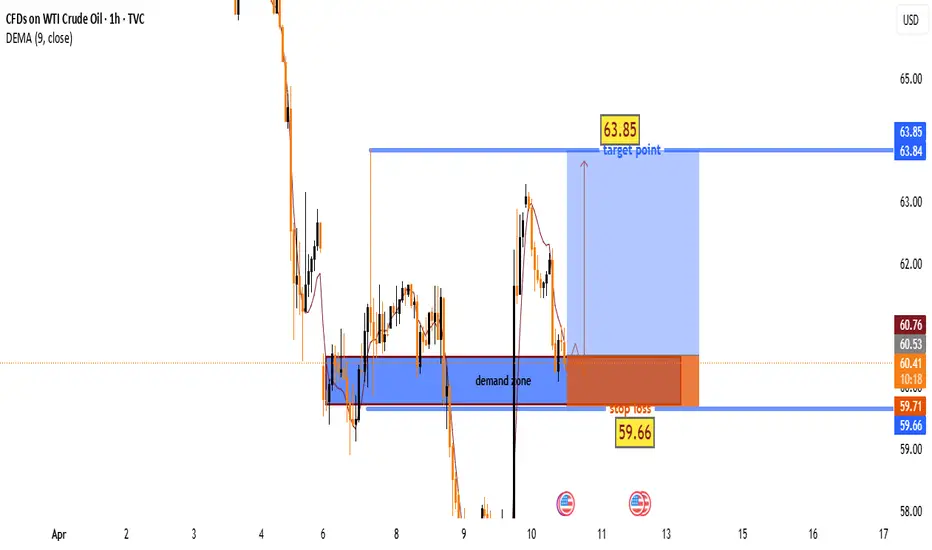
"WTI Crude Oil – Bullish Bounce from Demand Zone? "🔵 . Demand Zone:
⬇️ 60.53 – 59.71
This is the buy zone where bulls are likely to step in!
Price is currently testing this area. Watch closely!
🛑 . Stop Loss (Risk Zone):
📉 Below 59.66
If price falls below here, exit the trade – demand has failed.
🎯 . Target Point:
🚀 63.85
This is the take profit zone. A successful bounce could reach this level!
🟠 . EMA (9-period DEMA):
📉 Currently around 60.86
Price is slightly below EMA, showing short-term bearish pressure.
🟢 . Trade Idea Summary:
• Enter near the blue demand zone
• SL below 🔴 59.66
• TP at 🎯 63.85
• R:R ratio looks favorable (low risk, high reward)
Outlook:
As long as price holds above the demand zone, this setup remains bullish 📈
Let’s see if the bulls can push it to that 63.85 target! 🚀💰
Crude 1 hr - ST trade - Long at trendlineCrude has pulled back after the furious bounce yday
Buy close to trendline - narrow SL as per risk appetite
58 .5 can be a deep stop. target c 65

US500, XAUUSD & XTIUSD Daily Trade SetupsIn this update, we review the recent price action in the US500, XAUUSD & XTIUSD and identify the next high probability trading opportunity and price objectives to target. To review today's video analysis, click here.

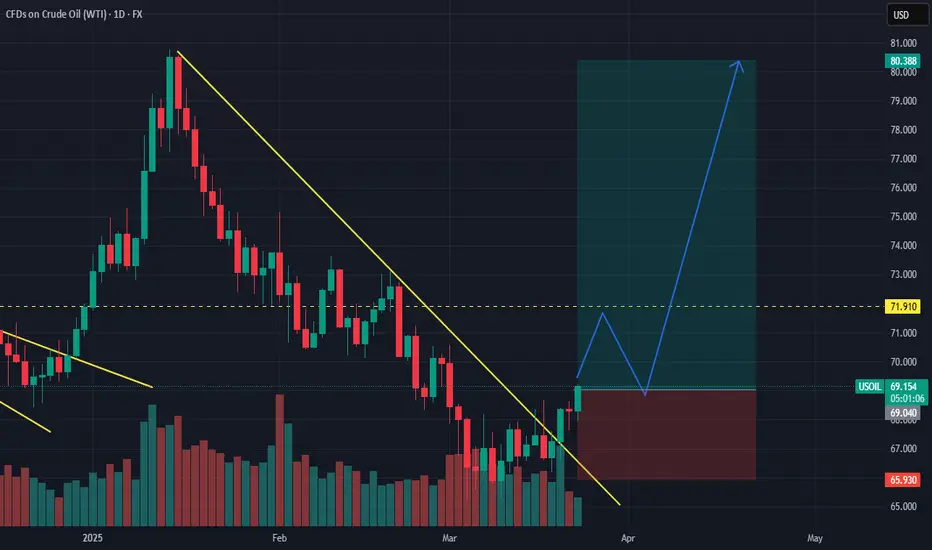
OIL PULLBACK 58-59 Then go up to 75-80OIL PULLBACK 58-59 Then go up to 75-80. Buy limit 58-59 sl 56.5 tp75-80

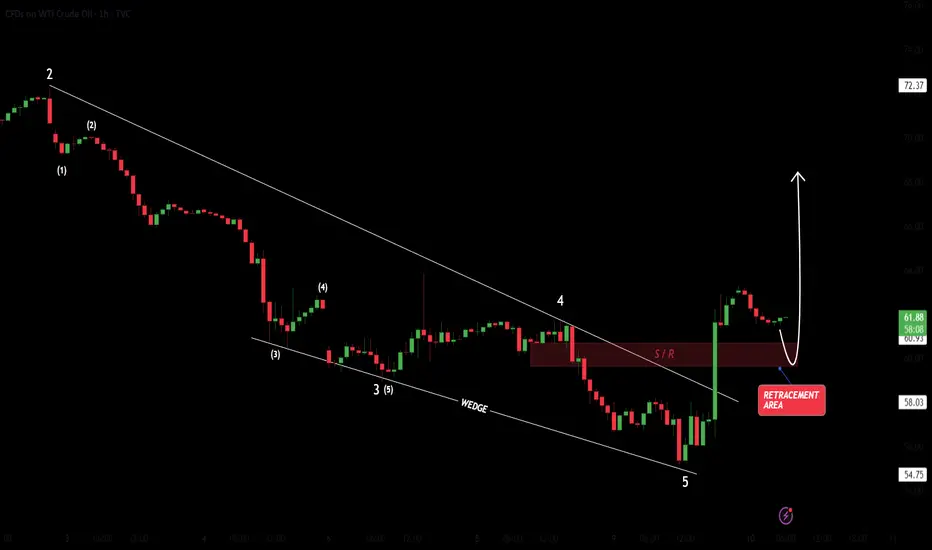
US OilCrude Oil
- Falling Wedge as an corrective pattern in Short Time Frame
- Break of Structure
- S / R Level
- Completed " 12345 " Impulsive Waves and " A " Corrective Waves
- Demand Zone
Long WTIUS10Y yield (white) and WTI typically trade in lockstep, but have recently diverged with US10Y rebounding while WTI has continued to observe selling pressure.
Expecting divergence to narrow, with WTI moving higher off recent lows. Entering long positions on WTI contracts.
US OIL SHORT RESULT Crude oil price action moved exactly in our Prediction and even Better.
Currently the price is in a new Bullish trend due to the FOMC news, but we'll watch it to see if it holds and it's authenticity before Opening new trades to ensure it's not just hype or manipulation.

OIL TO PUMP UPOil has broken the downtrend and turned bullish. Tump's Iran threads is also likely to accelerate the bullish push faster.
Risk no more than one per cent.
Swing trade so expect to hold it for weeks
Once trade over 200 pips in profit, set breakeven
Follow us for more perfect swing setups