Silver (XAG/USD) Bullish Trade Setup from Key Support ZoneXAG/USD (Silver) Trade Analysis – 2H Chart (July 2, 2025)
🔹 Trade Setup Overview:
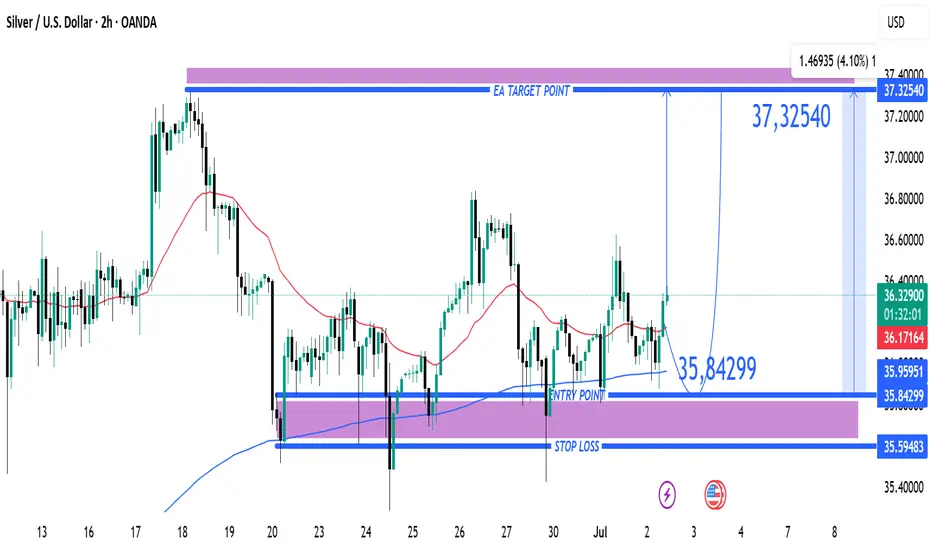
Entry Point: 35.84299
Target (TP): 37.32540
Stop Loss (SL): 35.59483
Current Price: 36.36350
Risk/Reward Ratio: ~5.9:1 (Very favorable)
🔹 Technical Insights:
Support Zone:
Price recently tested and respected a st
About Silver / U.S. Dollar
Silver Prices have been followed for centuries. Silver (XAG) is a precious metal used in jewelry, silverware, electronics, and currency. Silver prices are widely followed in financial markets around the world. Silver has been traded for thousands of years and was once used for currency backing. Silver continues to be one of the most commonly traded commodities today. Silver prices are highly volatile due to speculation and supply and demand. Ag is the chemical symbol for silver on the periodic table of elements and its ISO currency symbol is XAG.
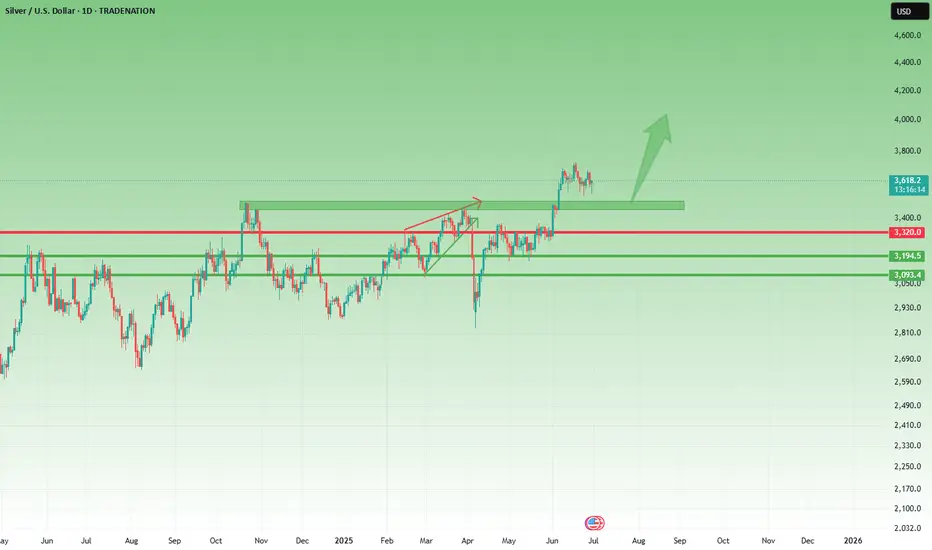
XAGUSD – Bullish Setup for a Move Toward 40 1. What happened recently
After the massive selloff in early April, Silver (XAGUSD) reversed aggressively — gaining nearly 10,000 pips and breaking into multi-decade highs near 38. That kind of move is not noise. It’s power.
The month of June brought consolidation, with price slowly correcting an
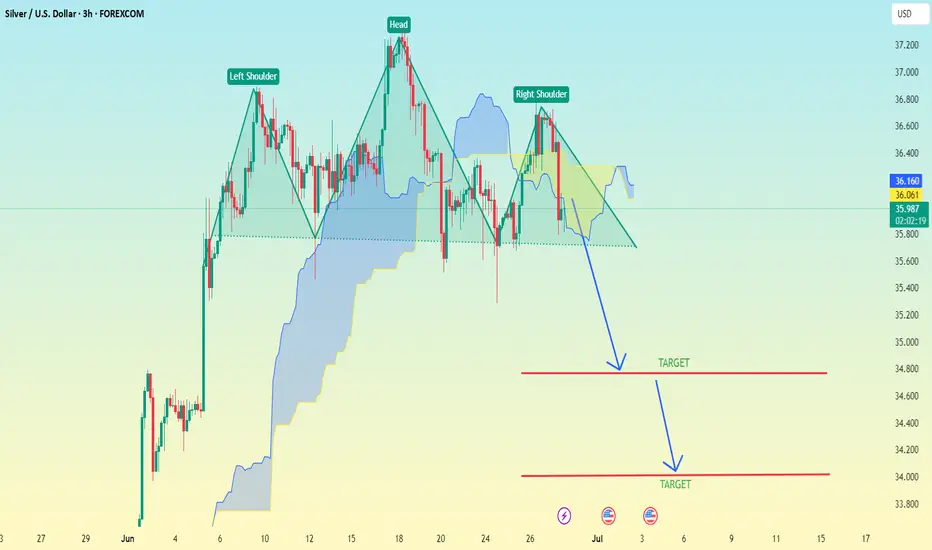
(XAG/USD – Silver vs USD–3h timeframe) Head and Shoulder Pattern(XAG/USD – Silver vs USD – 3h timeframe), a Head and Shoulders pattern is clearly marked, which is a bearish reversal signal.
Key Details:
Pattern: Head and Shoulders
Neckline: Approximately at the 35.90–36.00 level
Breakout Direction: Down
Measured Move Target Method: To estimate the target, s
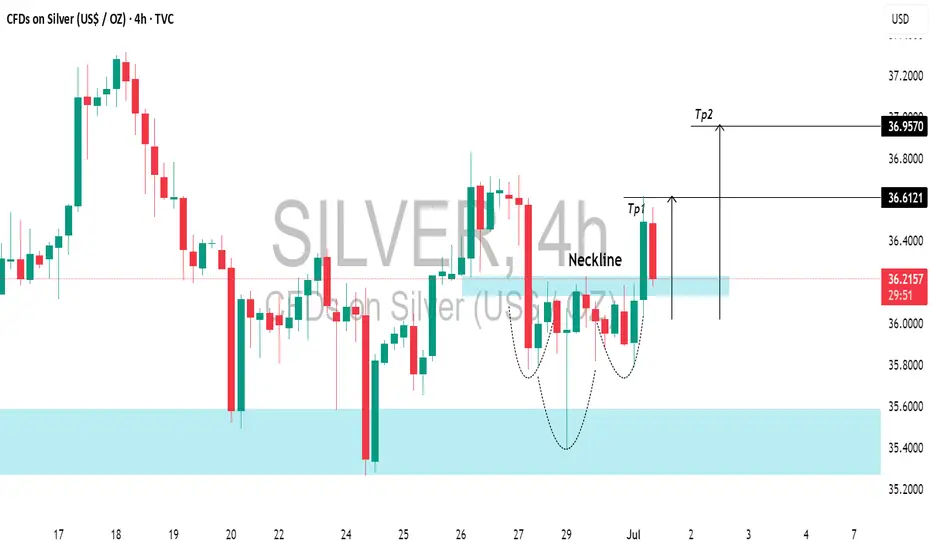
SILVER (XAGUSD): Pullback From SupportIt seems that the time has come for 📈SILVER to experience a pullback.
This morning, I've observed a solid intraday bullish signal with the emergence of a head and shoulders pattern on the 4-hour chart.
I anticipate a pullback to at least 36.61, followed by a move to 36.95.
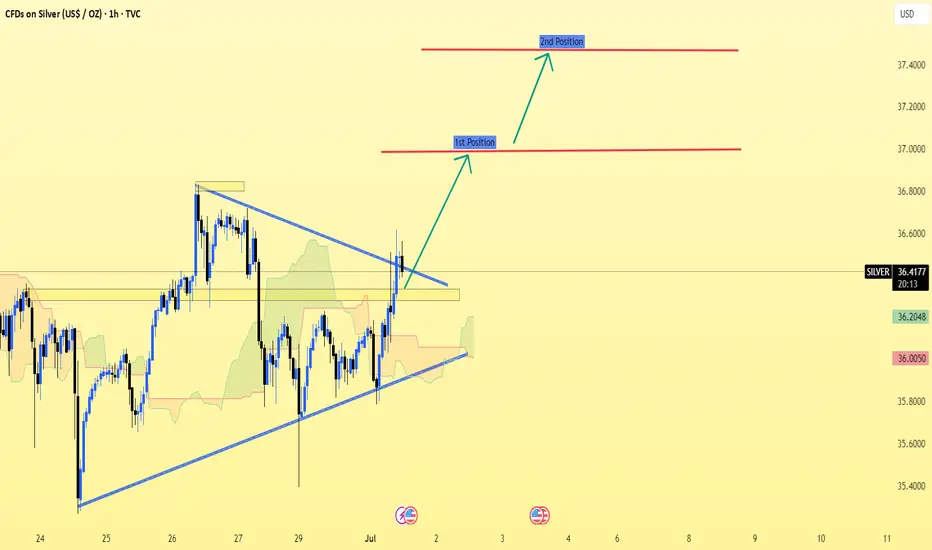
Silver (XAG/USD) on the 1-hour timeframe.Silver (XAG/USD) on the 1-hour timeframe, the chart shows a bullish breakout from a symmetrical triangle pattern. Here's the target breakdown:
📈 Silver Bullish Targets:
Current Price: Around 36.42
1st Target (TP1): Approximately 36.95 – 37.00
2nd Target (TP2): Approximately 37.40 – 37.50
These
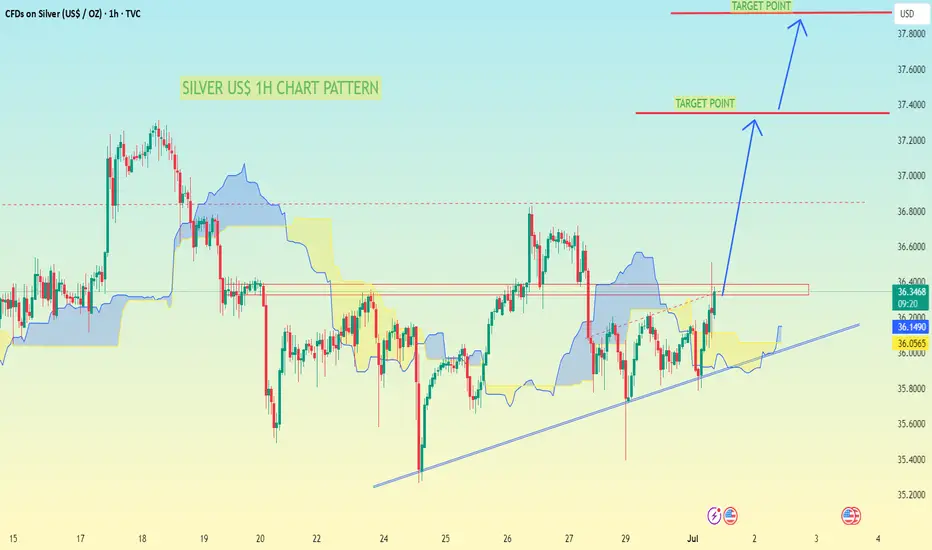
SILVER US$ 1H CHART PATTERNSilver (XAG/USD) 1H timeframe, here’s a breakdown of the target levels indicated:
📈 Chart Analysis Highlights:
The chart shows a bullish ascending triangle pattern, which is typically a continuation pattern signaling upward movement.
The price has recently broken above resistance around the 36.36
"SILVER (XAGUSD) July Breakdown = Trend Reversal SetupSilver’s explosive rally may be running out of steam — the July setup is screaming SELL.
📌 Using Vinnie’s Trading Cheat Code System, here’s the case:
✅ CC SELL confirmed near the 37.30 zone
✅ RSI Overbought printed — classic blow-off top conditions
✅ MACD rolling over + weakening momentum
✅ Pri
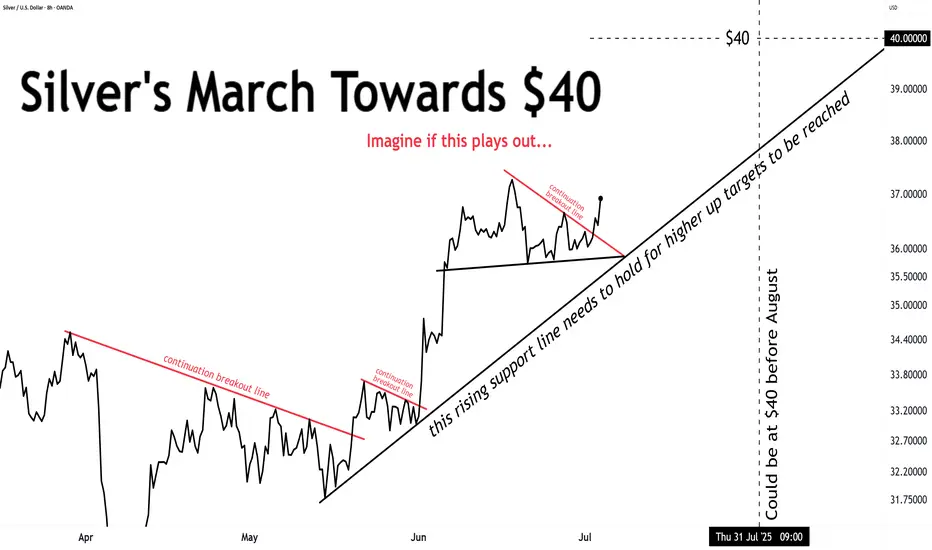
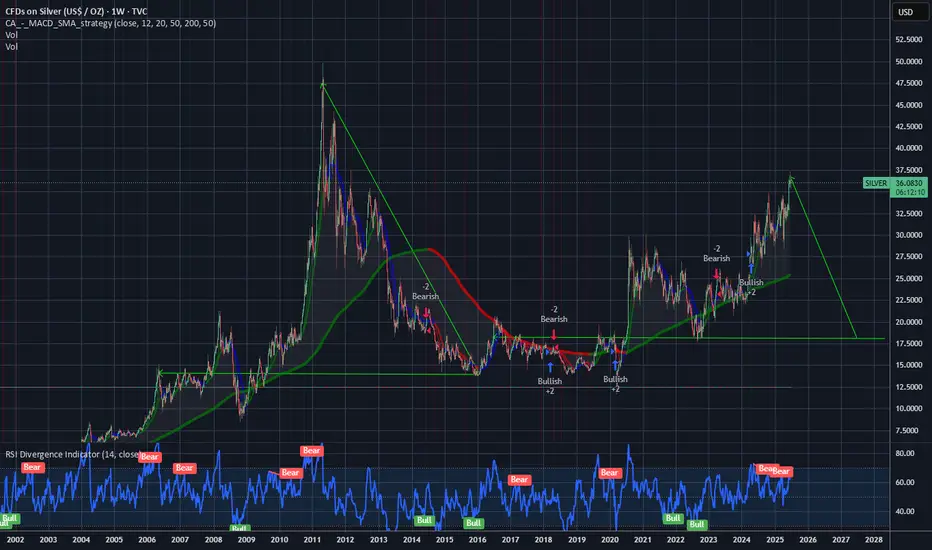
And silver's ride to $40 continues ...this rising support line needs to hold for higher up targets to be reached
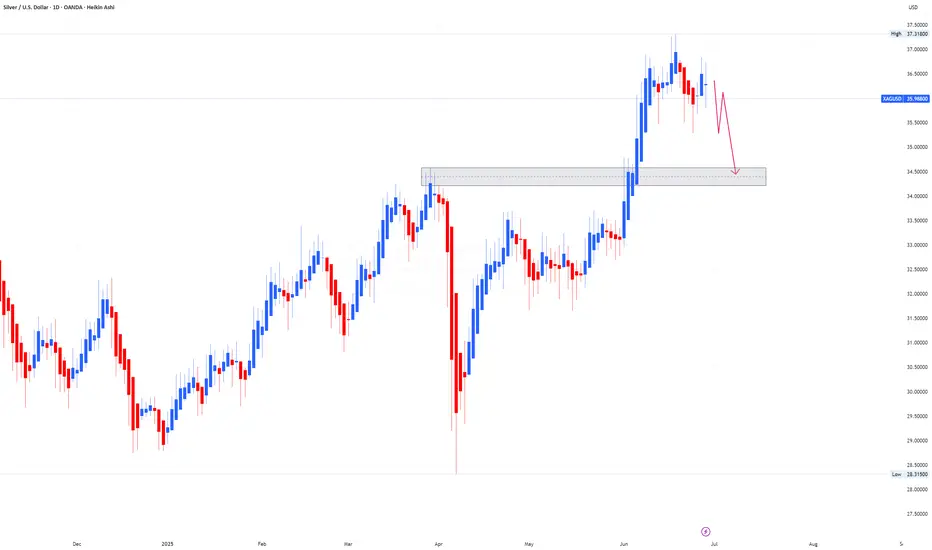
$18 retest.Silver historically always crushes the bulls when they are most hopeful for a parabolic breakout.
Even if we are at the start of a super bull cycle in silver, the bull market MUST have massive retracements to achieve insane highs. The higher and faster a bull market goes up without complete washou
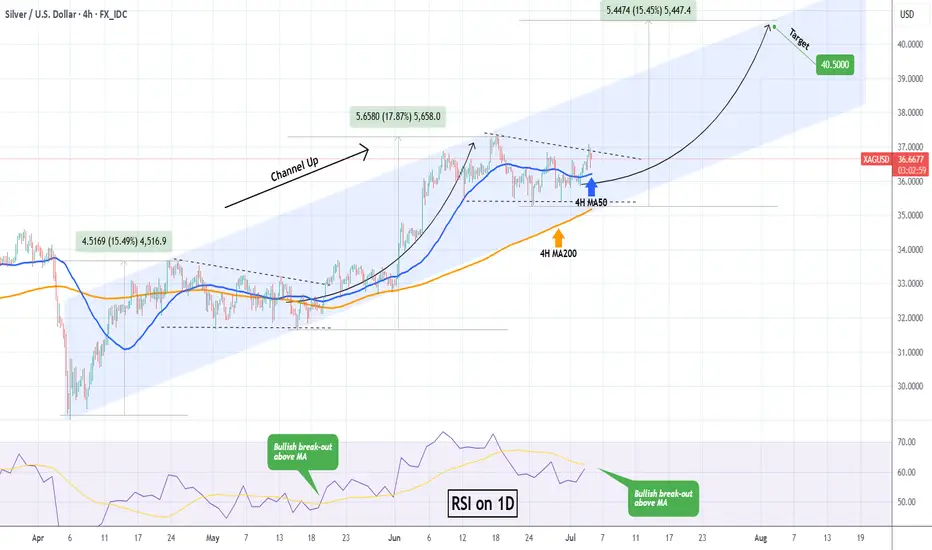
XAGUSD Strong accumulation waiting for a break-out. Silver (XAGUSD) has been trading within a 3-month Channel Up pattern and since the June 18 Higher High, it has entered a Descending Triangle.
This has previous been an Accumulation pattern, which after broken to the upside, it led to June's High. Similarly, we expect a bullish break-out once the 4H
See all ideas
Displays a symbol's price movements over previous years to identify recurring trends.