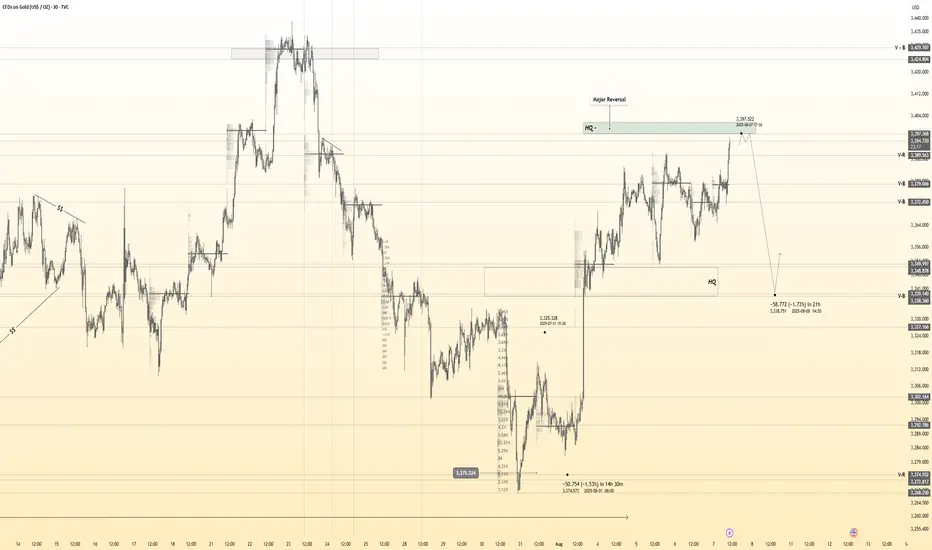
Gold 30Min Engaged ( Bearish & Bullish Entry Detected )Time Frame: 30-Minute Warfare
Entry Protocol: Only after volume-verified breakout
🩸Bearish Reversal From - 3397
🩸Bullish Reversal : 3341
➗ Hanzo Protocol: Volume-Tiered Entry Authority
➕ Zone Activated: Dynamic market pressure detected.
The level isn’t just price — it’s a memory of where they mo
About Gold Spot / U.S. Dollar
Gold price is widely followed in financial markets around the world. Gold was the basis of economic capitalism for hundreds of years until the repeal of the Gold standard, which led to the expansion of a flat currency system in which paper money doesn't have an implied backing with any physical form of monetization. AU is the code for Gold on the Periodic table of elements, and the price above is Gold quoted in US Dollars, which is the common yardstick for measuring the value of Gold across the world.
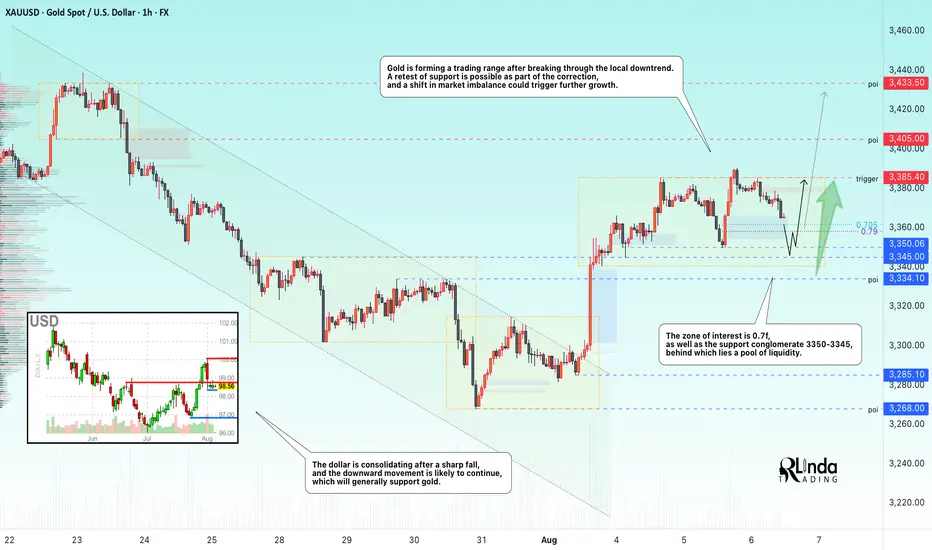
GOLD → Long squeeze of support ahead of possible growthFX:XAUUSD is entering a consolidation phase after a rally. The market is forming a trading range, and a retest of support could end in growth...
Gold pulled back from an 8-day high ($3391) on profit-taking ahead of Trump's Fed appointments. Weak ISM services data (50.1) and a pause in the doll
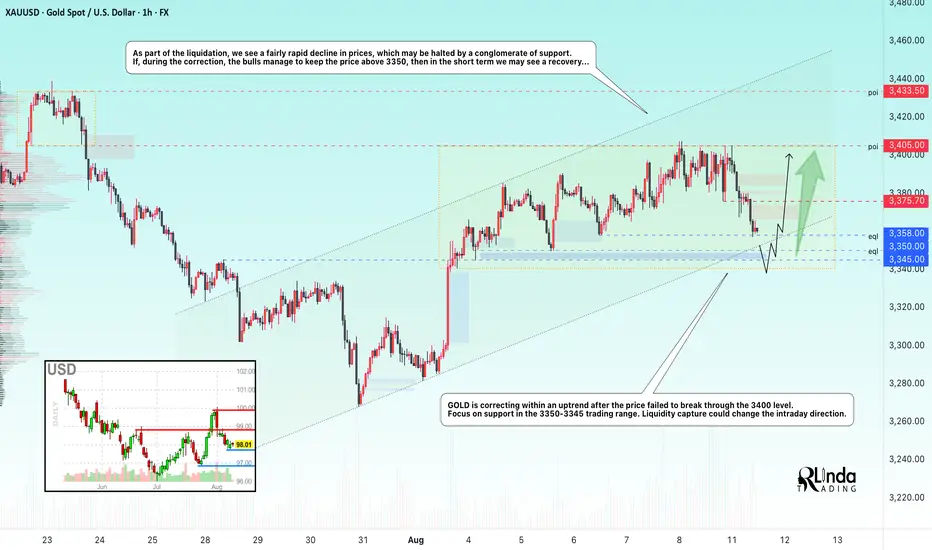
GOLD → Retest of support within an uptrendFX:XAUUSD is forming a liquidation phase as part of the previously mentioned bullish wedge pattern. Bulls were unable to break through the 3400 mark, and due to uncertainty, the price has entered a correction phase...
On Monday, gold fell to $3350, echoing the bearish sentiment in Asian tradin
How to Read COT Data: Understanding Big Players’ Order FlowHey whats up traders, today Im going to reveal my COT approach. If you’re serious about finding higher timeframe bias based on what the big players are doing, then COT data is a tool you need to know. It offers unique insights into the positioning of institutional traders—and if read correctly, it c

XAUUSDHello Traders! 👋
What are your thoughts on GOLD?
Gold remains trapped below the key $3,390–$3,400 resistance zone, which has rejected price multiple times in recent sessions.
A short-term pullback toward the marked support level is likely.
From that zone, we expect buyers to step in, leading to an
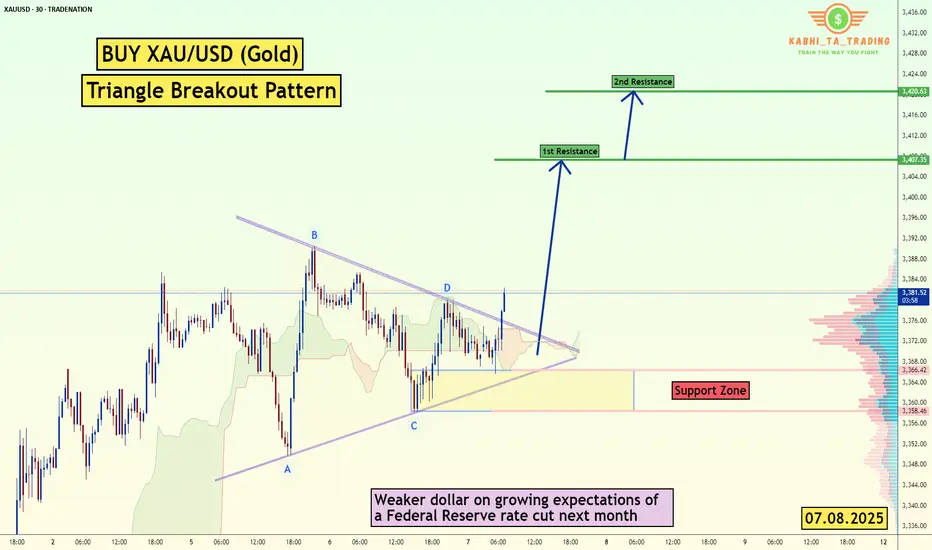
XAU/USD (Gold) Triangle Breakout (07.08.2025)The XAU/USD pair on the M30 timeframe presents a Potential Buying Opportunity due to a recent Formation of a Triangle Breakout Pattern. This suggests a shift in momentum towards the upside and a higher likelihood of further advances in the coming hours.
Possible Long Trade:
Entry: Consider Enteri
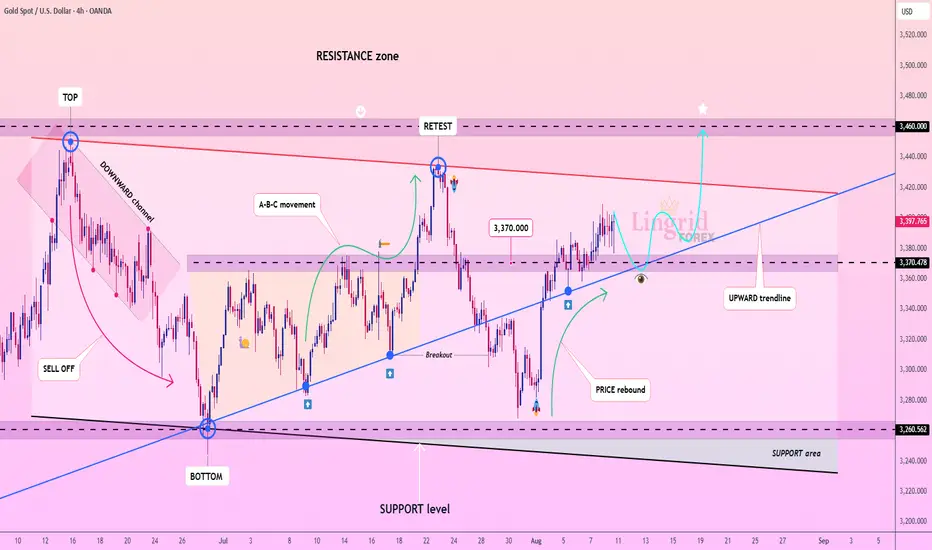
Lingrid | GOLD Weekly Price Outlook: Uptrend AccelerationOANDA:XAUUSD continues attracting significant buying interest as bulls successfully penetrated key resistance levels during the week. The market demonstrates resilience with bulls consistently stepping in during any price declines, suggesting an ongoing upward trajectory ahead.
The 4H timeframe sh
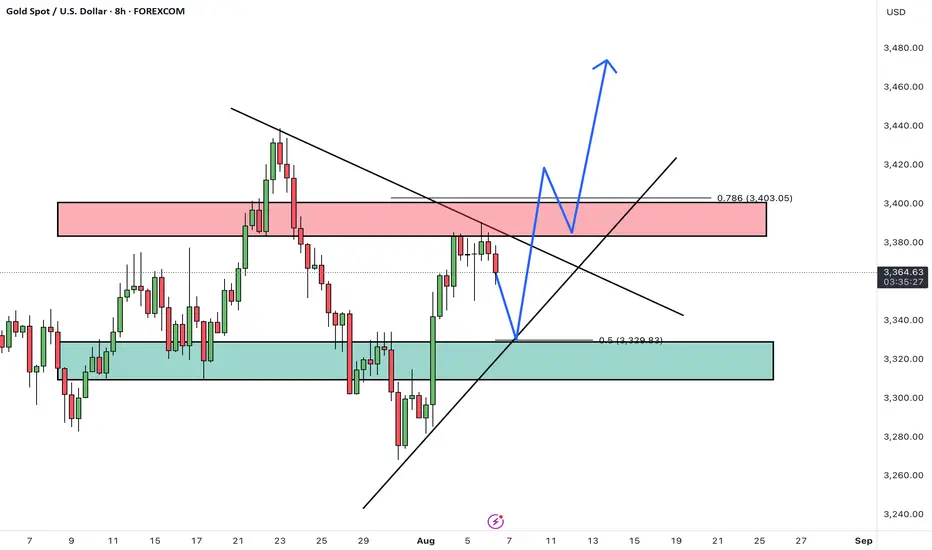
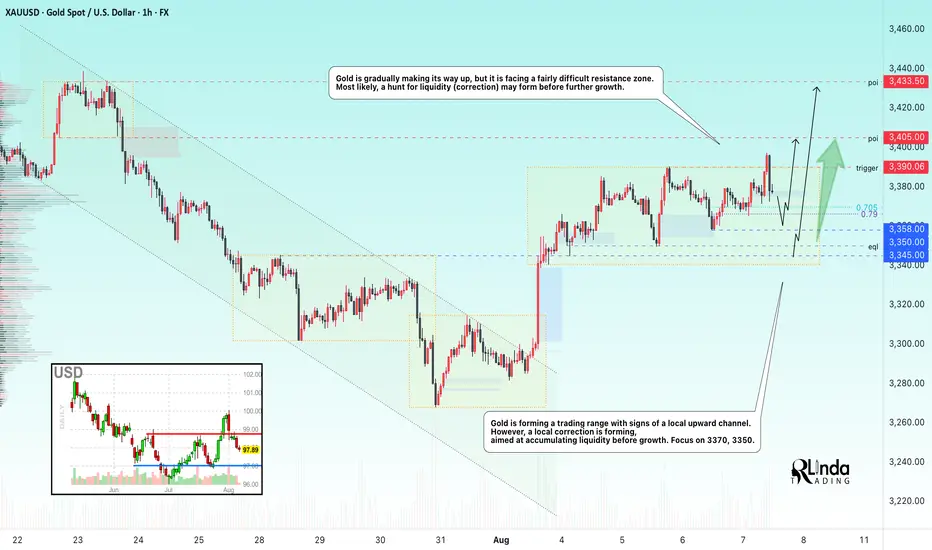
GOLD → Correction before a breakout and rallyFX:XAUUSD is gradually making its way upward, but it faces a fairly difficult resistance zone. Most likely, a long squeeze may form before further growth.
Gold is rising amid uncertainty: Expectations of key US labor market data (unemployment claims, labor costs), the possibility of a Fed rate c
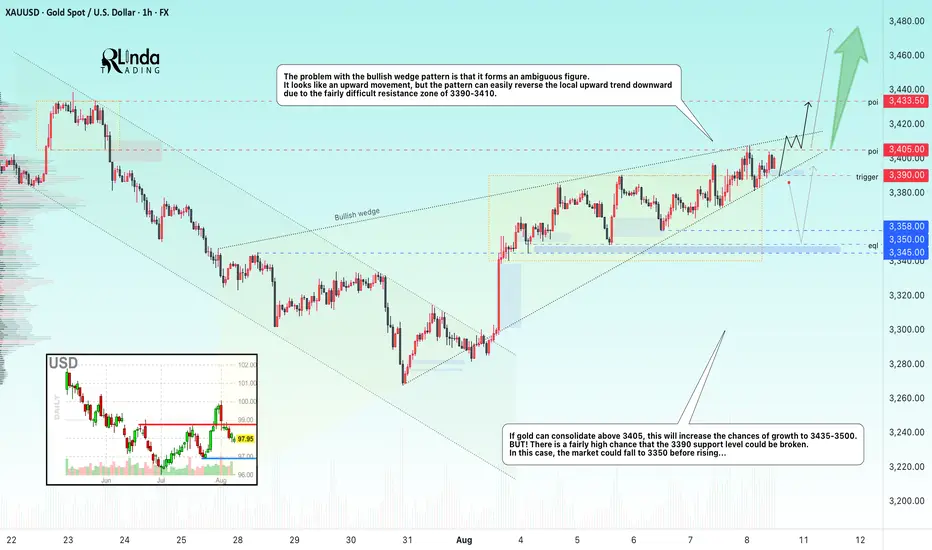
GOLD → A stalemate situation - a bullish wedgeFX:XAUUSD is unable to break through the resistance level of 3400. However, an ambiguous “bullish wedge” pattern is forming on the chart...
The price of gold retreated from a two-week high on profit-taking. The correction intensified after the US imposed tariffs on imports of gold bars (1 kg),
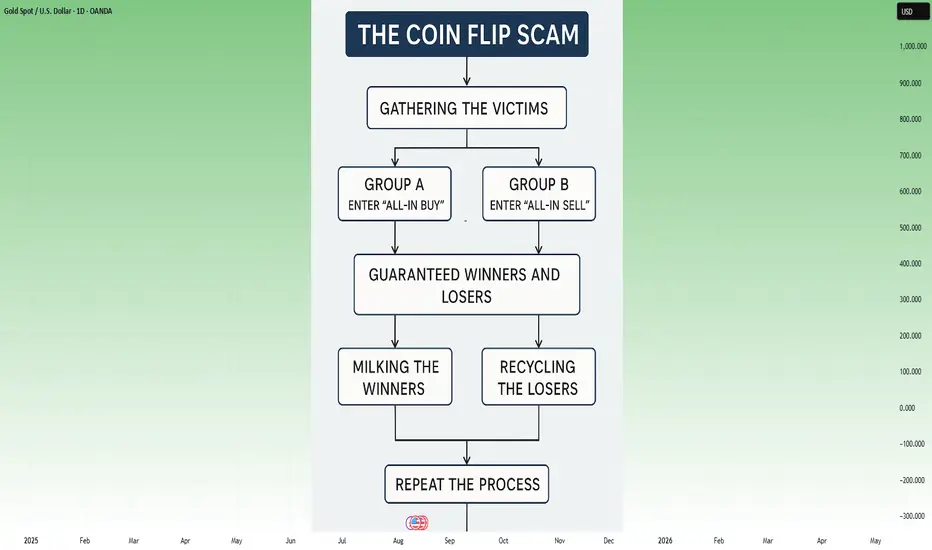
The 50/50 Account Management Scam- How it WorksFrom Cold Calling to Telegram
I’ve been in the markets for so long I feel like a dinosaur, and I’ve probably seen every scam out there.
The truth is, none of them are really new — they’re just adapted to the new social paradigm.
What was done in the 2000s through cold calling is now done through T
See all ideas
Summarizing what the indicators are suggesting.
Oscillators
Neutral
SellBuy
Strong sellStrong buy
Strong sellSellNeutralBuyStrong buy
Oscillators
Neutral
SellBuy
Strong sellStrong buy
Strong sellSellNeutralBuyStrong buy
Summary
Neutral
SellBuy
Strong sellStrong buy
Strong sellSellNeutralBuyStrong buy
Summary
Neutral
SellBuy
Strong sellStrong buy
Strong sellSellNeutralBuyStrong buy
Summary
Neutral
SellBuy
Strong sellStrong buy
Strong sellSellNeutralBuyStrong buy
Moving Averages
Neutral
SellBuy
Strong sellStrong buy
Strong sellSellNeutralBuyStrong buy
Moving Averages
Neutral
SellBuy
Strong sellStrong buy
Strong sellSellNeutralBuyStrong buy
Displays a symbol's price movements over previous years to identify recurring trends.