Natural Gas plummets - Israel and Iran PeaceIran and Israel de escalation is causing nat gas to plummet.
Fear of the "Hormuz Strait" closing have slipped away!
Roughly 20% of global liquefied natural gas (LNG) trade flows through the Strait of Hormuz, primarily from Qatar (~9.3 Bcf/d) with smaller volumes from the UAE (~0.7 Bcf/d)
In 2024

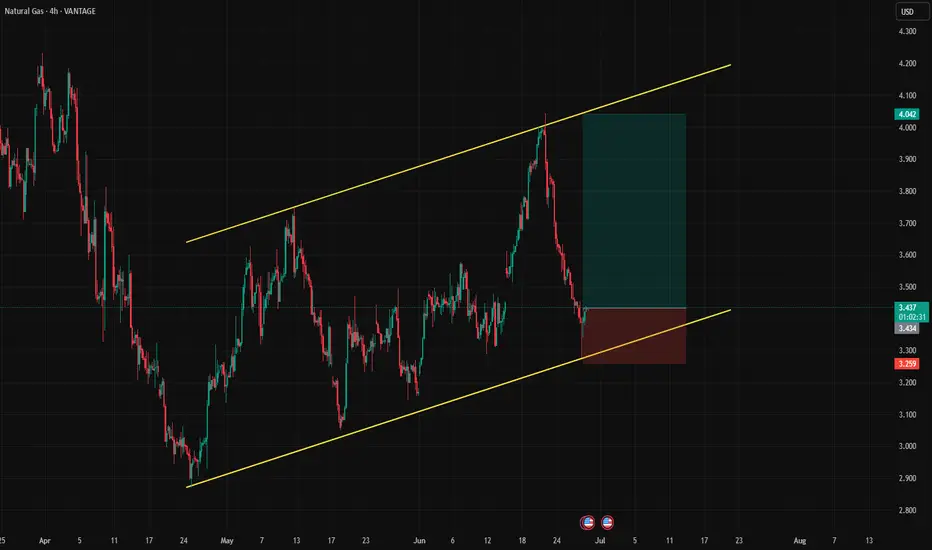
Natural Gas Long baby!Price showed rejection with reversal signal on lower channel. I am gonna buy this and project this to higher high formation. Cheers
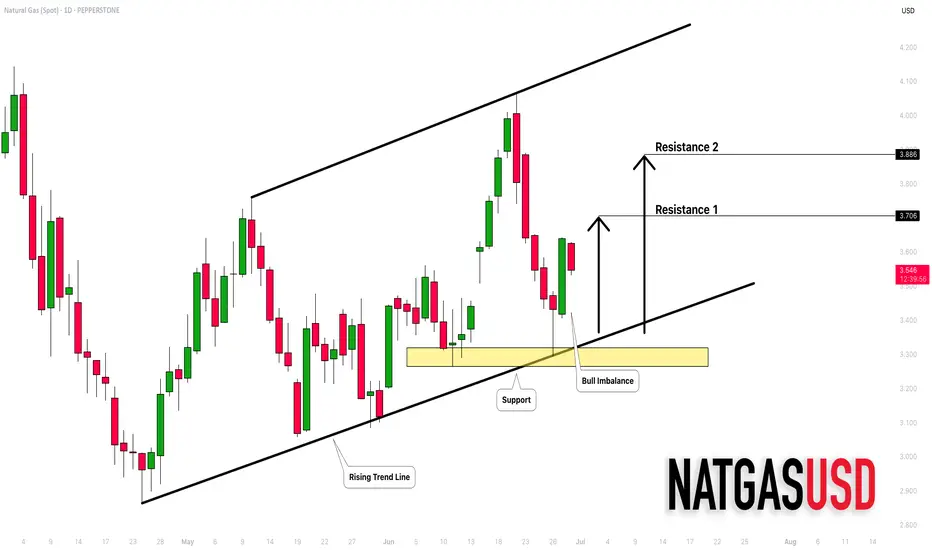
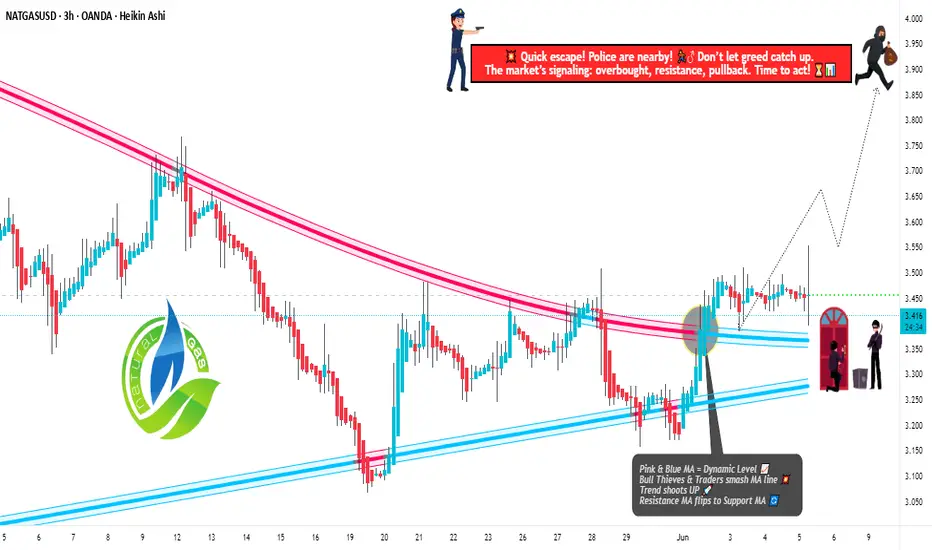
NATURAL GAS (NATGASUSD): Bullish Outlook Explained
Natural Gas is trading in a mid-term bullish trend on a daily.
The price updates higher highs and higher lows after each
test of a rising support line.
Its last test made the market form a strong rejection first
and a bullish engulfing candle then.
The market may continue growing and reach at l
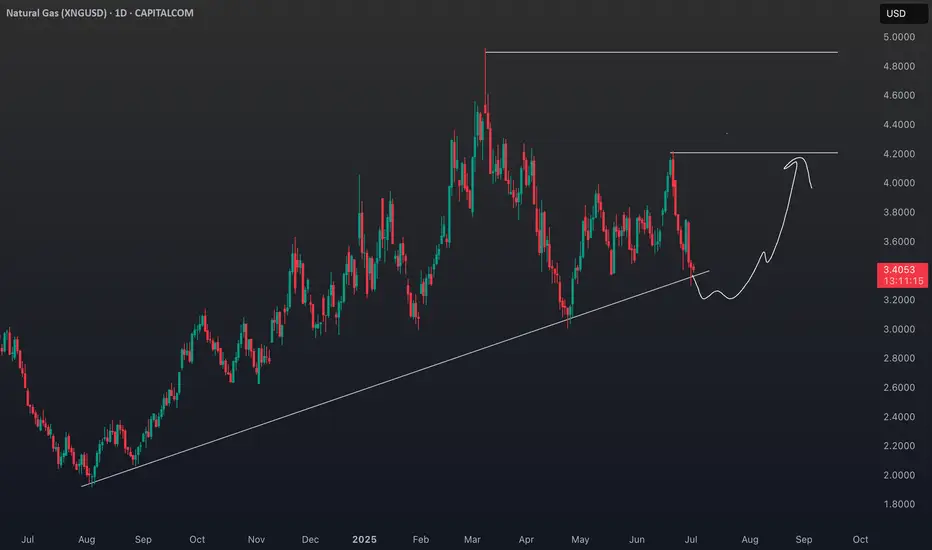
LNG Bull Market: How Geopolitics and Demand Are Fueling XNG🔥 The Natural Gas market presents a compelling risk/reward opportunity with strong fundamental support from ⚖️ supply/demand imbalances and 🌍 geopolitical factors. The technical chart shows a healthy 📊 consolidation after the explosive 🚀 February–March rally, with the potential for another leg highe
Natural Gas is in the Buying DirectionHello Traders
In This Chart NATGAS HOURLY Forex Forecast By FOREX PLANET
today NATGAS analysis 👆
🟢This Chart includes_ (NATGAS market update)
🟢What is The Next Opportunity on NATGAS Market
🟢how to Enter to the Valid Entry With Assurance Profit
This CHART is For Trader's that Want to Improve Their Te
XNG/USD Market Swipe: Bullish Breakout Blueprint!🌟 Natural Gas Heist: XNG/USD Bullish Breakout Plan 🌟
Hey Money Snatchers & Market Raiders! 🤑💸
Ready to pull off a slick heist on the XNG/USD "Natural Gas" Energy Market? 🔥 Using our slick Thief Trading Style (technical + fundamental analysis), here’s the plan to grab the bullish loot and dodge the
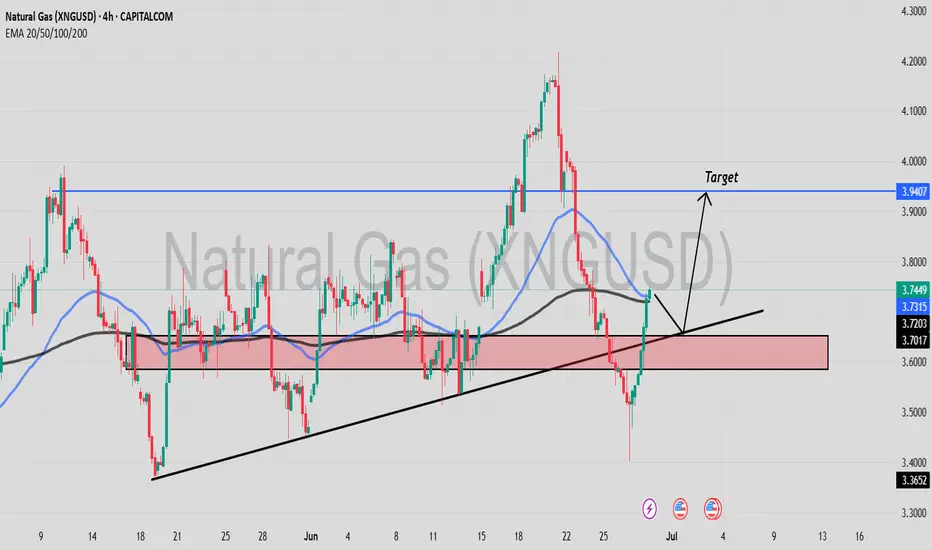
XNGUSD Technical Update – What the Chart Is Telling Us NowIn this video, I break down the current XNGUSD (Natural Gas) chart using pure price action analysis on the daily timeframe.
This update builds on my previous post, where I shared a comprehensive outlook supported by fundamentals, including supply/demand imbalances, geopolitical risks, and long-term

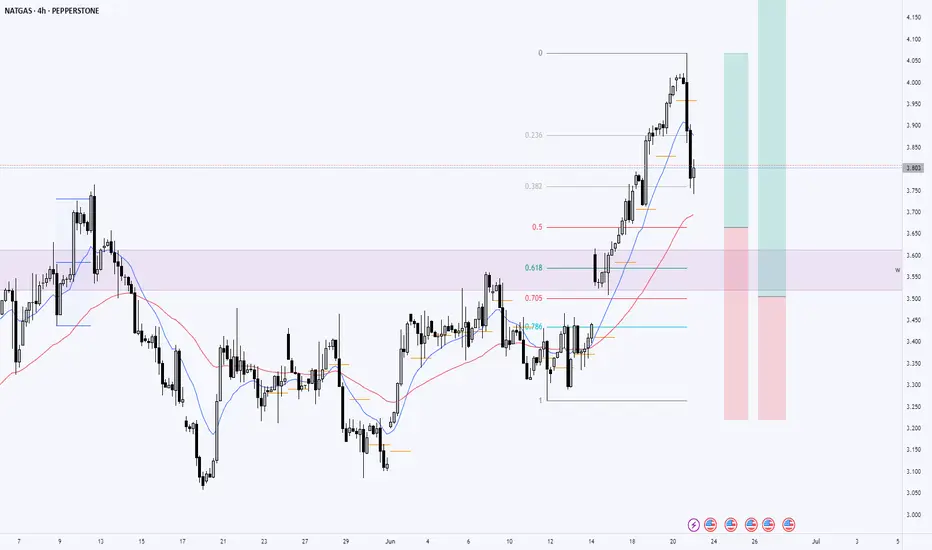
Natural Gas Buy Setup – Multi-Timeframe Bullish Confluence🔥 Weekly Overview:
Price has just rejected the weekly EMA after forming a strong rejection candle. This signals potential support at the dynamic level and hints at a bullish shift. Buyers are likely stepping in from this zone.
📅 Daily Chart Explanation:
On the daily timeframe, price has broken i
NATURAL GAS Natural gas prices have pulled back from a 2½-month high due to forecasts of normalizing summer temperatures in the U.S., which could reduce cooling demand and electricity generation needs.
Demand Drivers:
U.S. LNG exports are ramping up, supporting demand and prices. LNG export facilities like Pla

NATURAL GAS XNGUSDCorrelations: Natural Gas, Bond Yields (US10Y), DXY, and Seasonal Patterns
1. Natural Gas and 10-Year Treasury Yield (US10Y)
Positive Correlation: Natural gas prices and the 10-year Treasury yield tend to move in tandem, driven by shared macroeconomic forces like inflation expectations and growth ou

See all ideas
Displays a symbol's price movements over previous years to identify recurring trends.