XRP Critical Levels to Play This MonthHello I am the Cafe Trader.
This weekend we are shifting focus into the crypto market for a quick overview. If you read my last XRP article, we nailed the bottom for longs, and the sellers for a great positional play. This time we are going to analyze the current failed breakout.
Are Bulls Trapped? Does this still have room to leg up?
Point 1
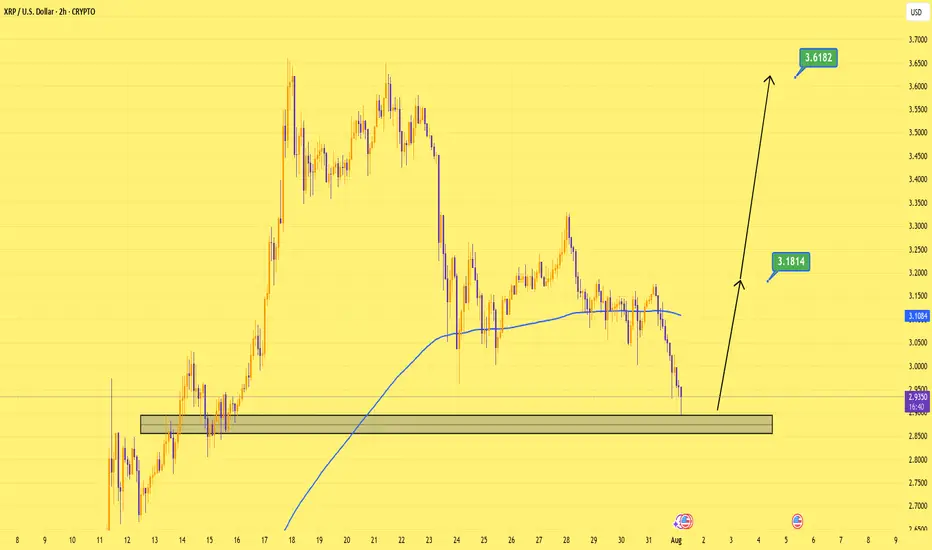
We can start with the trend break. Massive buyers pushed this move higher, giving XRP a relatively quick All time high, But July 23rd shorts were able to shove this back inside of the previous high.
This signifies that there are bulls trapped, but the interesting thing to note is that the volume has reduced significantly since the last two ATH's. So this also would indicate a lack of buying interest at the highs.
Buyers are just not willing to to get involved with the same conviction as before (yet). No buyers, no continuation (even if there is not many sellers/profit takers).
Point 2
Strong buyers proved their interest with a "hot" reaction at $2.95.
With no "real" seller coming into this market yet, there is nothing stopping this continuation from legging up (so far).
Therefore I stand bullish, and am looking for a move up to $4.64 as a Target.
Point 3
Buying into this can feel tricky, your first entry for a classic two bar trend break would've been at the top of demand. I do think we will get another opportunity here, I definitely would not chase this, because it could play this range for a while before another leg up.
Setup
Trend break continuation.
Entry 3.13
Stop 2.65
Exit TP 4.64
Risk to Reward 3.1
If there is a close below these strong buyers, this could com all the way back down to 2.15-2.3 at least.
The reason for the wider stop here is because we don't want to get swept and then ran. A more conservative stop could be $2.85 which would be a 6R trade. Take your pick
Long Term
If you are late to the party on XRP (I know many are) here are some entries according to your sentiment:
Almost FOMO = 3.13
Aggressive = 2.95
Good price = 2.15-2.3
Steal = 1.60 - 1.93
That's all for XRP. We are going to be looking at Ethereum ETH Next.
Thanks for reading and happy trading!
@thecafetrader
XRPUSD trade ideas

Xrp - It all comes down to this!🚀Xrp ( CRYPTO:XRPUSD ) has to break structure:
🔎Analysis summary:
After Xrp created the previous all time high in 2018, we have been seeing a consolidation ever since. With the recent all time high retest however, Xrp is clearly showing some considerable strength. It all comes down to bulls being able to push price higher, above the massive horizontal structure.
📝Levels to watch:
$3.0
SwingTraderPhil
SwingTrading.Simplified. | Investing.Simplified. | #LONGTERMVISION

XRP Path to 200XRP is so bullish.
Based on FIBS and Camarillas, this is a realistic path for the next 6 months to a year.
Gl hf.
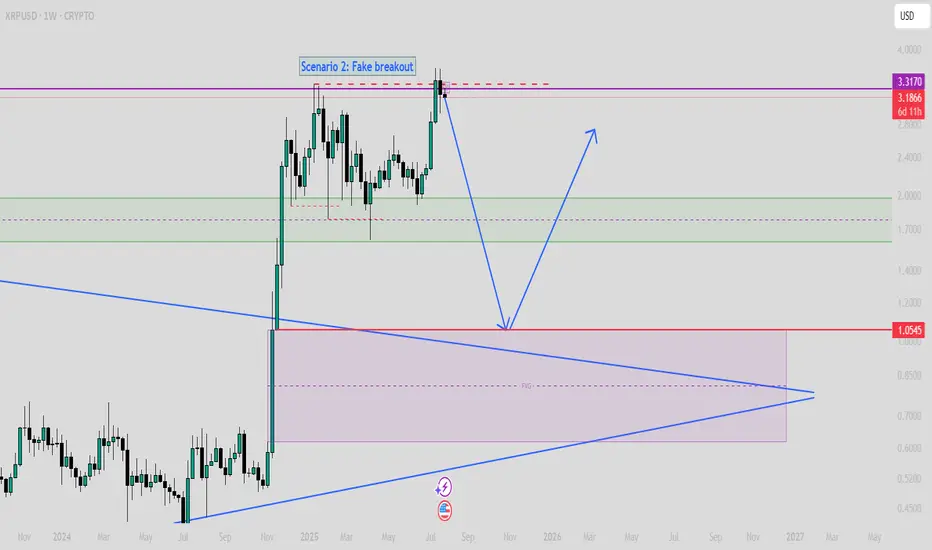
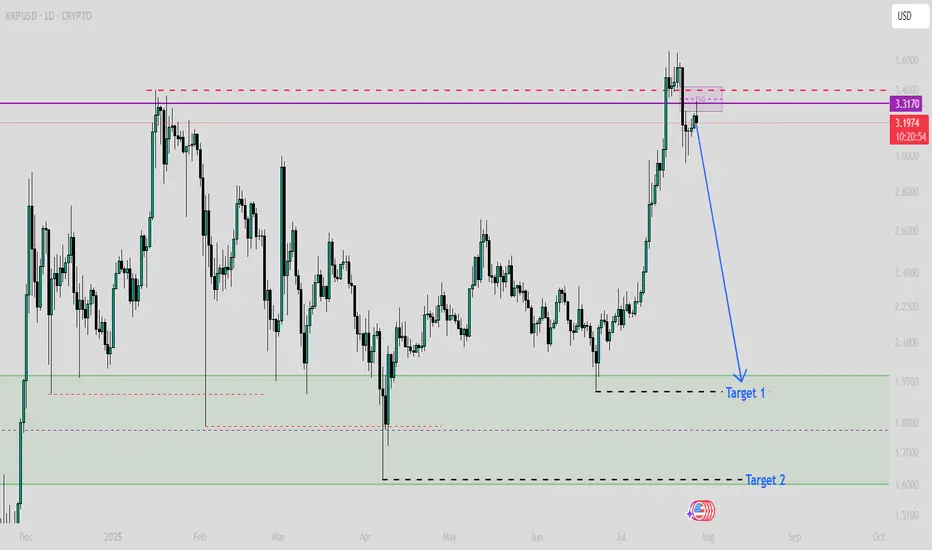
$XRP SCENARIO 2: Fake Breakout (Read caption)If XRP can't close strongly upper than $3.5 on the weekly time frame, then we must consider this scenario!
In this scenario, the first target will be $1.6, and then, based on time, even value around $1 is achievable.
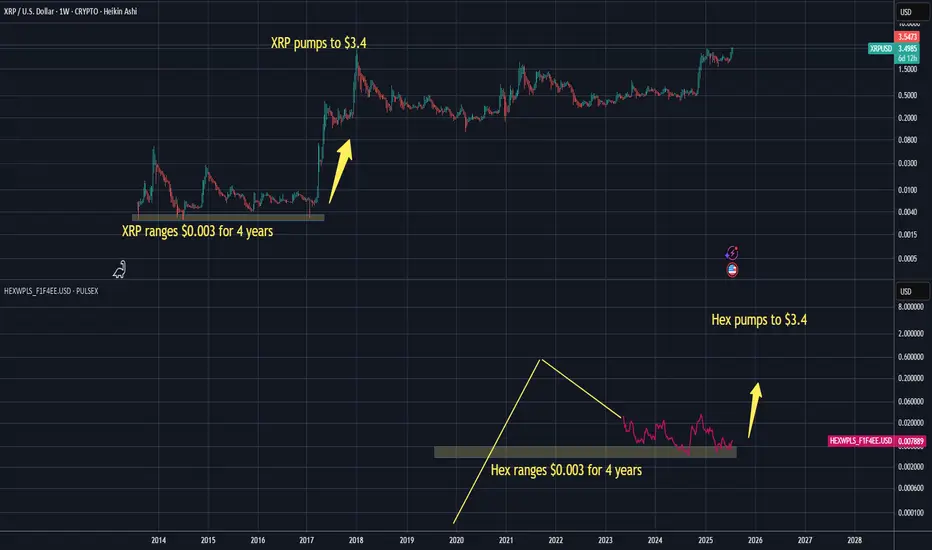
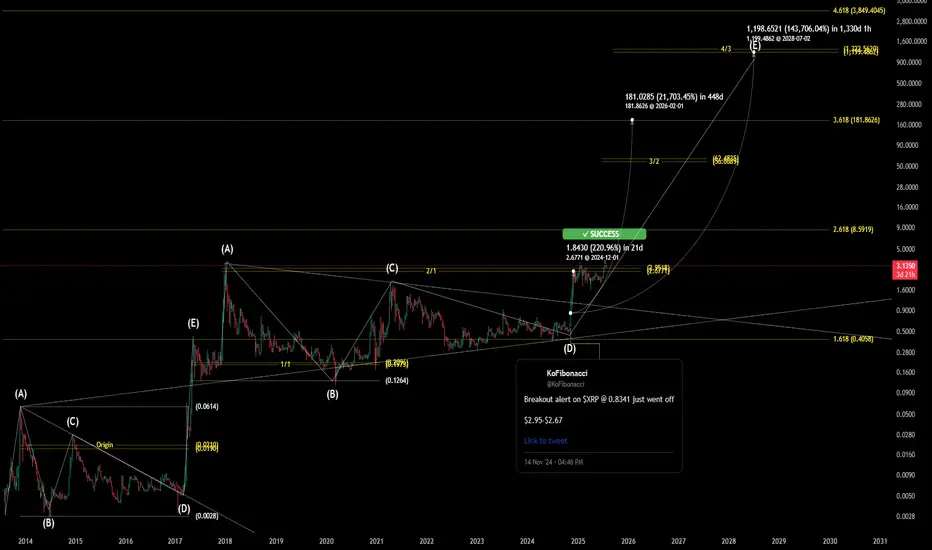
Hex on PulseChain mirrors XRP over time, $0.003 -> $3.40 (5yrs)Attention Poverty Investors 💀
While you were crying about your Hex bags at $0.003, XRP holders were getting absolutely REKT for 4-5 years straight. "Dead project!" they laughed. Then those same clowns FOMO'd in at $3 when XRP went nuclear in 2017.
1,133x gains for the psychopaths who didn't paperhand like little babies.
Now HEX sits at the EXACT same $0.003 graveyard for 5 years. Same high supply. Same "ngmi" energy. Same braindead price action that makes moonboys rage quit.
But here's the thing, anon: Alt-season is coming and history doesn't give a %$@! about your feelings. When high supply coins pump, they pump VIOLENTLY. Ask the XRP OGs who went from eating ramen to driving Lambos.
Translation for smoothbrains:
HEX at $0.003 for 5 years = XRP at $0.003 for 5 years.
If you can't see the pattern, stay poor.
$3.40 HEX incoming? Maybe. Maybe not. But if you're not at least considering it, you're ngmi.
This is not financial advice, it's a reality check for all you $0.003 stablecoin holders 🤡
WAGMI or cope forever. Your choice.
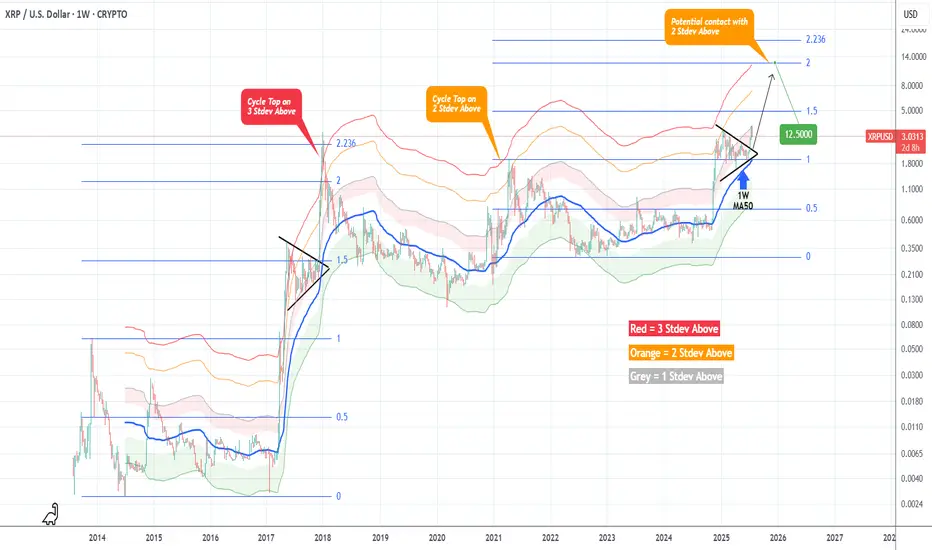
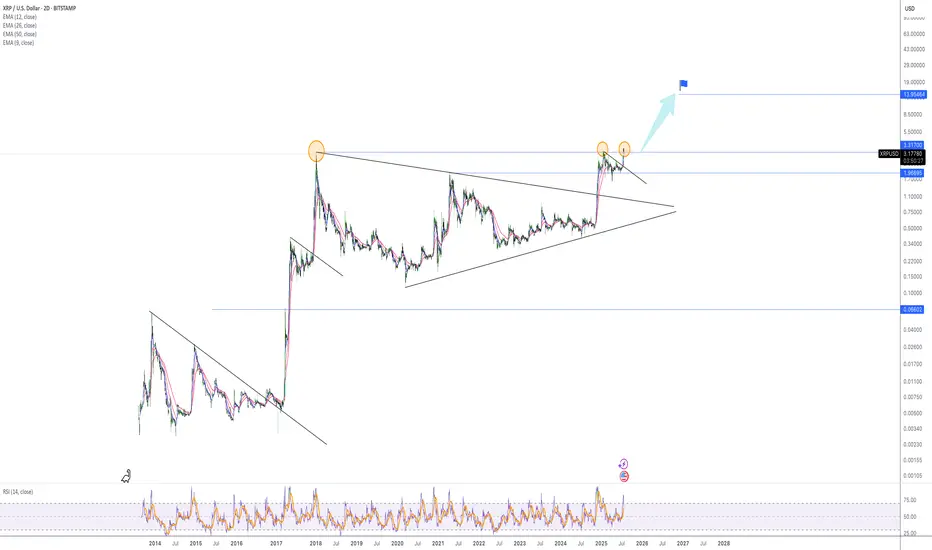
XRPUSD Massive break-out that can Top at $12.500XRP (XRPUSD) got out of its Accumulation Triangle (December 2024 - June 2025) making an aggressive break-out similar to the December 2017 one, which was after an identical Triangle pattern.
The fractals are so comparable that both mostly traded within the 1W MA50 (blue trend-line) and the Mayer Multiple (MM) 2 Stdev Above (orang trend-line).
As you can see, that MM trend-line was where the Top of the previous Cycle (April 2021) was priced and the one before was above the 3 Stdev Above (red trend-line).
Assuming that this Cycle will also go for the 'minimum' 2 Stdev Above test, it can make that contact by the end of the year on the 2.0 Fibonacci extension (Cycle Top-to-bottom) at $12.500.
-------------------------------------------------------------------------------
** Please LIKE 👍, FOLLOW ✅, SHARE 🙌 and COMMENT ✍ if you enjoy this idea! Also share your ideas and charts in the comments section below! This is best way to keep it relevant, support us, keep the content here free and allow the idea to reach as many people as possible. **
-------------------------------------------------------------------------------
💸💸💸💸💸💸
👇 👇 👇 👇 👇 👇
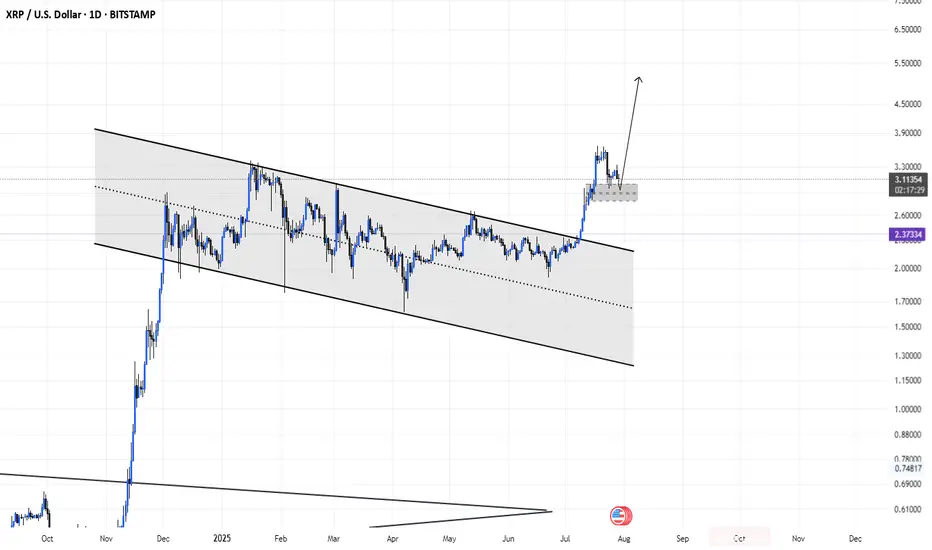
XRPUSD 4 Hour BottomXRP has broken out of the weekly wedge leaving a long weekly candle stick close. Price has pulled back indicating it it ready for the next leg higher. Daily candle closed bullish and 4 hour time from has double bottom.

XRP WHERE ARE WE HEADED ? LEVELS TO LOOKOUT FORHey trading fam
So XRP is a fun one but based on BTC correcting and what we are seeing there are a couple thesis's that we currently have for it
Thesis 1: We break south from 2.98 lows: Levels to look out for:
2.80
2.70
2.68
Thesis 2: We break the highs of 3.29: Levels to look out for:
3.65
3.79
3.99
Trade Smarter Live Better
Kris

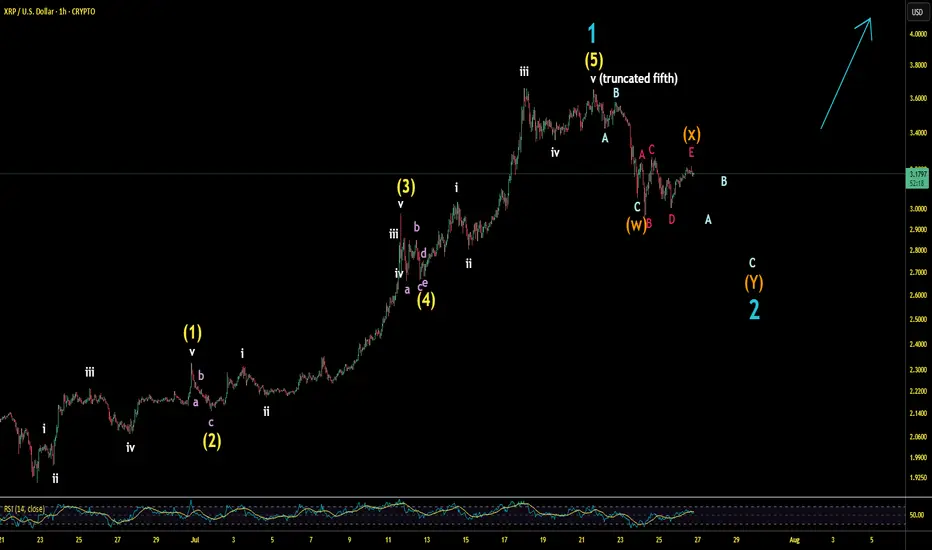
XRP: Double zigzag correction scenario for Jun/July 2025 impulseA possible double zigzag pullback scenario correcting June & July's impulsive breakout, upon which normies & bears might say "head & shoulders" but then it climbs the wall of worry for a massive Wave 3 parabola.
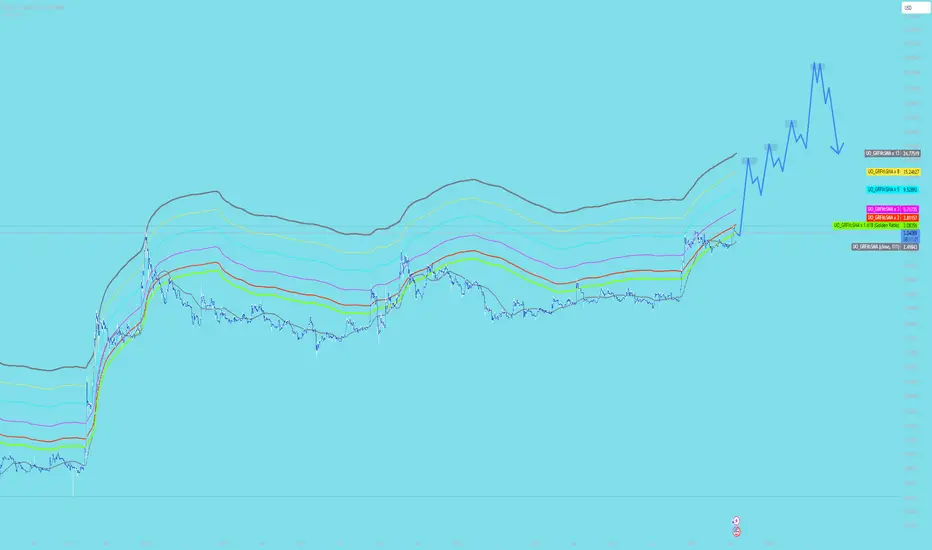
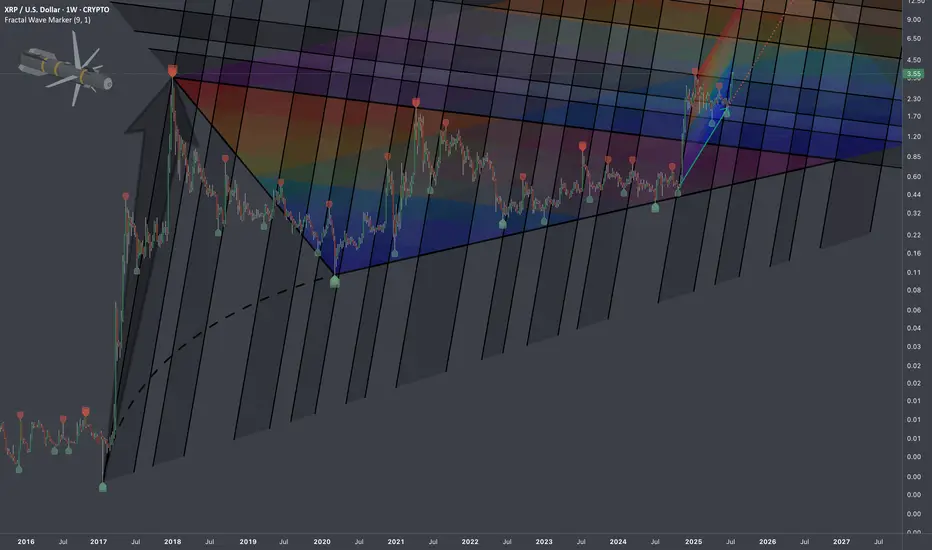
$XRP Historical Golden Ratio - Weekly Timeframe The Historical Golden Ratio (HGR) is the Fibonacci-based market analysis methodology that I created in 2020 (but really discovered). It identifies critical price inflection points by applying Fibonacci in a very unique and fundamental way. It may appear complex from the outside to new and even experienced technical analysis, but under the hood is a very simple and logically built engine that only has two critical parts really. However, it reveals an underlying structure within markets that appears to be fractal-based and dictated by the Golden Ratio. For the experienced market participant, time behind the wheel will reveal that the driving force behind markets has been in plain sight all along; M = φ * H(t) * e^(k * I(t))
Super bullish!! (I am not a XRP fan, but still) XRP is one of those cryptocurrencies that attract cult-like followers. I am not one of them.
Fundamentally I have no idea about the long term potential of XRP. HOWEVER, purely based on technicaly analysis, it looks very bullish to me.
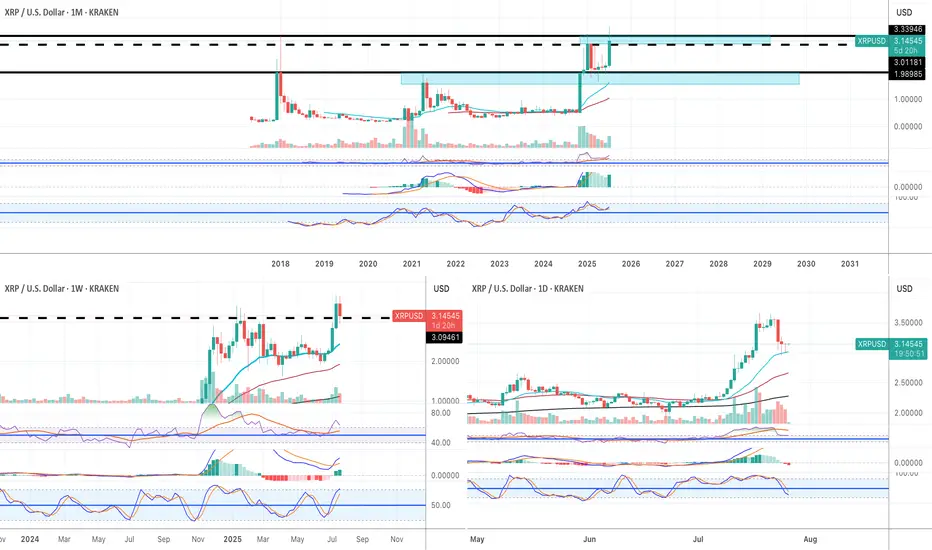
Monthly:
1) the price finally broke above the 2018 historical ATH.
2) All momentum indicators in the bull zone.
3) Both RSI and MACD are in the overbought territory but they can remain in the OB territory for weeks and weeks when the macro bull trend begins.
4) Stochastic lines have crossed to the upside in the bull zone.
Weekly:
1) all momentum indicators are in the bull zone.
2) The price broke above the historical ATH. It is going through pull back now, but, there is a strong buying pressure around $3.15.
Daily:
1) all momentum indicators have reached the overbought territory. The lines are now rolled to the downside, however, it is likely to be a corrective move.
2) the price is hovering above EMA21 where the recent price breakout happened on Thurs 17th July. I have been monitoring price action in lower time frames such as 5 and 15 minutes, and it looks like the price does not want to go below the previous historical high at this stage.
I am not very familiar with XRP, but purely based on the current price action, it looks very bullish. For the very first time as a trader/investor, I deployed my capital to buy XRP last Wed (just under $3.00).
I have already took some profit when it hit $3.60. But I am planning to sell 90% of my XRP when it reaches $4.50 and $5.00, and let the rest run just in case it goes to the moon😅.
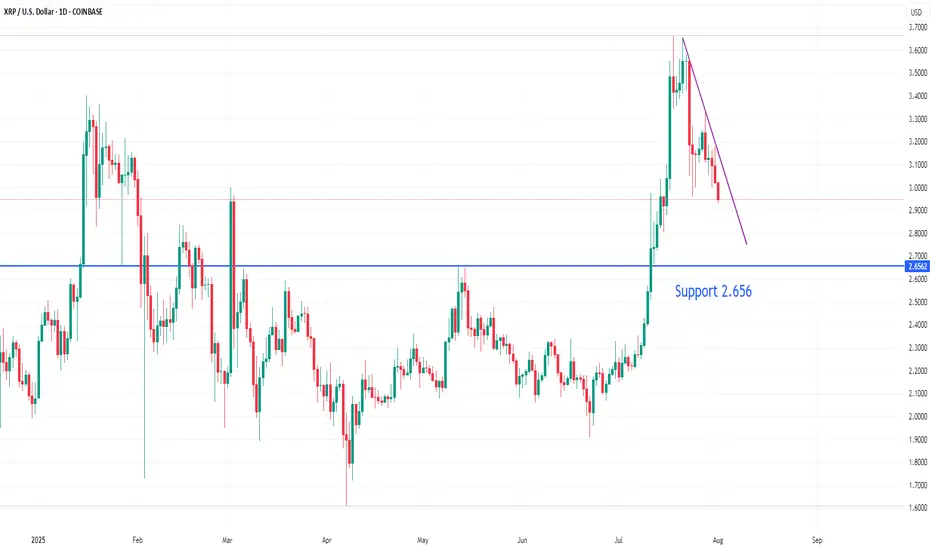
XRPUSD downside target 2.656On the daily chart, XRPUSD has retreated from its highs, with short-term bears dominating. Currently, the price is in a downward trend, so shorting near the downtrend line resistance is recommended, with a target around 2.656.
XRP - history repeating?Hello.
I'm going to walk you through what happened in the early years of XRP p.a. and how this fractal might play out today.
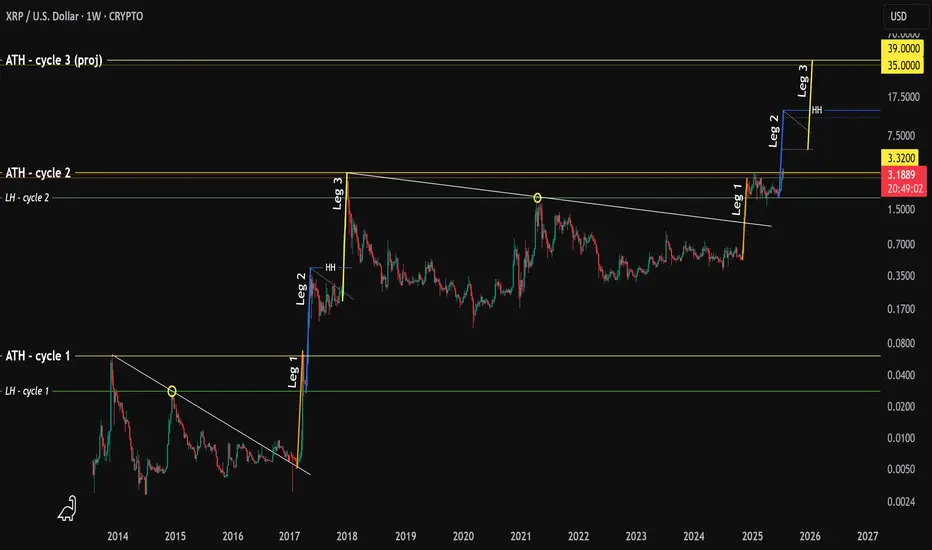
Here's what happened.
1. A high was printed in 2013 (ATH)
2. Followed by a lower high (LH)
3. XRP broke out of a downtrend 📈
4. In 2017 price increased 1,280% finding resistance @ ATH (we'll call this "Leg 1")
5. The LH then acted as support, followed by sideways price movement
6. Price increased 1,460% creating a higher-high (or "HH") which surpassed the ATH and this is "Leg 2"
7. Again, sideways price movement.
8. An increase of 1,560% creating a new ATH Dec 2017 - "Leg 3"
What's interesting here is that each leg takes 5 weeks to play out (that's 5 green weekly candles to put a finer point on it).
Fast forward in time - what do we see?
A high..
A lower high....
A breakout of the downtrend..
Followed by..... you guessed it... 5 green weekly candles
Hold on...
A rejection at the ATH
The LH acting as support...
With sideways movement .. 👀
The symmetry is quite profound and provides us with an idea of what will happen next.
If we consider the move in Nov 2024 as "Leg 1" then one could argue that "Leg 2" is currently in play.
Leg 1 was not as significant as the uplift we saw in 2017 (480% vs 1,280%)
However, if we assume that the variance between Leg 1 and Leg 2 rhymes then the projected uplift from the LH would be 550%.. making XRP price roughly $11-13
It follows that price will then move sideways/consolidate/capitulate for several months.
Followed by one last move to the upside which, using the variance between Leg 2 and Leg 3 put the final leg @ 585% or $35-39.
Wild guess but based on historical Bitcoin halving peaks and XRP ATH in both cycle 1 and 2 landed at the back end of Q4, it is assumed the same could happen (put simply: the end of 2025).
You're welcome.
Xrp - The final bullish breakout!💰Xrp ( CRYPTO:XRPUSD ) will create new all time highs:
🔎Analysis summary:
After a consolidation of an incredible seven years, Xrp is finally about to create new all time highs. With this monthly candle of +40%, bulls are totally taking over control, which means that an altcoin season is likely to happen. And the major winner will simply be our lovely coin of Xrp.
📝Levels to watch:
$3.0
🙏🏻#LONGTERMVISION
SwingTraderPhil

Xrp - This is the bullrun breakout!🔑Xrp ( CRYPTO:XRPUSD ) breaks the triangle now:
🔎Analysis summary:
After the recent bullish break and retest, Xrp managed to already rally another +100%. This is a clear indication that bulls are still totally in control of cryptos and especially Xrp. It all just comes down to the all time breakout, which will then lead to a final parabolic rally.
📝Levels to watch:
$3.0
SwingTraderPhil
SwingTrading.Simplified. | Investing.Simplified. | #LONGTERMVISION

XRPUSD - Target reached. Reversal on the plateSo, that was a nice long trade.
Now price is stretched at the Upper Medianline Parallel (U-MLH).
As of the time of writing, I already see price pulling back into the Fork. A open and close within the Fork would indicate a potential push to the south.
Target would be the Centerline, as it is the level where natural Meanreversion is.
Observation Hat ON! §8-)

XRP/usd.tXRP is in a sweet zone at the moment to reverse and go higher. We are seeing a healthy retrace. Buckle up and enjoy the ride!
Relax and watch the show - target = 13 dollarDear,
In a bull market it is normal to see a 10, 20% pullback before the next impulsive wave.
It is a normal level for XRP to reject for now because we came near the ATH.
With the next test of ATH i believe we will move fast trough it.
My personal target for this bull run is 13 dollar. It can go higher but i believe the market will be overbought.
Currently the RSI levels are cooling of, the 1H and 4H oversold so i believe we will reverse soon.
Take care.
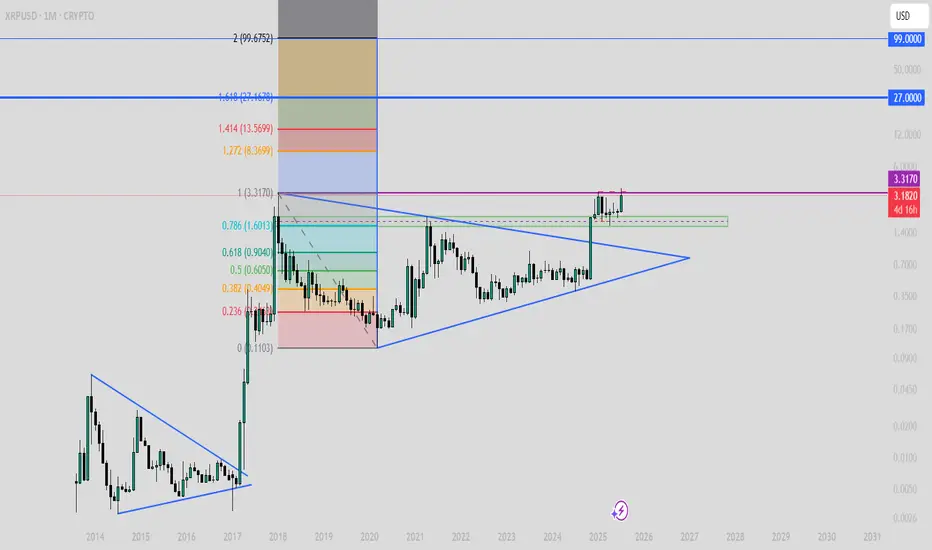
$XRPUSD: Limits of Expansion🏛️ Research Notes
Documenting interconnections where historic area and coordinates of formations are used to express geometry of ongoing cycle.
If we scale out the chart back starting from roughly 2016, we can see more pretext like how the price was wired before decisive breakout from triangle.
Integrating fib channel to the angle of growth phase of the previous super-cycle, so that frequency of reversals match structural narrative.
$XRP on Daily TF is not bullish!! (Read Caption)Need a Strong Weekly breakout candle to invalidate this scenario!
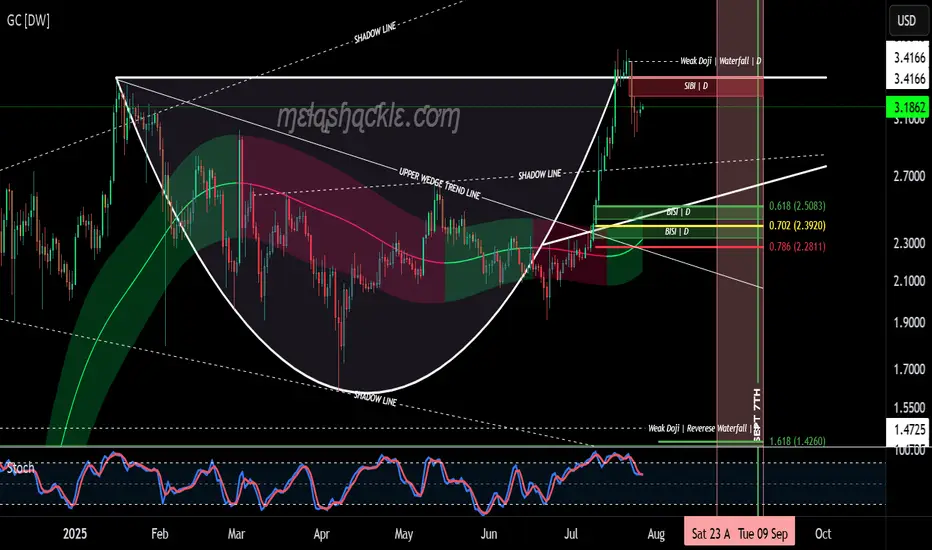
XRP Cup & Handle Pattern on the Daily Chart.XRP is now forming the handle on a very nice cup-and-handle pattern on the daily chart, starting at the previous all-time high set on January 16th, 2025.
But this pattern isn’t all sunshine and rainbows. The price of XRP could drop down into the $2.50 range—toward the bullish fair value gaps I’ve outlined at the bottom of the handle—before making any credible gains or a major breakout to higher levels.
I do believe we’ll see much higher prices in XRP in the coming years as we continue moving into the new global digital financial system. However, for this pattern to fully play out, there will likely be some pain before the pleasure.
I’d keep a close eye on the pink area marked on the charts—spanning from August 23rd through September 8th—as a potential zone for bearish price action.
Luckily for me, my XRP bags have been filled since before the Trump election pump, so I don’t personally need to buy more—unless I see a clear buying opportunity.
Good luck, everyone!
XRP at $2.93? They Forgot What’s Coming?XRP isn’t just another coin. With clarity coming from major rulings, its return to previous highs isn’t just possible it’s probable. I like this level. Watching price and fundamentals line up.
I’m not just looking at the chart — I’m looking at the bigger picture.