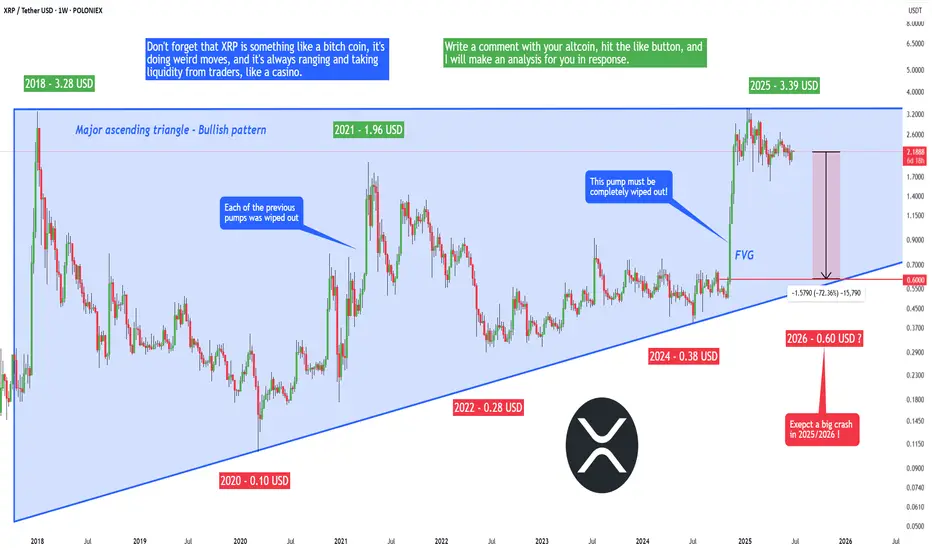
XRP Army - prepare for a 72% crash to 0.6 USD! (lifetime chance)The current price of XRP is 2.19 USD, and I predict a big crash in 2025/2026 to 0.6 USD. Yes, I know you may think that that's completely impossible, especially if you are high on your XRP holdings, but I can assure you that this is going to happen! What can you do?
If you are a hodler, then you
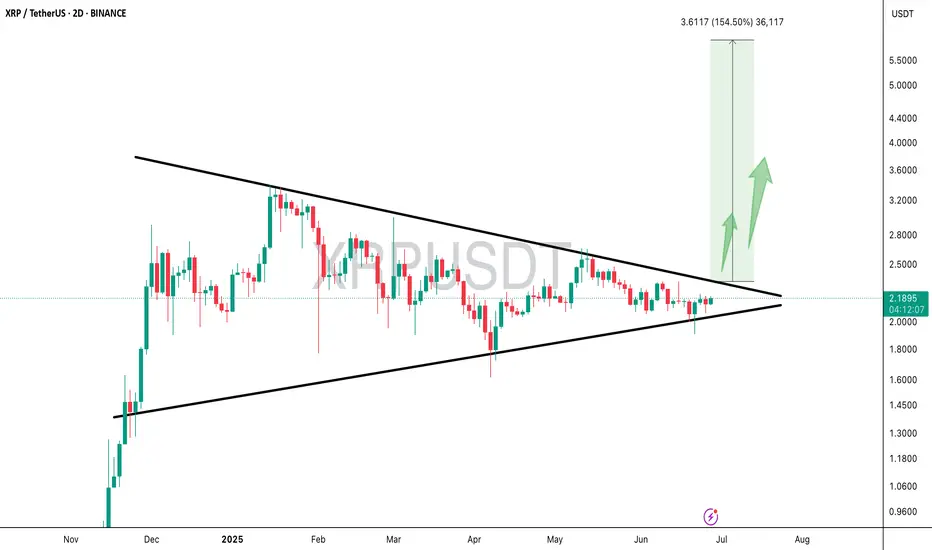
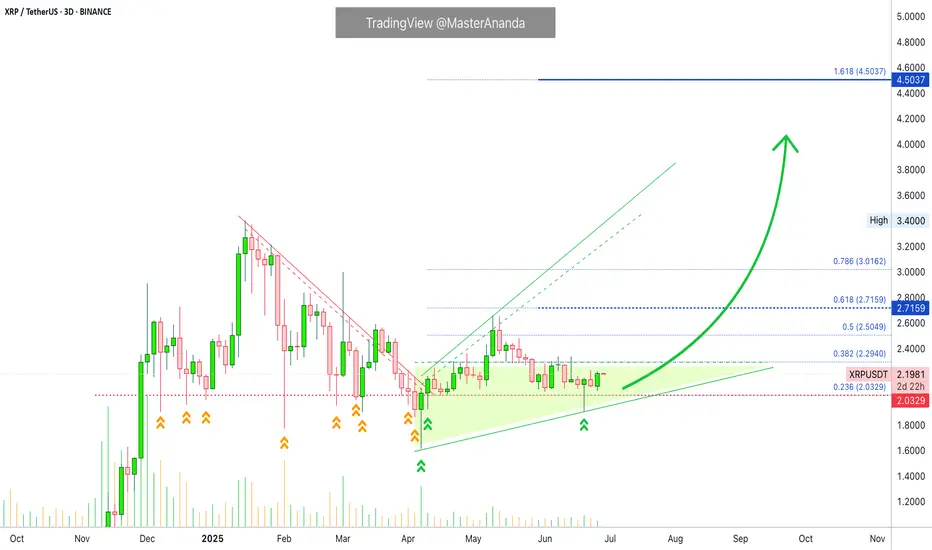
Breakout loading on $XRPBreakout loading on CRYPTOCAP:XRP 🚀
Accumulating heavily here as the price coils inside a massive triangle.
Q3 could be explosive, chart points to a breakout toward $4.60
Retweet if you're BULLISH !!
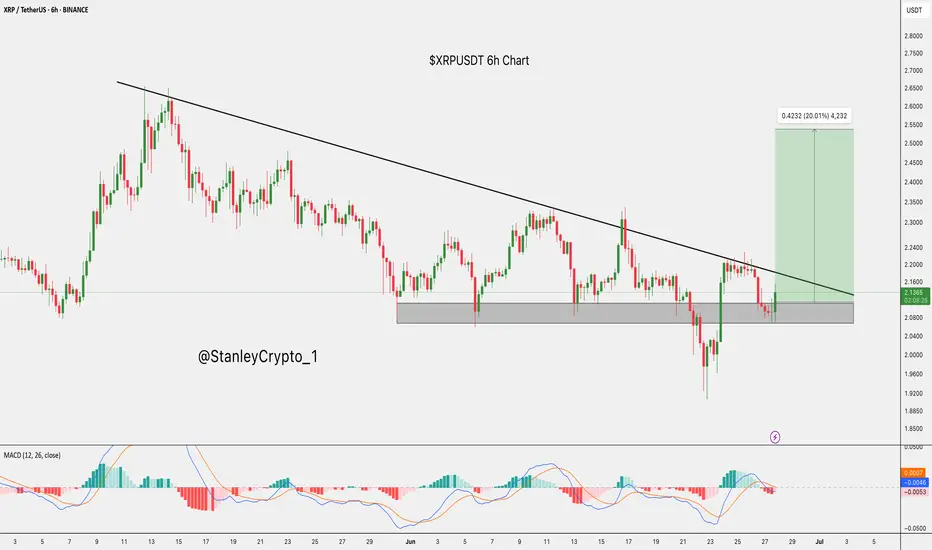
$XRP Breakout Loading: 20% Rally on the Horizon?CRYPTOCAP:XRP is showing strength after bouncing from a key support zone.
Price is pushing toward the descending trendline, and a breakout above it could trigger a 20% move toward $2.5376.
MACD is showing early bullish signs. Breakout watch is on!
DYRO, NFA
When Holding is Suicide, Hope Is a KillerStill holding… just waiting for it to come back?
You’re not alone. Most traders enter with confidence and exit with fear. But in some situations, holding isn’t strategy — it’s just slow motion account suicide.
If you’ve ever lost sleep after refusing to close a position, this one’s for you.
Hello
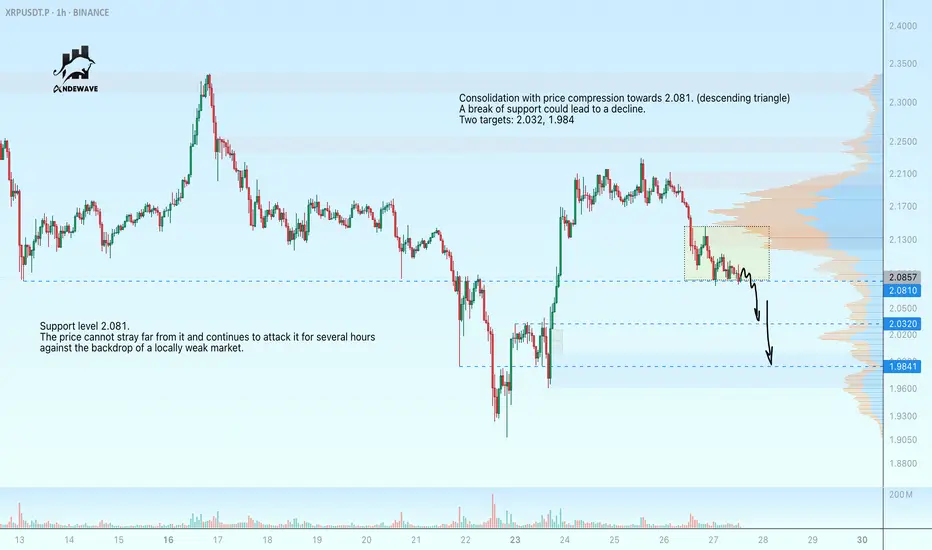
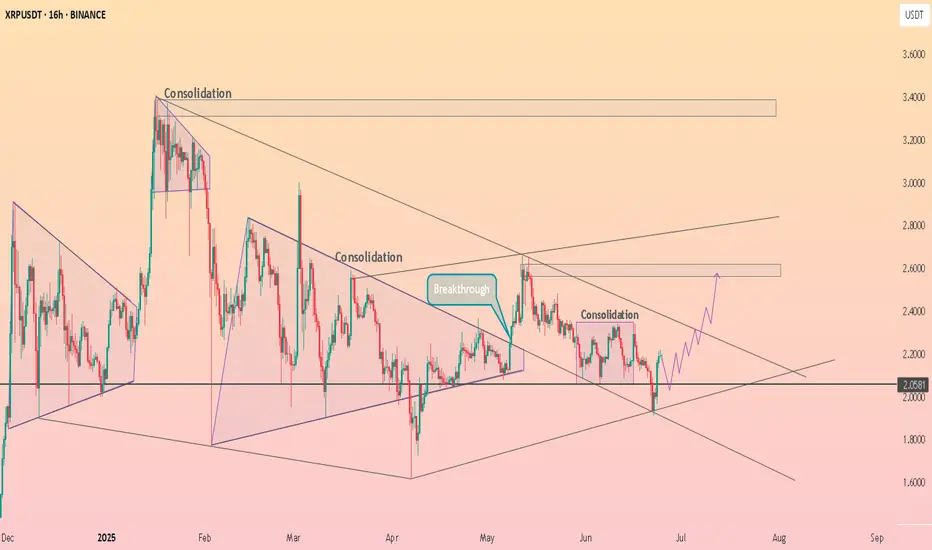
XRP is preparing to break through supportXRPUSDT is not yet ready for growth.
The important support level is 2.081. The price cannot stray far from it and has been attacking it for several hours amid a locally weak market.
Scenario: Consolidation with price compression towards 2.081. (descending triangle)
A breakout of support could lead
XRP Support Holds After Being Tested 12 Times...Everything below $2 is quickly bought. No crash is good news. Not having bearish action and bearish follow up on sellers pressure is bullish. XRP is bullish and has been consolidating for months. The longer XRP trades above $2, the stronger will be the bullish wave that follows. We are getting very
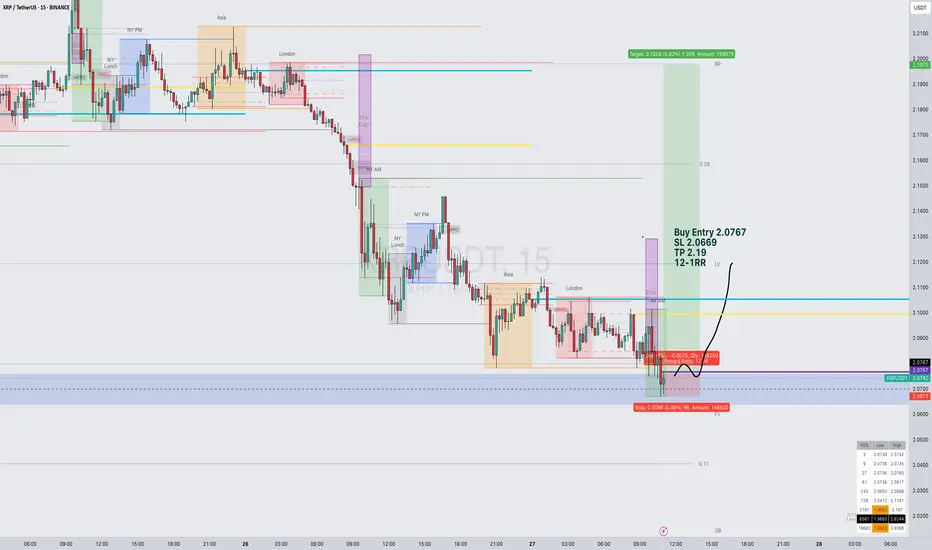
Pair: XRP/USDTSession: NY Open
Framework: Smart Money Concepts x Goldbach Precision
Swept the Asia Low — textbook liquidity grab.
Price retraced perfectly into a Goldbach Fair Value Gap (FVG) following the sweep, aligning beautifully with Smart Money logic.
This setup confirms internal liquidity was cleared and
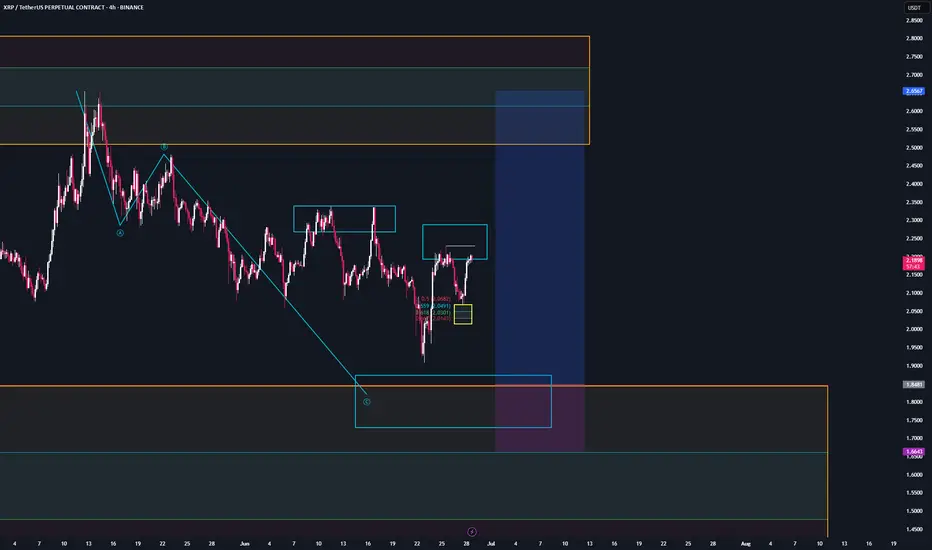
XRP - Trade SetupLocal Price Action:
We are in the area of the major trend reversal zone. Since the price has left the zone by more than its own size, the zone has been reactivated and is tradable again according to the System.
Macro Price
The 0.5 level of the major trend reversal zone overlaps with the be
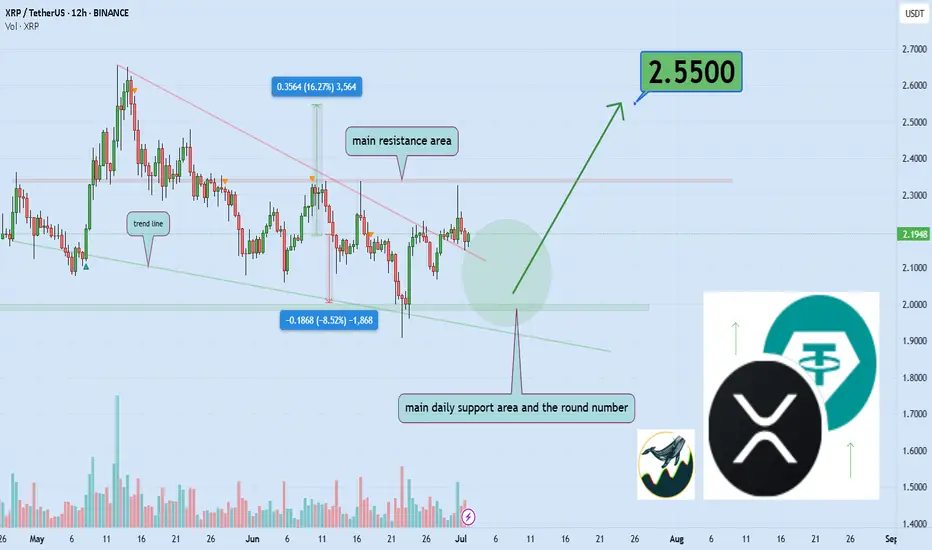
HolderStat┆XRPUSD held the supportBINANCE:XRPUSDT on the 16h chart is showing strength above $2.05 after breaking out from consolidation. The path is clear toward $2.30 and $2.60 as buyers regain control. The bullish pattern sequence continues to develop.
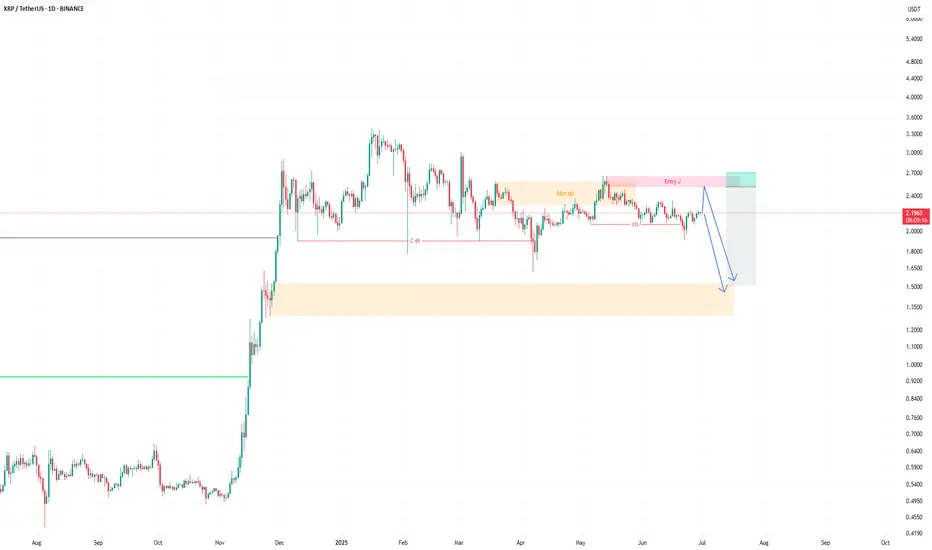
It reaches a maximum of $2.5 and then decreases to $1.5The price is rising in the lower timeframe. But it can eventually go up to $2.5 and then it will fall to the $1.5 range, which is -40%.
Please do not invest long-term in the downtrend
If you like, follow me to get better signals.
See all ideas
Summarizing what the indicators are suggesting.
Oscillators
Neutral
SellBuy
Strong sellStrong buy
Strong sellSellNeutralBuyStrong buy
Oscillators
Neutral
SellBuy
Strong sellStrong buy
Strong sellSellNeutralBuyStrong buy
Summary
Neutral
SellBuy
Strong sellStrong buy
Strong sellSellNeutralBuyStrong buy
Summary
Neutral
SellBuy
Strong sellStrong buy
Strong sellSellNeutralBuyStrong buy
Summary
Neutral
SellBuy
Strong sellStrong buy
Strong sellSellNeutralBuyStrong buy
Moving Averages
Neutral
SellBuy
Strong sellStrong buy
Strong sellSellNeutralBuyStrong buy
Moving Averages
Neutral
SellBuy
Strong sellStrong buy
Strong sellSellNeutralBuyStrong buy
Displays a symbol's price movements over previous years to identify recurring trends.