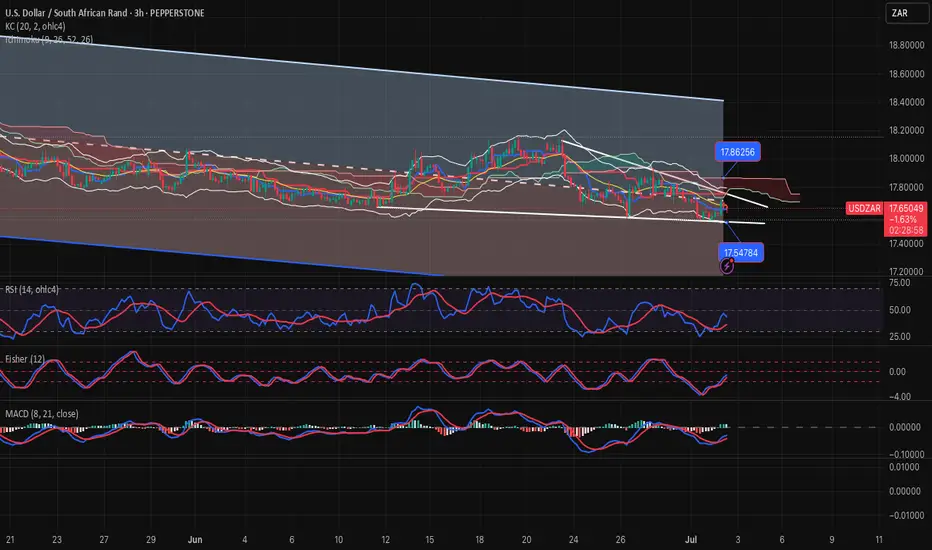
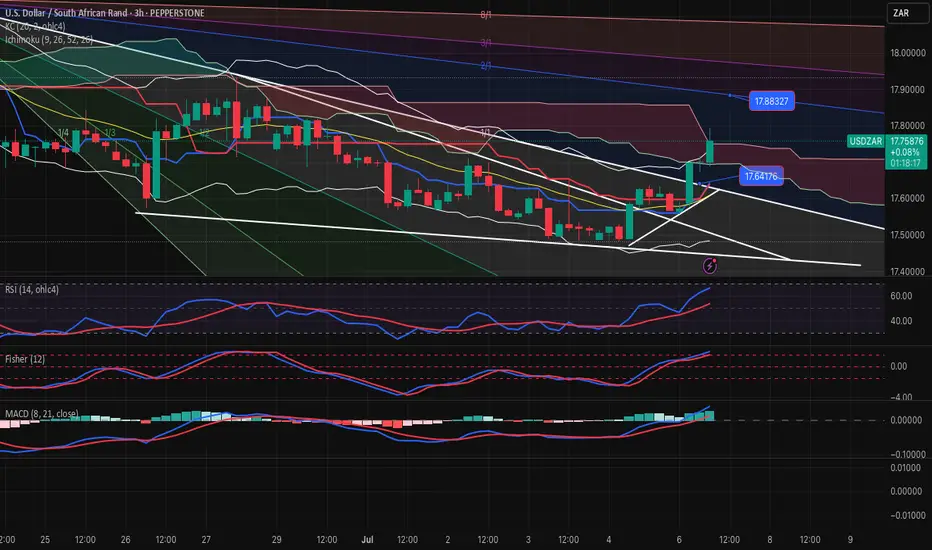
USDZAR-BUY strategy 3 hourly chart Reg., ChannelIt feels we are in a slight buying mode today. The indicators are somewhat positive, and we have made some ground before.
Strategy BY @ 17.5875-17.6350 and take profit near 17.7875
Related currencies
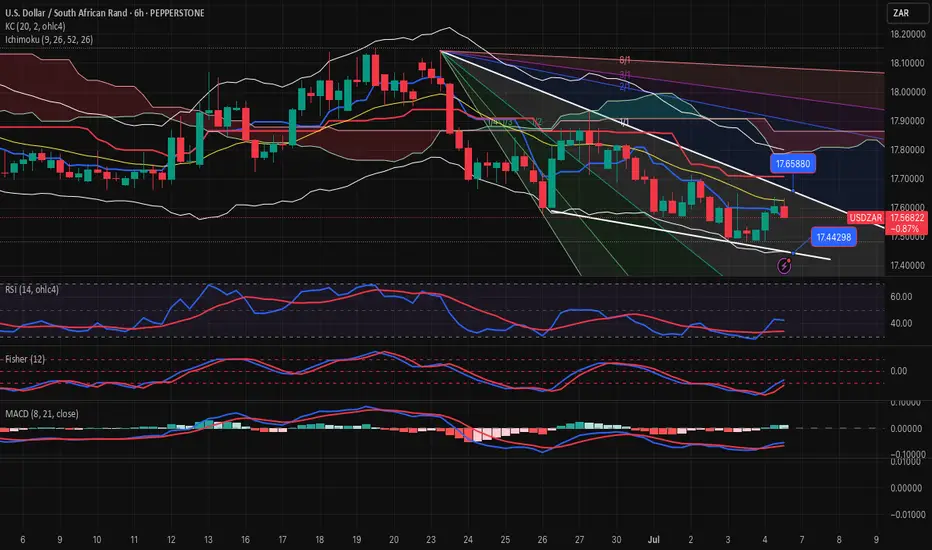
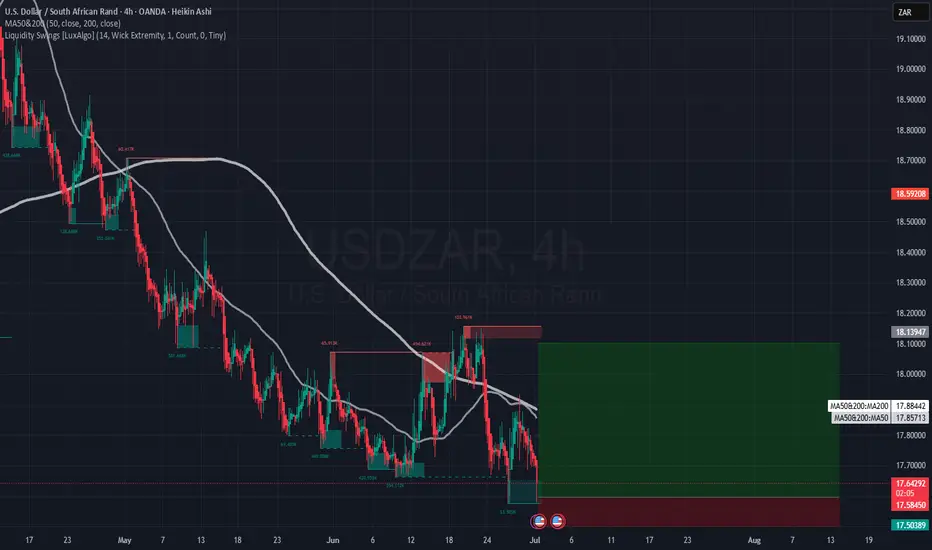
USDZAR-SELL strategy 6 hourly chartThere is selling pressure within a descending wedge, which means over-time we will see recovery. For now though short-term time frames are negative and likely we may see 17.4500 test.
Strategy SELL @ 17.5500-17.5975 and take profit near 17.4500.
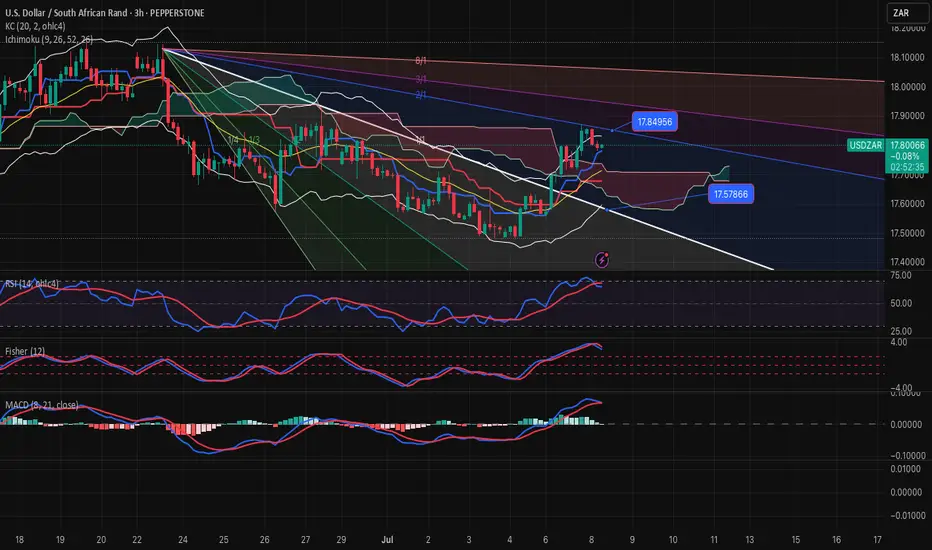
USDZAR-SELL strategy 3 Hourly chart GANNThe pair has some resistance near 17.8500 area, and we are little negative for some indicators. The move lower will be minor and should not carry high expectation of large decline. I think we are building towards sharper move higher in the medium0term.
Strategy sell @ 17.7850-17.8350 and take profi
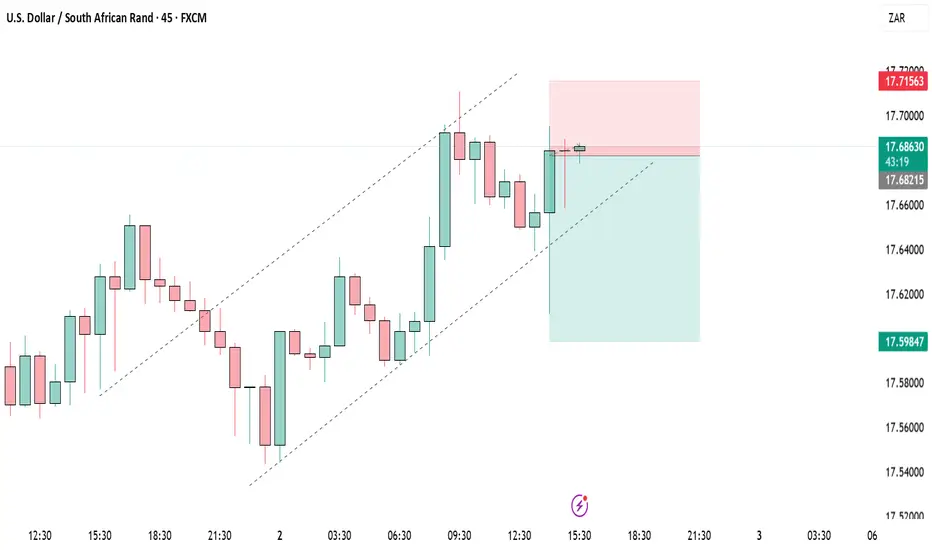
USDZAR-BUY strategy 3 hourly chartThe pair was not able to move lower, and broke 17.6400 area instead. The issue was negative environment, and a descending wedge warning of move higher over-time. The move lower did not happen within the wedge. Gold also moved lower helping weakening of the ZAR.
Now the picture is near overbought st
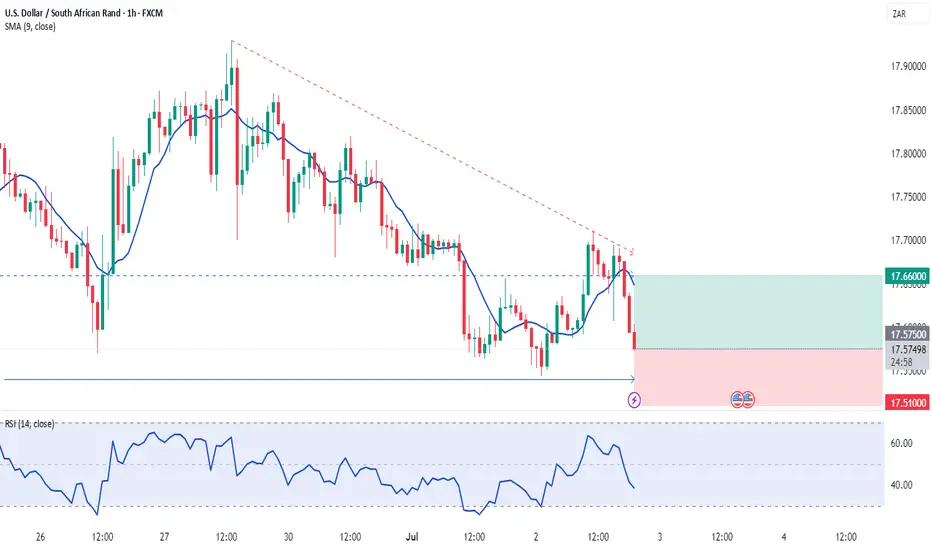
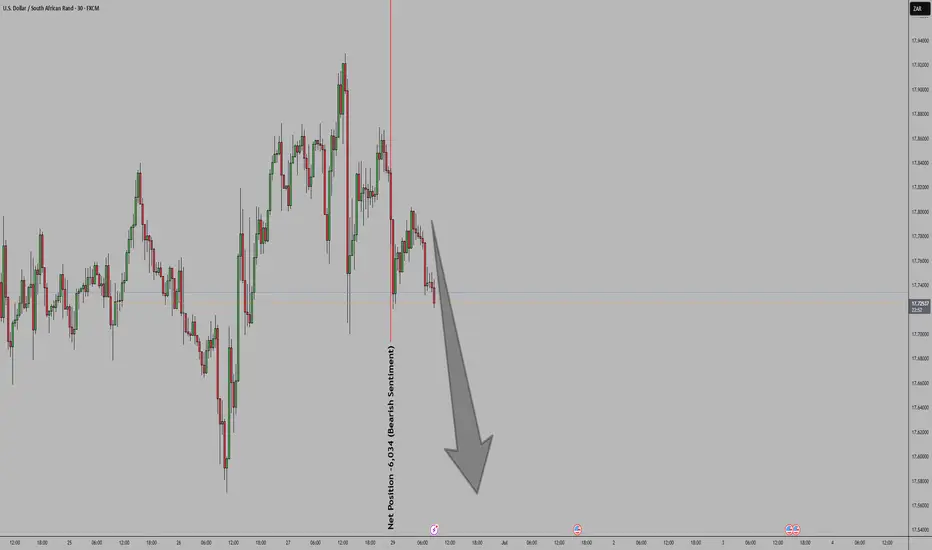
SELL USDZARUSDZAR to short to nearest pivot just below the fresh low at 17,60. New York session closed negative and price will revisit that low. Enter now and when the channel breaks
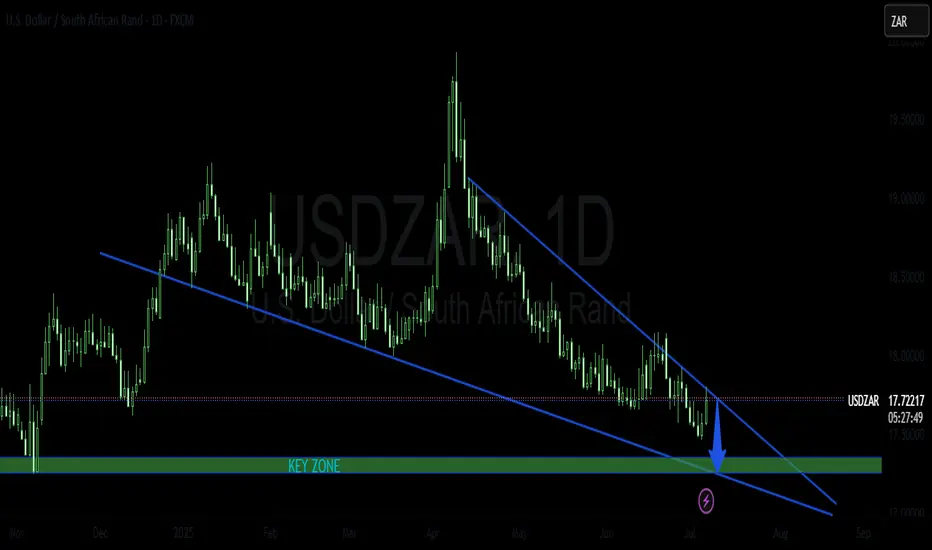
USDZAR SHORT TRADE PLANThe pair has been trading inside a bearish trend. It recently tested the boarder of the descending wedge pattern and from this point I will be looking for the reversal.
Please do your own analysis before placing any trades.
Cheers and Happy Trading !!!
USDZAR Long trading opportunity(swing-trading) 4I expect a swing of about 50cents-75cents all the way up to R18.10+- per dollar, expecting the ZAR to weaken in the short term within a month to a few months(maybe more than a month not more than 3 months) to 18.10+-
I am risking money.
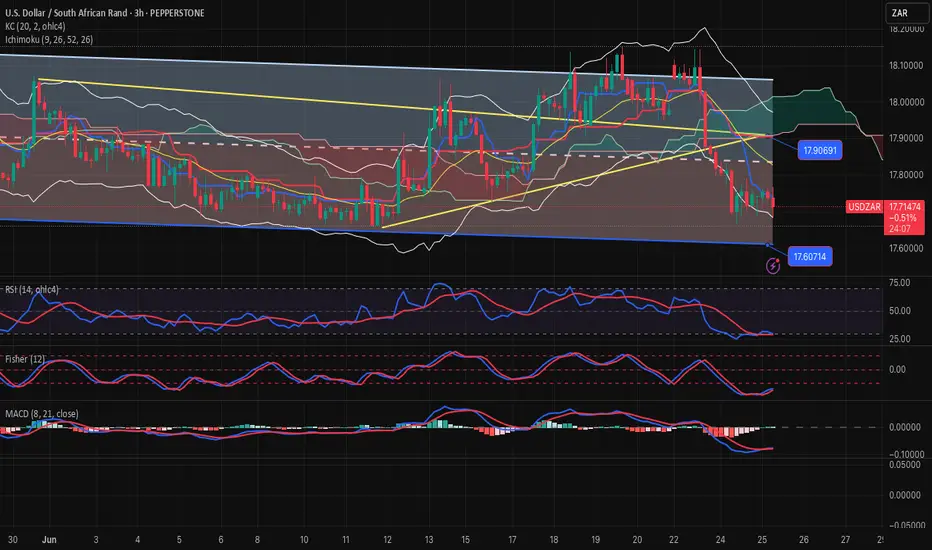
USDZAR-BUY strategy 3 Hourly chart Reg. ChannelThe pair is still under pressure, and certainly not out of negative territory. I suspect we may test down side further, especially we have moved below 17.8750 area. The channel support is 17.60s and near that level would start considering BUY entry. The indicators are slightly positive, so if one is
USDZARSince USD is bearish and ZAR is bullish,
The USD/ZAR pair has a downward bias.
Traders are betting against the U.S. Dollar and in favor of the South African Rand so USD/ZAR may move lower (ZAR appreciation).
See all ideas
Summarizing what the indicators are suggesting.
Oscillators
Neutral
SellBuy
Strong sellStrong buy
Strong sellSellNeutralBuyStrong buy
Oscillators
Neutral
SellBuy
Strong sellStrong buy
Strong sellSellNeutralBuyStrong buy
Summary
Neutral
SellBuy
Strong sellStrong buy
Strong sellSellNeutralBuyStrong buy
Summary
Neutral
SellBuy
Strong sellStrong buy
Strong sellSellNeutralBuyStrong buy
Summary
Neutral
SellBuy
Strong sellStrong buy
Strong sellSellNeutralBuyStrong buy
Moving Averages
Neutral
SellBuy
Strong sellStrong buy
Strong sellSellNeutralBuyStrong buy
Moving Averages
Neutral
SellBuy
Strong sellStrong buy
Strong sellSellNeutralBuyStrong buy
Displays a symbol's price movements over previous years to identify recurring trends.
Frequently Asked Questions
The current rate of ZARUSD is 0.0558 USD — it has increased by 0.54% in the past 24 hours. See more of ZARUSD rate dynamics on the detailed chart.
The value of the ZARUSD pair is quoted as 1 ZAR per x USD. For example, if the pair is trading at 1.50, it means it takes 1.5 USD to buy 1 ZAR.
The term volatility describes the risk related to the changes in an asset's value. ZARUSD has the volatility rating of 1.44%. Track all currencies' changes with our live Forex Heatmap and prepare for markets volatility.
ZARUSD rate hasn't changed in a week, the last month showed zero change in price, and over the last year it has increased by 2.57%. Track live rate changes on the ZARUSD chart.
Learn how you can make money on rate changes in numerous trading ideas created by our community.
Learn how you can make money on rate changes in numerous trading ideas created by our community.
Currencies are usually traded through forex brokers — choose the one that suits your needs and go ahead. You can trade ZARUSD right from TradingView charts — just log in to you broker account. Check out the list of our integrated brokers and find the best one for your needs and strategy.
When deciding to buy or sell currency one should keep in mind many factors including current geopolitical situation, interest rates, and other. But before plunging into a deep research, you can start with ZARUSD technical analysis. The technical rating for the pair is neutral today, but don't forget that markets can be very unstable, so don't stop here. According to our 1 week rating the ZARUSD shows the buy signal, and 1 month rating is neutral. See more of ZARUSD technicals for a more comprehensive analysis.