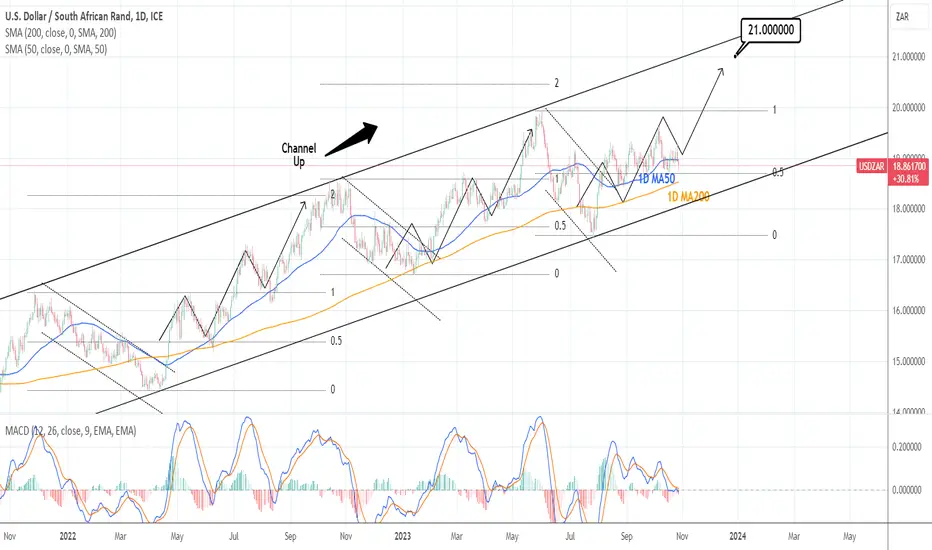
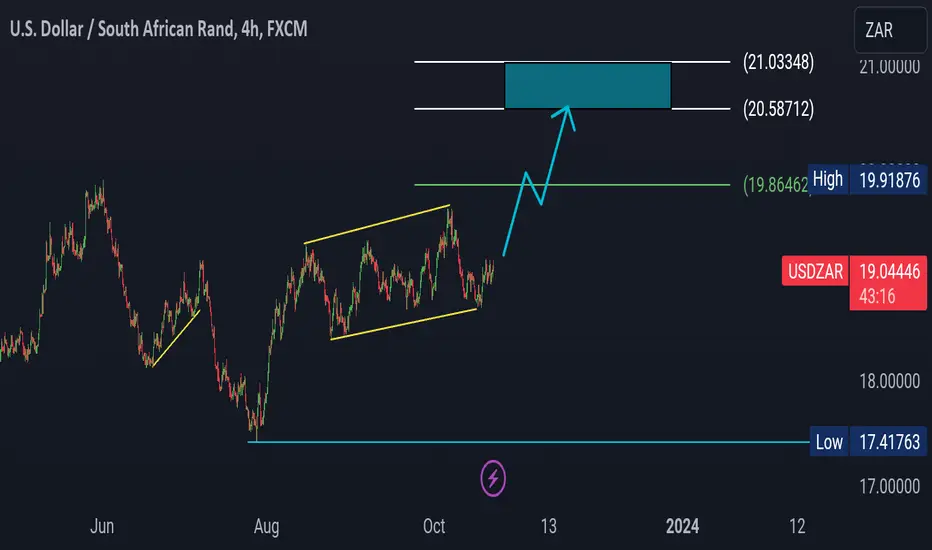
USDZAR: Long term Channel Up preparing the final rally.USDZAR is trading around the 1D MA50 on neutral technicals (RSI = 45.374, MACD = -0.003, ADX = 21.007) but on a long term Channel Up for the past 2 years. This current consolidation has been the accumulation period in the two bullish legs prior before the final rally to a Higher High. This is our buy entry and we aim at the top of the Channel (TP = 21.000).
## If you like our free content follow our profile to get more daily ideas. ##
## Comments and likes are greatly appreciated. ##
ZARUSD trade ideas
Short term bullish biasReversal candlestick pattern at strong support zone, daily still within bullish channel and 4h RSI and stoch oversold

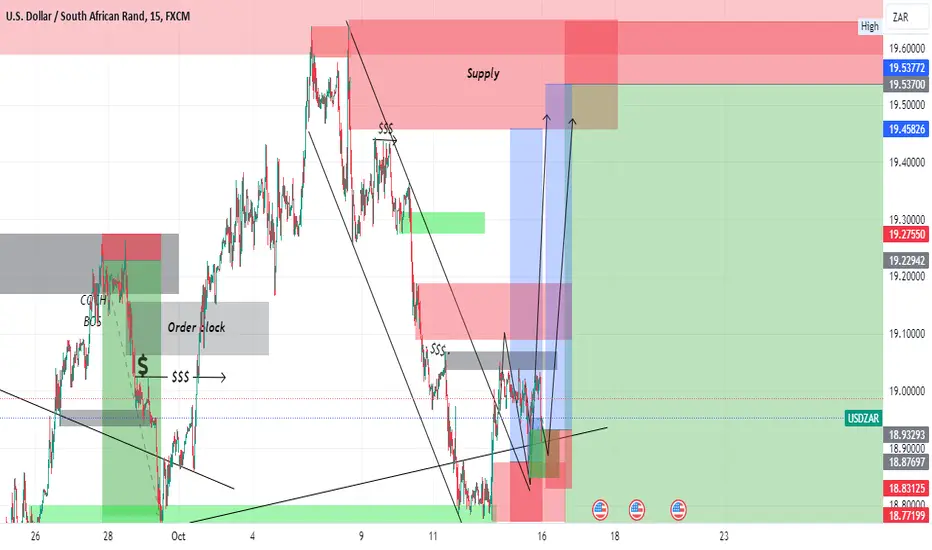
praying for its downfalli believe price will reject at 4hr supply zone then continue down to daily demand zone
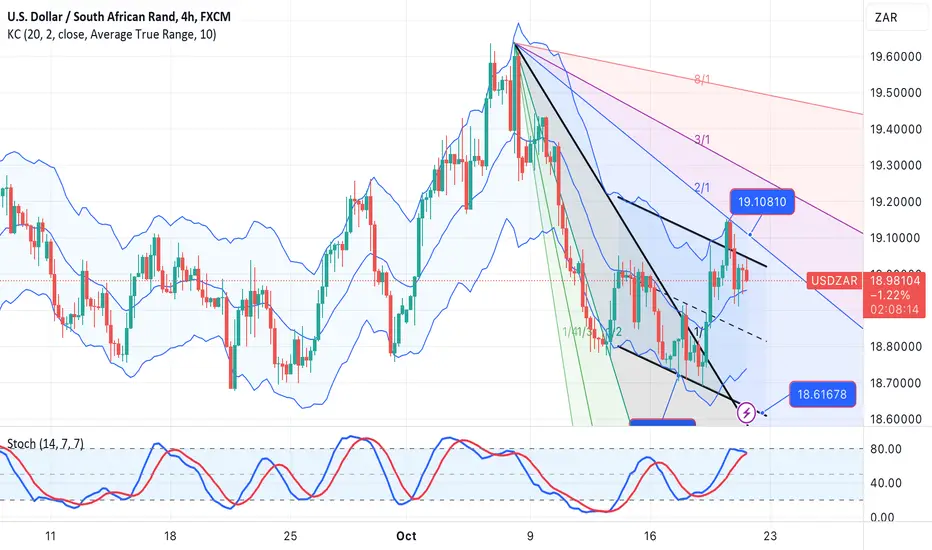
USDZAR-NEUTRAL 4-Hourly chartOne would have been able to get out near enough profit objective @ 19.25-19.27 or on the revised SL 9.13 handle. I did the first one @ 19.2650. Thereafter, I did not have clear view and it collapsed to current 18.9000. I feel the move lower has been to quick, even though we are below triangle support, and negative stochastic, I would prefer to stay out for now on this pair.
We monitor it for a few days again. The NOKZAR SL was also hit due to the fact that the USDZAR collapsed.
USDZAR-BUY strategy 4-Hourly chartConsidering that NOKZAR is too low, and the pair is within a triangle pattern with positive stochastic, chances are that the pair will be pulled upwards by USDNOK. The current USDNOK @ 11.15 translate to a USDZAR 19.3000 for correction upwards following NOK.
Strategy BUY @ 19.0000-19.0500 and take profit above 19.3000. SL below 18.8650 for now.
What goes up must come downi believe that price will continue to push until it rejects the 19.30000 price. previous supply zone . level also coincides with 61% FIB LEVEL
The Depreciating Sout African RandFundamentals:
Deteriorating economic-fundamentals for the South African Rand:
"It's a futile exercise trying to defend the exchange rate," says the South African Central Bank governor. He won't defend the depreciating rand. According to Reuters, Kganyago says that the "bank's main concern remained fighting inflation, reiterating that risks to the inflation outlook included food prices, oil prices and exchange-rate moves."
South Africa's consumer inflation "remains comfortably within the central bank's target range of between 3%-6%." The Rand's central bankers meet in November to discuss interest rates.
Technicals:
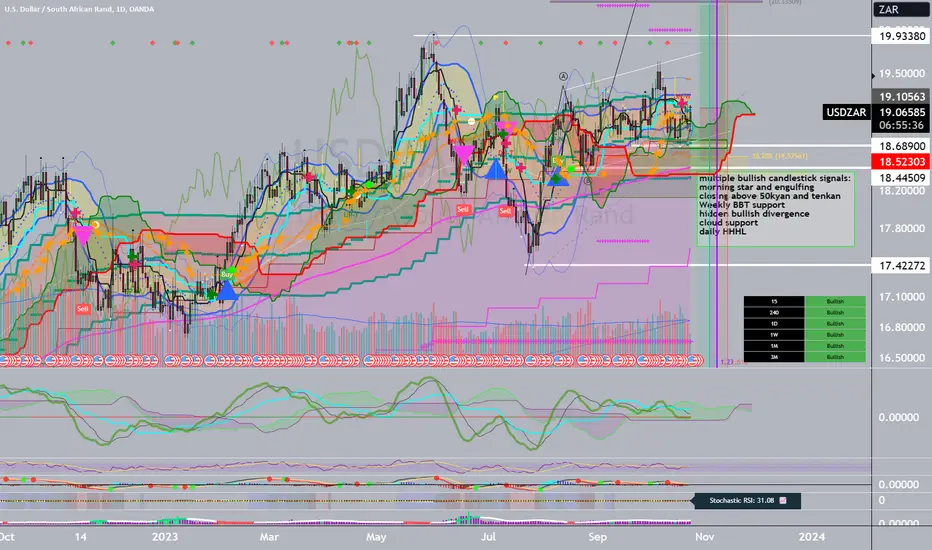
multiple bullish candlestick signals: morning star and engulfing
closing above 50kyan and tenkan
Weekly BBT support
hidden bullish divergence
cloud support
daily HHHL
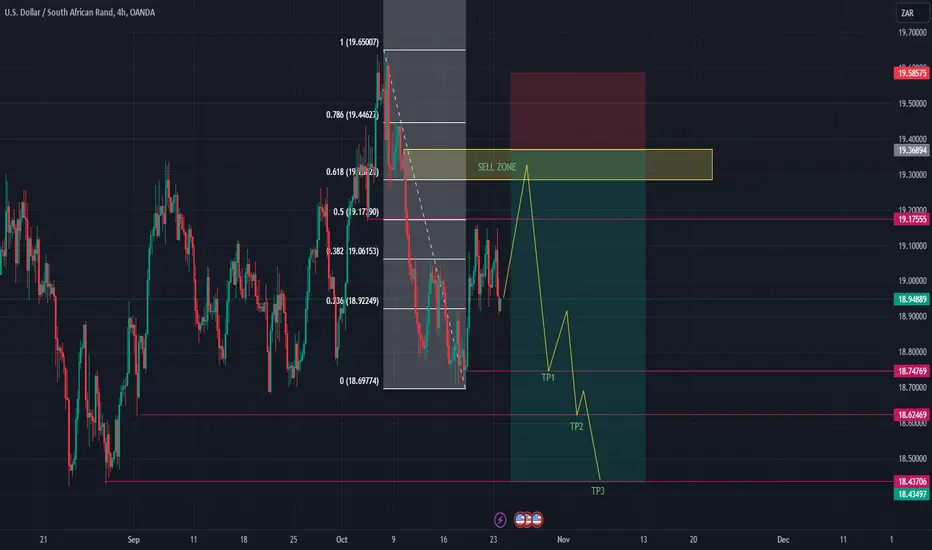
USDZAR is BearishHey Traders, lets closely watch USDZAR Pair is on the downward trend with likelihood of hitting both TP1 & TP2 by late Friday or next Monday morning. Based on the 4HR timeframe the 61.8% Fibb Retracement is within the Sell Zone.
UsdzarI trust this pattern is complete as expanded flat, if indeed it is complete, I'm looking to buy but not up to the blue box instead until 19.86 because this can turn back down for bigger regular flat pattern if will push to the blue box I would like to see a continuation correction at 19.86
Be a pro at reading candles Achieving a successful entry in forex trading hinges on your ability to comprehend the structural elements at play. Start by gaining a clear understanding of the market's current structural dynamics. Next, it's essential to analyze the candlestick formations to determine which party is likely to control the market. Often, traders tend to overemphasize patterns and trends, but it's crucial to take a step back, slow down, and focus on interpreting the candlesticks. This straightforward practice can significantly enhance your ability to make accurate predictions for the next market move.

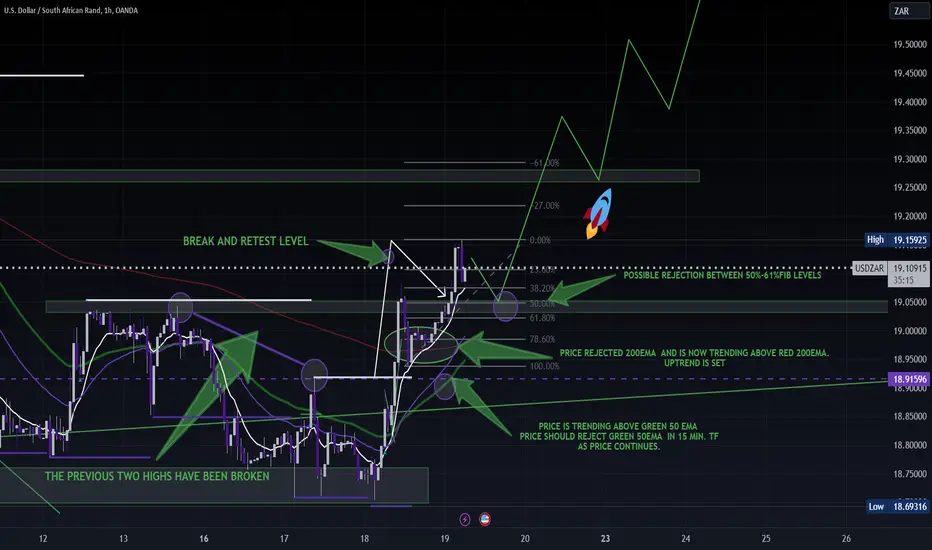
USDZAR longinterval:240 min
time identified: 07:32 am (UTC+2)
DESCRIPTION:
with a double bottom formed and having retraced already, we could see the bullish move continue for some time, long enough for us to bag the 2000 pips.
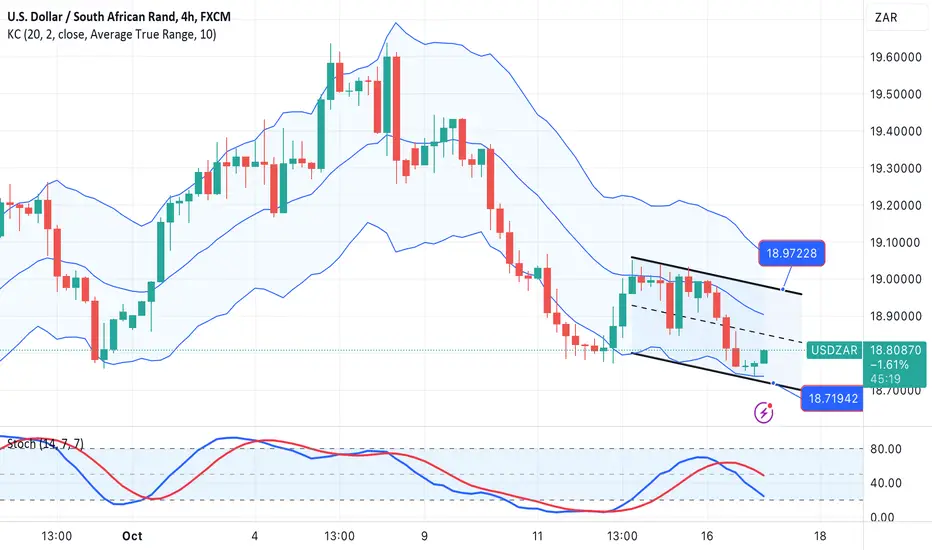
USDZAR-SELL strategy 4-Hourly chartThe pair as usual is aggressive either way, however, it does follow ranges (it respects it). Now we have tried upside above 19.1000 and we have moved lower thereafter. It is shadowing now GOLD price, and based on that and negative stochastic, we are back into SELL mode.
Strategy SELL @ 18.9800-19,0575 and take profit @ 18.6350. SL place this above 19.1150 for now.
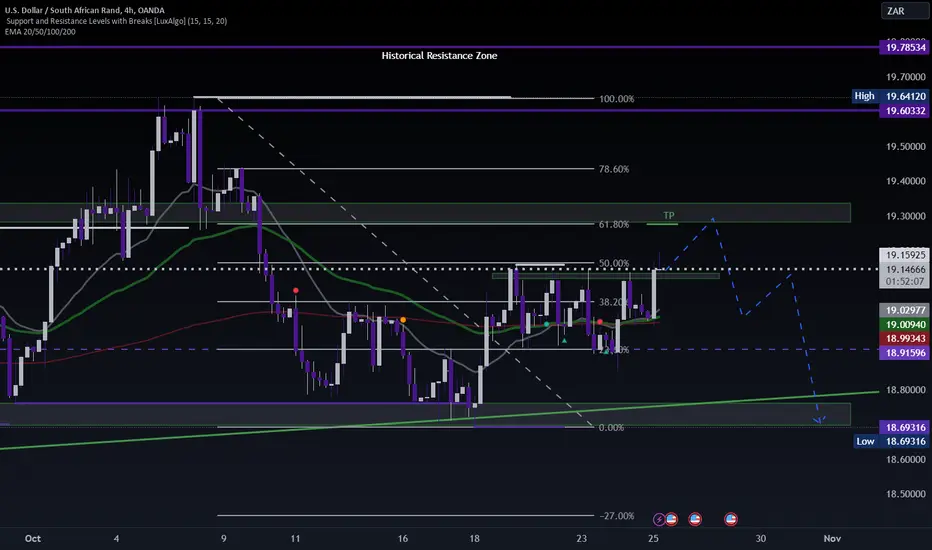
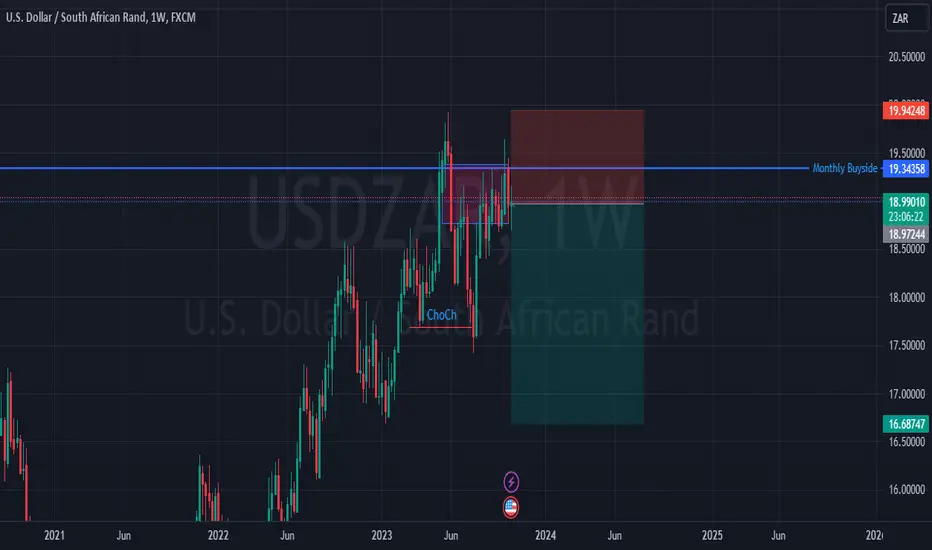
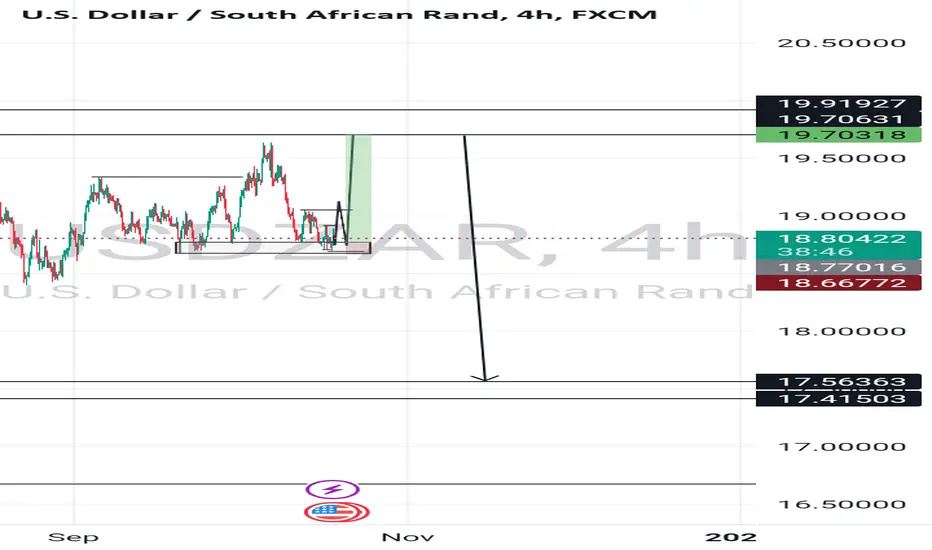
USDZAR LONG TERM SELLThe USDZAR has just taken out a Monthly Buyside liquidity and I'm expecting it to drop to 50% of the current range. Took an entry in the Weekly FVG.
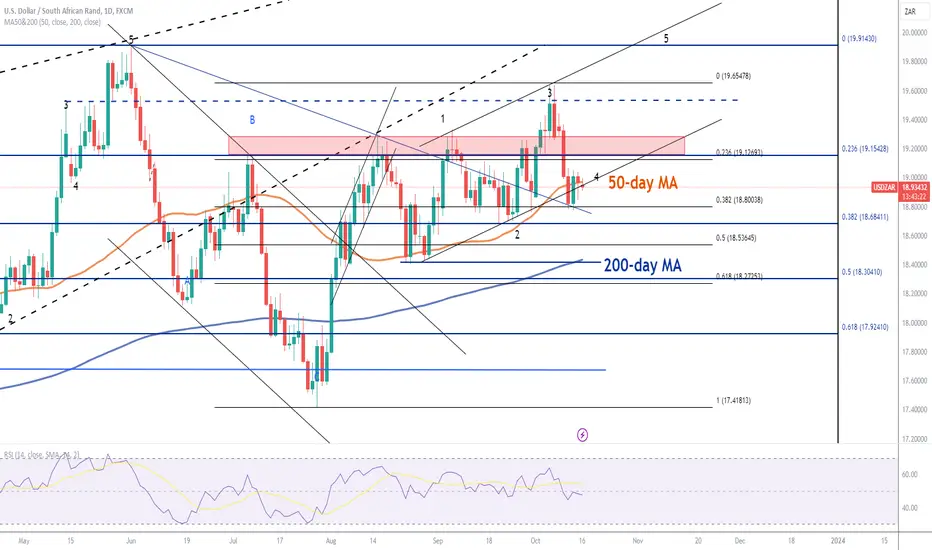
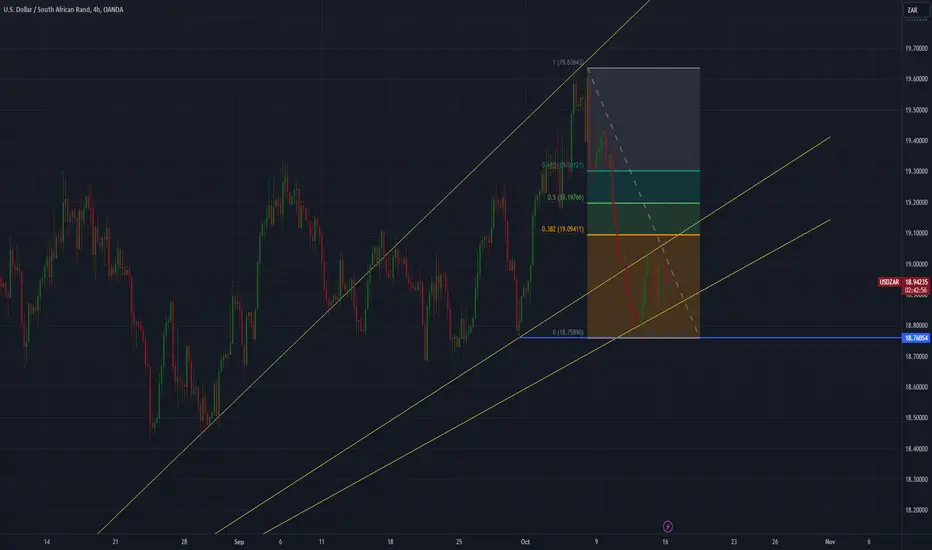
USD/ZAR check in.The pair is currently dancing with the 50-day MA rate of 18.97, which is a critical rate to watch. A failed break back above the 50-day MA will allow the rand to pull the pair below 18.80 with a possible move lower towards the 200-day MA rate of 18.43. A break above the 50-day MA will however signal another leg higher towards 19.90 for the pair. It’s too early to make a call now but the strength of the current upward channel seems to be fading which is, dare I say it, rand positive.
The break below 19.12 is also rand positive as it invalidates the 5-wave impulse.
GeminiForexTradeRemember that just because price gets to either a Buy or Sell level doesn't mean you trade blindly. Always look out for other supporting factors/ indicators to validate your bias. The more factors there are, the higher the probability of success
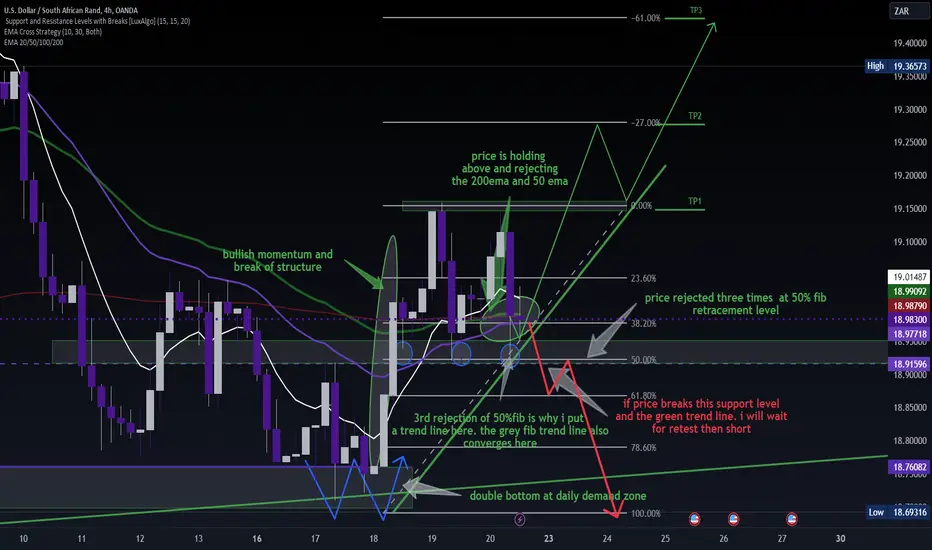
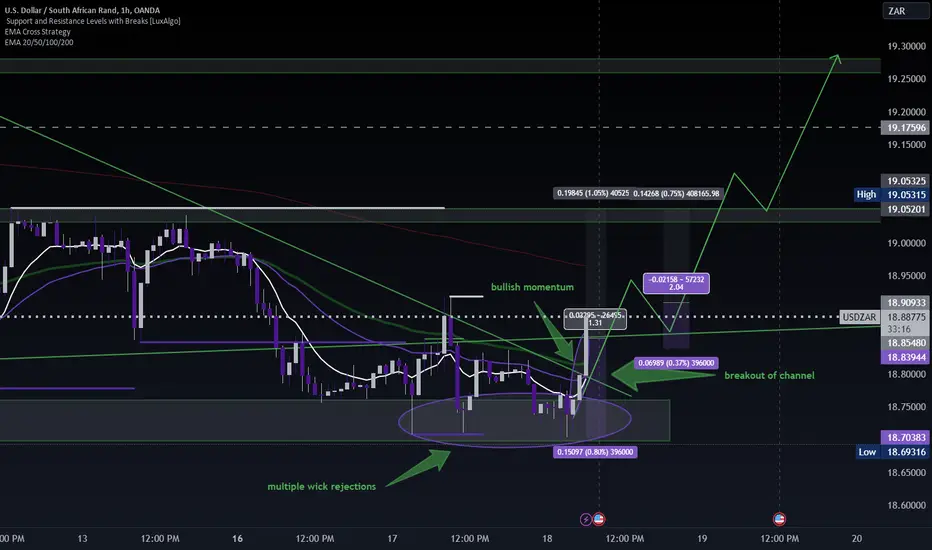
breakout uptrend price has broken out of the channel with bullish momentum after rejecting key support level multiple times.
Usdzar is longFor now I will be focusing on buying orders only since well my analysis are indicating that usdzar will continue being bullish before major sell order.
I will see how it goes.
Happy trading.
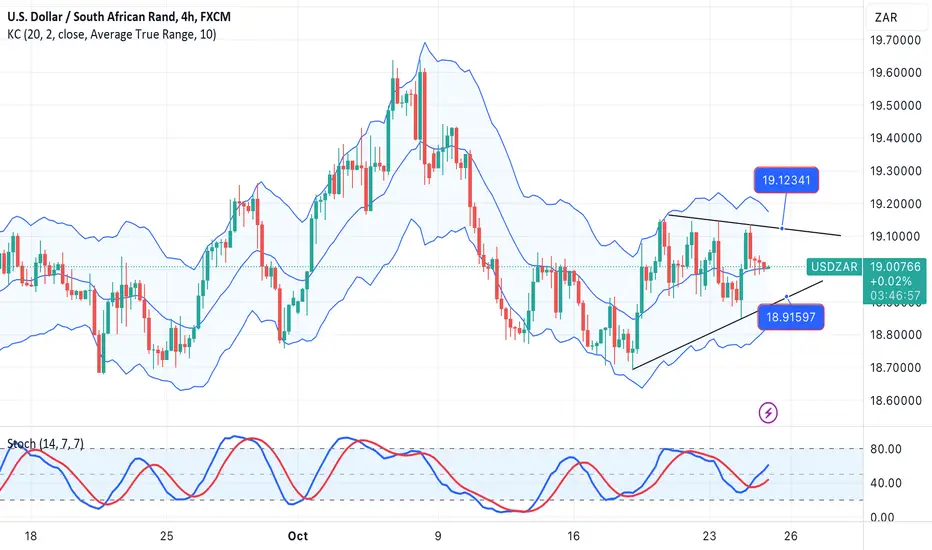
USDZAR-RANGE SELL 4-hourly chartThe pair has reached profit level, and for now we should SELL into rally within the range.
We are below mid-Keltner, and strategy is SELL near the mid-level, i.e. 18.9050 area (check the current level at time of your SELL).
Stochastic is negative and keeps the pressure on the pair.
Strategy SELL near 18.9000 and place SL above 19.0200. Profit order @ 18.7150.
USDZAR Speed lines FibonacciPrice trading midway between my resistance and support speed lines. Price bounced of a horizontal support, but did not reach the 38.2 retracement level. On my short list and will read the candlesticks as soon as price start intersecting my speed lines. Set alert on your trendlines and only check back once alerts are triggered.
USDZARWe never had our Choch Supply tested so this week I'm looing forward to seeing the market take out the liquidity thats been generated below our Supply'
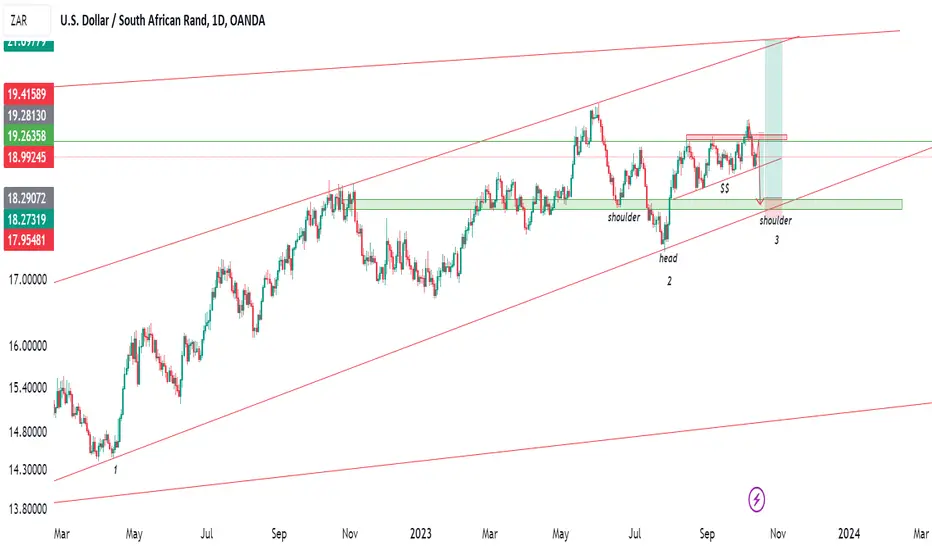
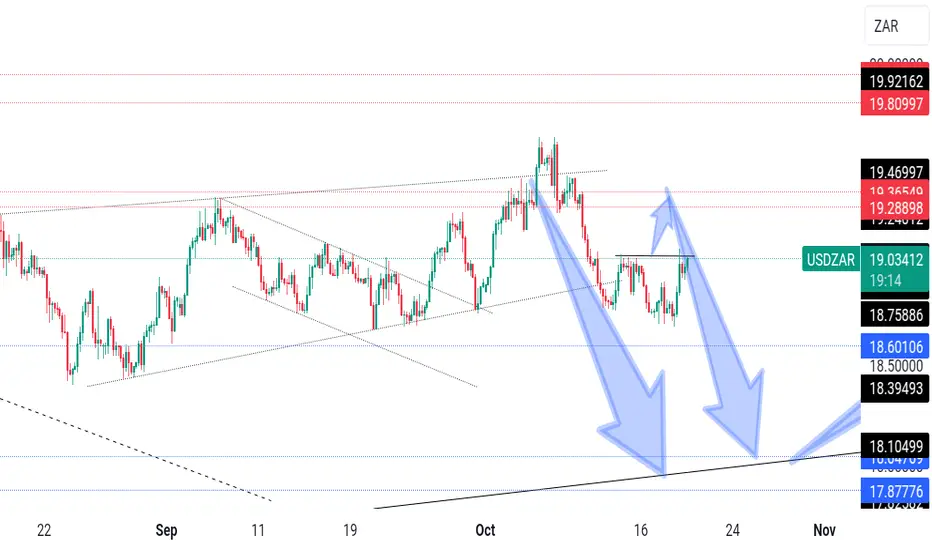
USDZARUSDZAR is clearly bullish. but there seem to be some sort of selling opportunities at the support turned resistance the after retest where it looks like its going to push to. Resistance lies exactly at 61.8% fib level, another trust worthy confluence. if that happens, we expect USDZAR to fall to 18.10 where we might have a good buying opportunity. our confluences here: 1. Possible head and shoulder pattern, 2. A 61.8% fib level retest, 3. retest of an ascending trendline