Spotify's Valuation Is Red-Lining (Rating Downgrade)📈 Spotify's Remarkable Comeback
Spotify NYSE:SPOT has transformed itself from a money-losing audio platform into a disciplined, profit-generating tech firm. Through smarter podcast investments, layoffs, and better monetization strategies, the company recently swung from red ink to positive free c

The best trades require research, then commitment.
Get started for free$0 forever, no credit card needed

Scott "Kidd" PoteetThe unlikely astronaut

Where the world does markets
Join 100 million traders and investors taking the future into their own hands.

Using 1 min time frame for entries on VX algo & day tradingwhat time frames do you use to confirm entries outside of a buy signal?
If I am day trading, I will mainly use the 1 minute time frame to look for moving average support and resistance, and read the candle stick patterns as well from that chart.
However, there are times I'll switch to a 5 minute a

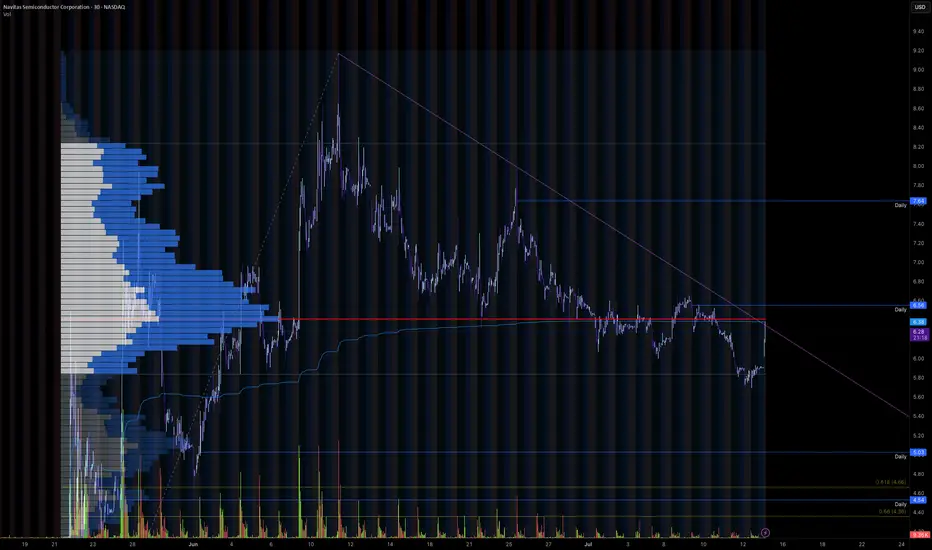
Trendline Breakout for Wave 3Navitas is currently looking at breaking out of its recent downtrend to potentially begin wave 3 of its move up, which, as we all know, is the most impulsive move.
Could be very tasty after a 350% pump already
Need to get above the range POC and breakout of the trend line, would be looking to get
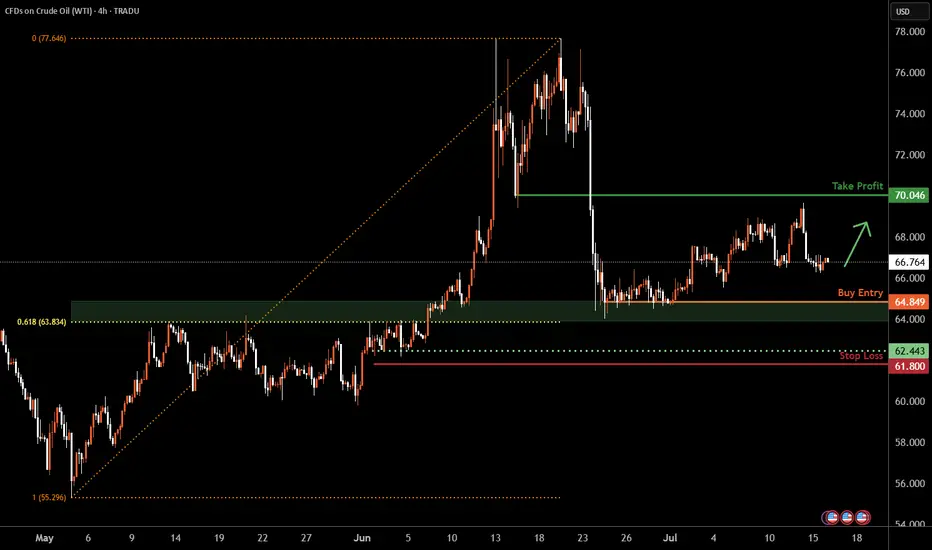
WTI Oil H4 | Potential bounce off a multi-swing-low supportWTI oil (USOIL) is falling towards a multi-swing-low support and could potentially bounce off this level to climb higher.
Buy entry is at 64.84 which is a multi-swing-low support that aligns closely with the 61.8% Fibonacci retracement.
Stop loss is at 61.80 which is a level that lies underneath a
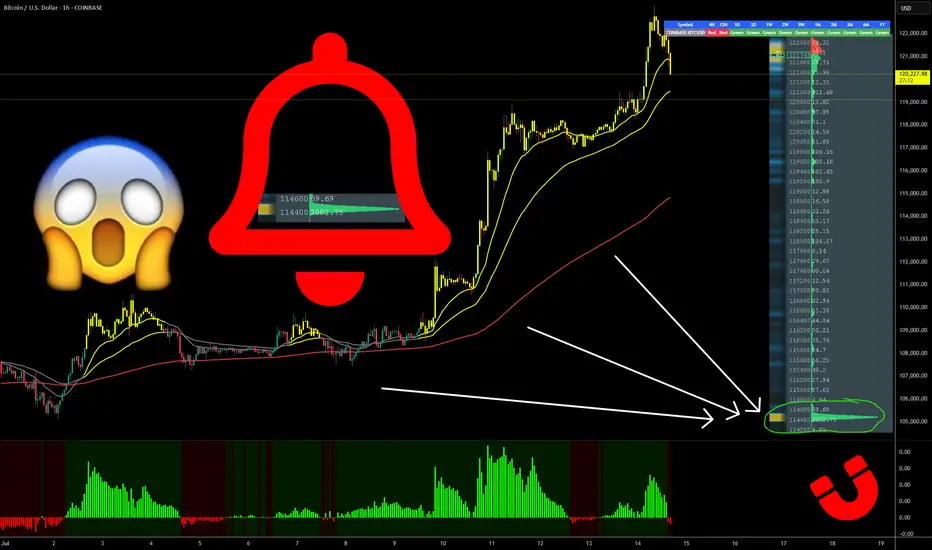
BITCOIN- MONSTER ORDERS IN THE BOOK -> You Know What This Means COINBASE:BTCUSD “Monster orders” are exceptionally large buy-limit orders clustered roughly 7 % beneath the current market price.
Large buy-limit walls can act like a price magnet—deep liquidity attracts algos and traders hunting fills, often pulling price straight toward the level.
Once the wall
End-of-Session Market ReviewToday was a solid trading day with some interesting moves across the markets:
S&P 500: The market trended upwards from the open, gradually moving into and above the prior day’s value area, closing near the high of that range.
NASDAQ 100: After some initial back-and-forth, it climbed above the prio

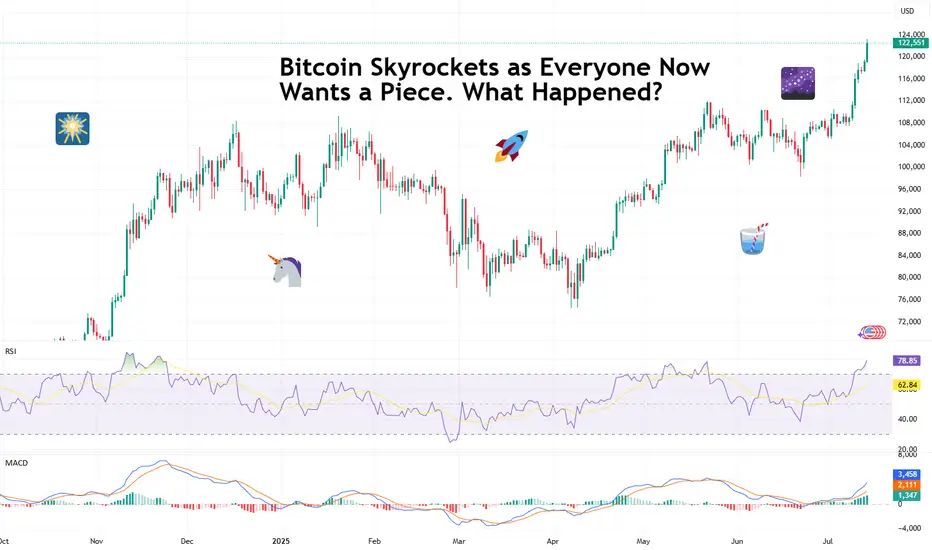
Bitcoin Skyrockets as Everyone Now Wants a Piece. What Happened?If you took a few days off last week and went to get coffee this morning, you likely missed Bitcoin torching its all-time high and soaring into the uncharted.
The world’s most popular digital asset took off in an unstoppable rocket ride, smashing records so fast that even the always-wired-in day t
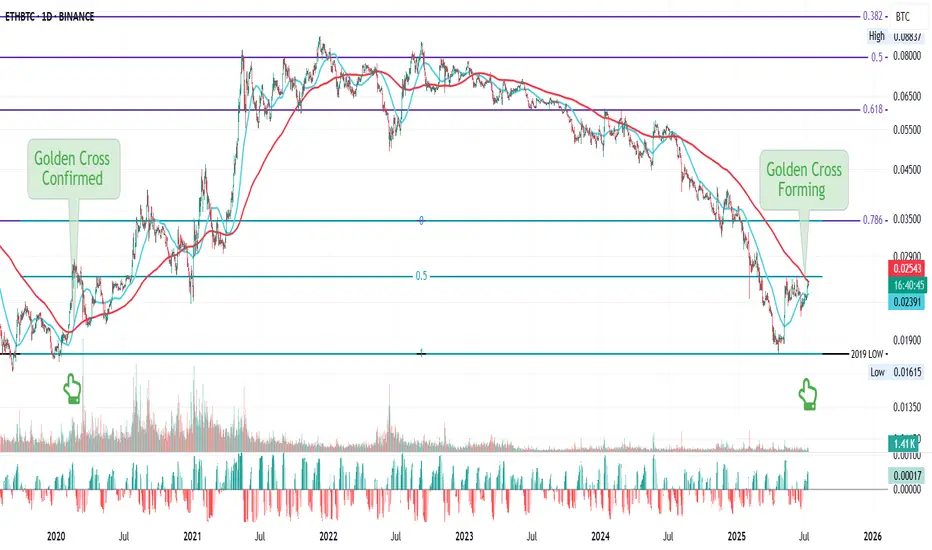
ETH/BTC: Golden Cross Reloaded?This is ETH/BTC on the daily chart.
A major event is about to unfold: the golden cross, where the 50MA crosses above the 200MA.
The last time this happened was in early 2020, around the same price zone, right after a bounce off the 2019 low double bottom and a rejection from the 0.5 Fib level, whic
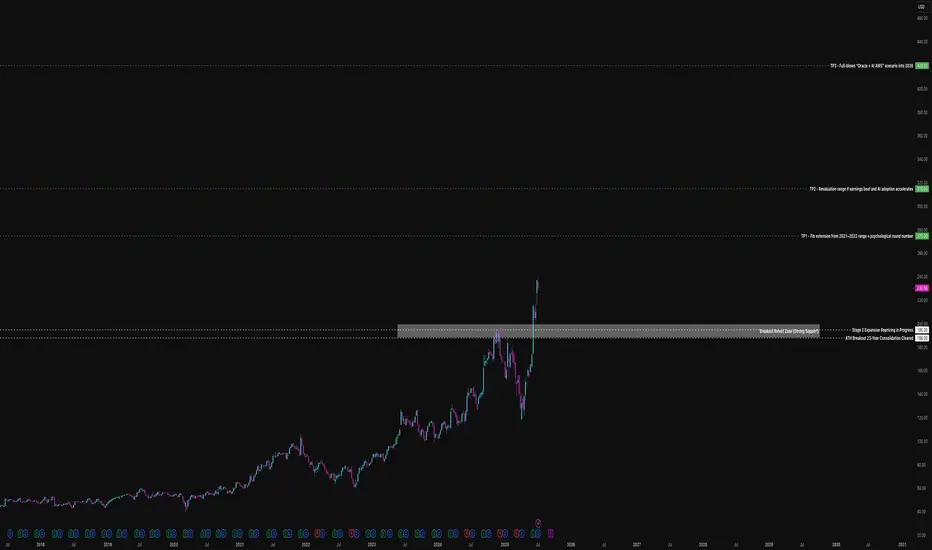
While You Were Watching NVIDIA, Oracle Quietly Ate the BackendEveryone's chasing the AI hype but Oracle is one of the only companies selling the picks and shovels behind the scenes.
While headlines focus on NVIDIA, Meta, and ChatGPT, Oracle has been building the back-end massive AI-ready data infrastructure, hyper scale cloud partnerships, and GPU clusters fe
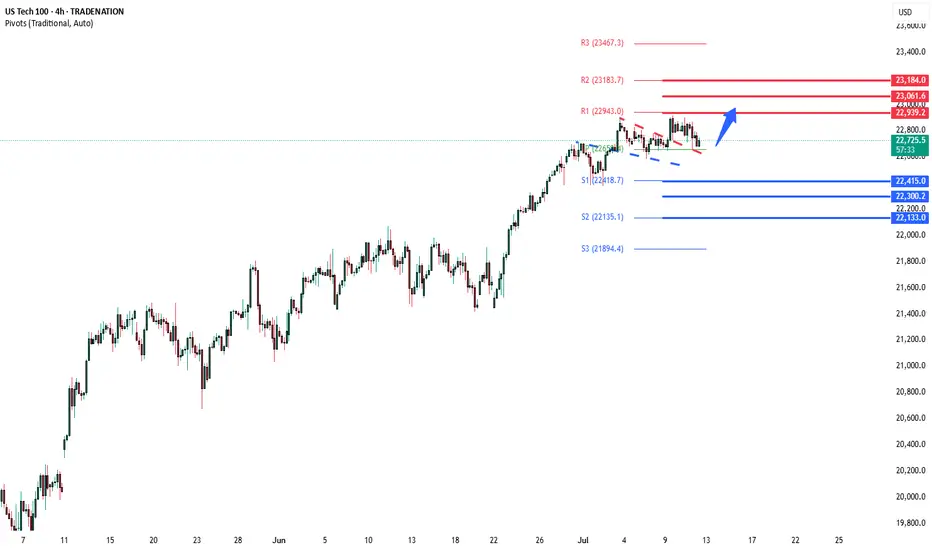
NSDQ100 Bullish breakout retest?Donald Trump escalated trade tensions again, threatening a 35% tariff on Canadian goods shortly after reopening trade talks, and floated doubling global tariffs to 20%. This reinforces his aggressive protectionist stance and puts renewed pressure on allies like Canada and Vietnam, the latter blindsi
See all editors' picks ideas
Crowding model ║ BullVision🔬 Overview
The Crypto Crowding Model Pro is a sophisticated analytical tool designed to visualize and quantify market conditions across multiple cryptocurrencies. By leveraging Relative Strength Index (RSI) and Z-score calculations, this indicator provides traders with an intuitive and detailed sn

Dynamic Gap Probability ToolDynamic Gap Probability Tool measures the percentage gap between price and a chosen moving average, then analyzes your chart history to estimate the likelihood of the next candle moving up or down. It dynamically adjusts its sample size to ensure statistical robustness while focusing on the exact de

EVaR Indicator and Position SizingThe Problem:
Financial markets consistently show "fat-tailed" distributions where extreme events occur with higher frequency than predicted by normal distributions (Gaussian or even log-normal). These fat tails manifest in sudden price crashes, volatility spikes, and black swan events that traditi

Divergence Screener [Trendoscope®]🎲Overview
The Divergence Screener is a powerful TradingView indicator designed to detect and visualize bullish and bearish divergences, including hidden divergences, between price action and a user-selected oscillator. Built with flexibility in mind, it allows traders to customize the oscillator

Logarithmic Moving Average (LMA) [QuantAlgo]🟢 Overview
The Logarithmic Moving Average (LMA) uses advanced logarithmic weighting to create a dynamic trend-following indicator that prioritizes recent price action while maintaining statistical significance. Unlike traditional moving averages that use linear or exponential weights, this indic

Volumatic Support/Resistance Levels [BigBeluga]🔵 OVERVIEW
A smart volume-powered tool for identifying key support and resistance zones—enhanced with real-time volume histogram fills and high-volume markers.
Volumatic Support/Resistance Levels detects structural levels from swing highs and lows, and wraps them in dynamic histograms that re

True Close – Institutional Trading Sessions (Zeiierman)█ Overview
True Close – Institutional Trading Sessions (Zeiierman) is a professional-grade session mapping tool designed to help traders align with how institutions perceive the market’s true close. Unlike the textbook “daily close” used by retail traders, institutional desks often anchor their

Open Interest Footprint IQ [TradingIQ]Hello Traders!
Th e Open Interest Footprint IQ indicator is an advanced visualization tool designed for cryptocurrency markets. It provides a granular, real-time breakdown of open interest changes across different price levels, allowing traders to see how aggressive market participation is distribu

Zigzag CandlesCan't deny that I am obsessed with zigzags. Been doing some crazy experiments with it and have many more in pipeline. I believe zigzag can be used to derive better trend following methods. Here is an attempt to visualize zigzag as candlesticks. Next steps probably to derive moving average, atr (alth

MathStatisticsKernelFunctionsLibrary "MathStatisticsKernelFunctions"
TODO: add library description here
uniform(distance, bandwidth) Uniform kernel.
Parameters:
distance : float, distance to kernel origin.
bandwidth : float, default=1.0, bandwidth limiter to weight the kernel.
Returns: float.
triangular(distance

See all indicators and strategies
Community trends
Alibaba - A remarkable reversal!🛒Alibaba ( NYSE:BABA ) reversed exactly here:
🔎Analysis summary:
Recently Alibaba has perfectly been respecting market structure. With the current bullish break and retest playing out, there is a very high chance that Alibaba will rally at least another +20%. But all of this chart behaviour j

Trendline Breakout for Wave 3Navitas is currently looking at breaking out of its recent downtrend to potentially begin wave 3 of its move up, which, as we all know, is the most impulsive move.
Could be very tasty after a 350% pump already
Need to get above the range POC and breakout of the trend line, would be looking to get
TSLA 4H Analysis – Bearish Reversal Setup📈 Trade Plan Summary
• Entry Range: 316 to 332
• Target 1: 280
• Target 2: 250
• Stop Loss: 370
⸻
📉 Type of Trade:
This appears to be a short (sell) position, since your targets are below the entry point.
⸻
✅ Risk Management Check
Let’s consider your worst-case entry (i.e., highest point i

Tesla: Still Pointing LowerTesla shares have recently staged a notable rebound, gaining approximately 10%. However, under our primary scenario, the stock remains in a downward trend within the turquoise wave 5, which is expected to extend further below the support level at $215.01 to complete the magenta wave (3). This move i

I'm scared of this stock and I'm buyingWall St. has already written the obituary on NASDAQ:SRPT —but that’s exactly why I’m stepping in.
Back in 2020 (link below) I traded a setup from a Spike at 50% Retracement up to its prior ATH near $170, cashed out, dodged the drug-trial IV grenade. I saw 50% of market cap evaporate in a gap. S

Unusual Volume Surge in $SBET — What’s Going On?NASDAQ:SBET is up 24.11% today, but the accumulation pattern seems... off. Volume looks suspiciously inflated.
Is this just a short-term squeeze or is there something deeper brewing behind the scenes?
Anyone familiar with the fundamentals or insider activity on this name? Drop insights below — curi

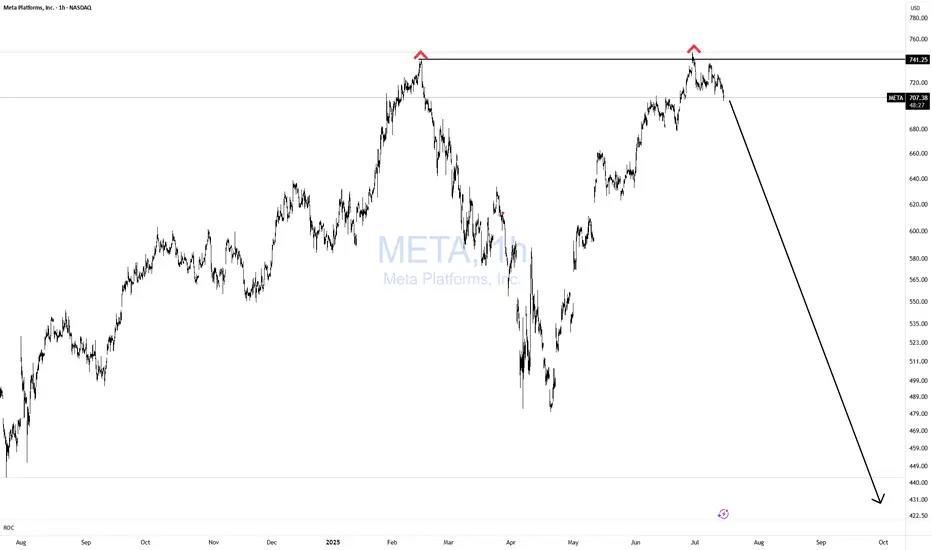
META Double Topping!Does it get any easier than this? NOPE!
If you can't spot this pattern from 1000 miles away, then you need a lot more time in the seat, training yourself in TA.
Simple with great risk reward!
Bulls GTFO!
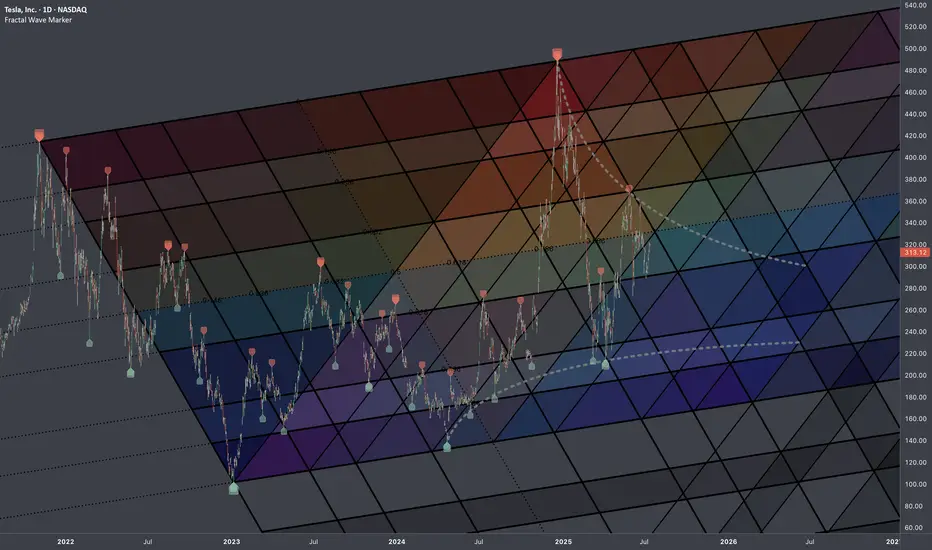
$TSLA: Fib InterconnectionsResearch Notes
Examining interconnection type with regressive angle:
Critical points:
Mapping with 3 fibonacci channels:
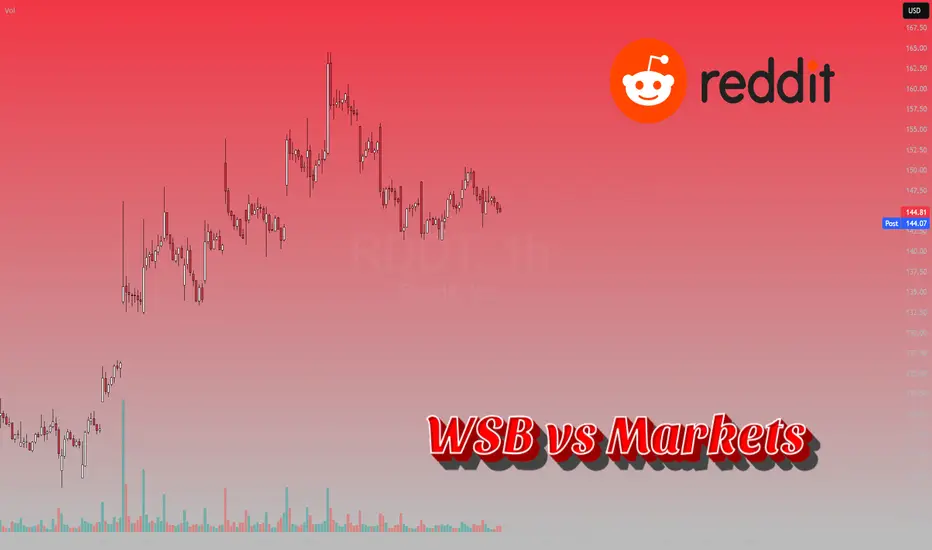
Wallstreetbets and Markets: Is there a correlation? Preface:
As a self proclaimed “market statistician”, I like to do a lot of random research, sometimes useful, sometimes not so useful.
Here is a post about some “not so useful” research I did. Though not so useful, the results are truly interesting.
The results of this analysis are, in my opin
See all stocks ideas
Today
MTBM&T Bank Corporation
Actual
4.24
USD
Estimate
3.99
USD
Today
CBSHCommerce Bancshares, Inc.
Actual
1.14
USD
Estimate
1.04
USD
Today
JNJJohnson & Johnson
Actual
2.77
USD
Estimate
2.68
USD
Today
FHNFirst Horizon Corporation
Actual
0.45
USD
Estimate
0.42
USD
Today
PNCPNC Financial Services Group, Inc. (The)
Actual
3.85
USD
Estimate
3.55
USD
Today
BACBank of America Corporation
Actual
0.89
USD
Estimate
0.86
USD
Today
MSMorgan Stanley
Actual
2.13
USD
Estimate
1.98
USD
Today
GSGoldman Sachs Group, Inc. (The)
Actual
10.91
USD
Estimate
9.65
USD
See more events
Community trends
BITCOIN- MONSTER ORDERS IN THE BOOK -> You Know What This Means COINBASE:BTCUSD “Monster orders” are exceptionally large buy-limit orders clustered roughly 7 % beneath the current market price.
Large buy-limit walls can act like a price magnet—deep liquidity attracts algos and traders hunting fills, often pulling price straight toward the level.
Once the wall
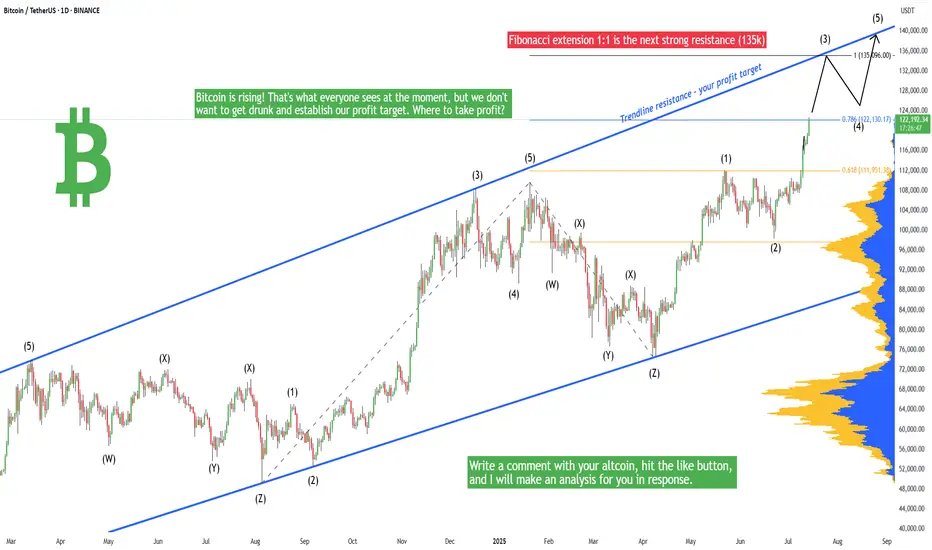
Bitcoin - Will hit 135k in the short-term, Elliott and FIBOBitcoin is rising! That's what everyone sees at the moment, but we don't want to get drunk and establish our profit target. Where to take profit? Because we are in the price discovery mode, there is no previous price action above the current price. At this moment we really cannot use any horizontal
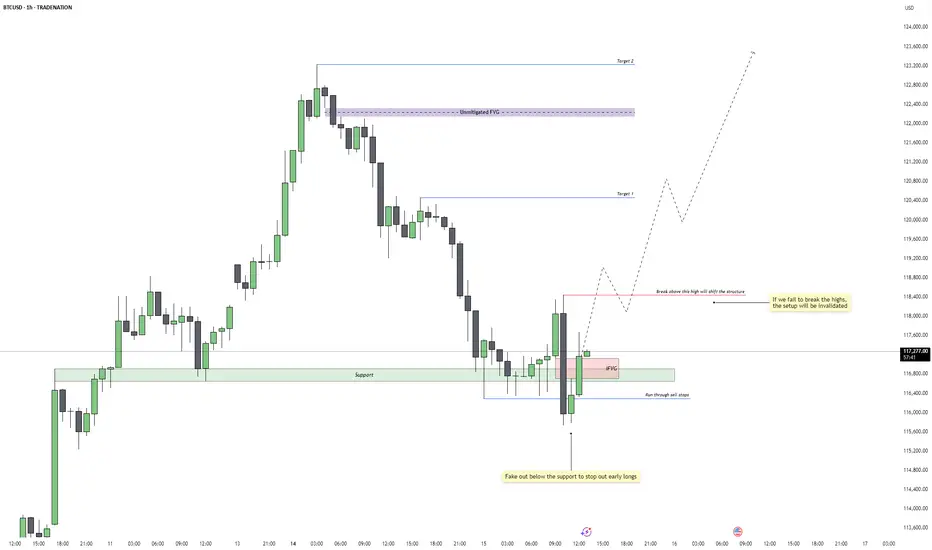
Bitcoin - Reversal Setup or Just a Trap Reset?Price faked below the 1H support zone around 115,800, triggering a clean run through resting sell stops. This classic liquidity sweep flushed out early long positions before immediately reclaiming the range. The move aggressively filled a prior imbalance and flipped sentiment just when it seemed the
Bitcoin - V-shape recovery down towards the 4h FVG at $111.000?The move began with a strong rally that peaked near the $123,000 level. After hitting that high, Bitcoin quickly reversed and sold off aggressively, forming a classic V-shaped pattern. This type of formation typically indicates a strong shift in momentum, where bullish control is quickly overtaken b

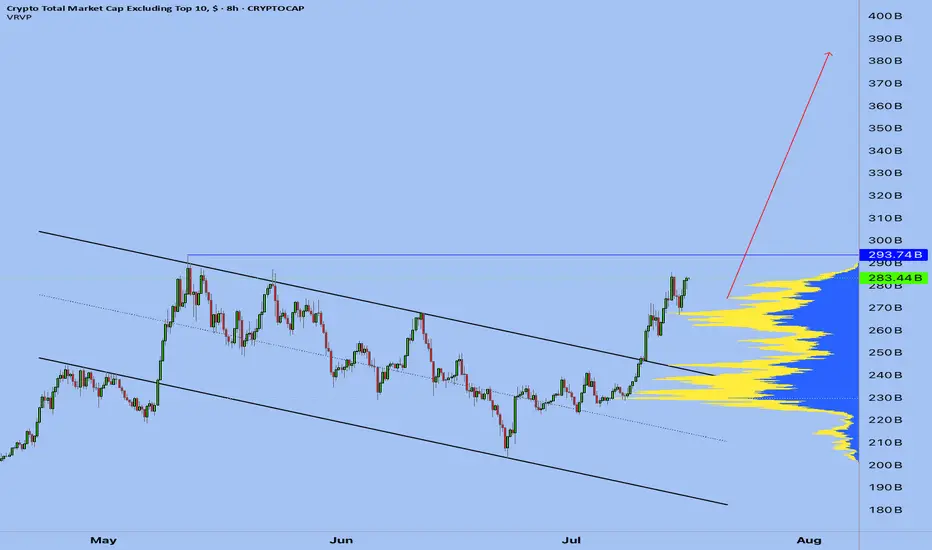
2/ Altseason: Live - My Coin-Picking StrategyThe "Altseason: Live" experiment has unofficially begun. While many are debating if altseason will happen at all, I prefer to act. We may not see a classic, market-wide surge across all coins. The market has changed. But I believe that targeted, explosive opportunities always exist.
In this post, I
BITCOIN Should we still trust the Stock to Flow model??It sure worked perfectly during Bitcoin's (BTCUSD) first Cycles, but the Stock-to-Flow model has greatly diverged from the current price action since March 2024.
Right now the model sits at around $750000, which is vastly above the current market price of $119000. It's been trading sideways actuall

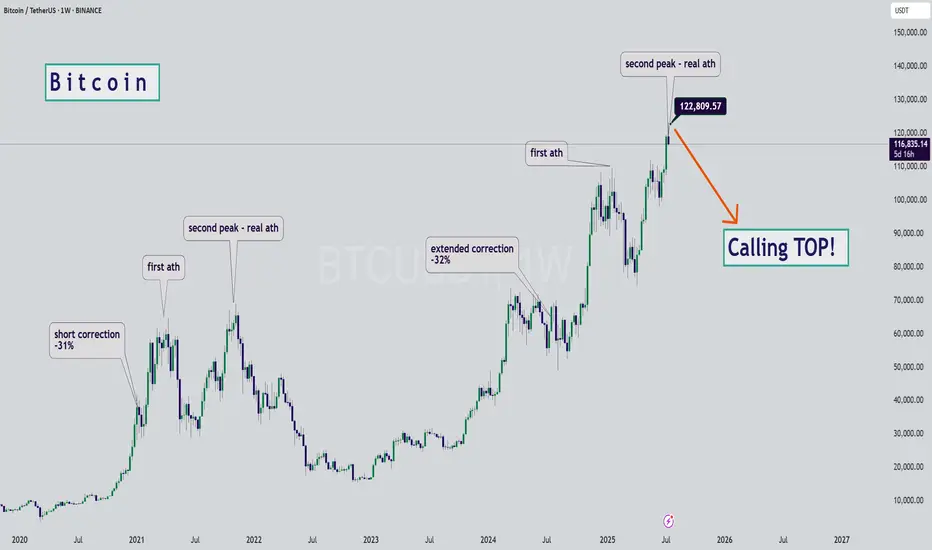
BTC - Calling the Start of the Bearish SeasonHello Watchers ☕
This was my previous Bitcoin update where I had a target of $116K, and also then closed all open positions at $122K:
I'm calling the top here mainly because of the way the chart looks, it really is classic Wyckoff if you look at the duration of the current bullish cycle, which ha
ETH is testing resistance. False breakout?ETH is gathering liquidity ahead of a possible decline
The gray square is the active buying zone. When the price returned below the 3040 level, a liquidation phase occurred. Against the backdrop of the news, a retest of resistance is forming, but not with the aim of breaking through the level, but w

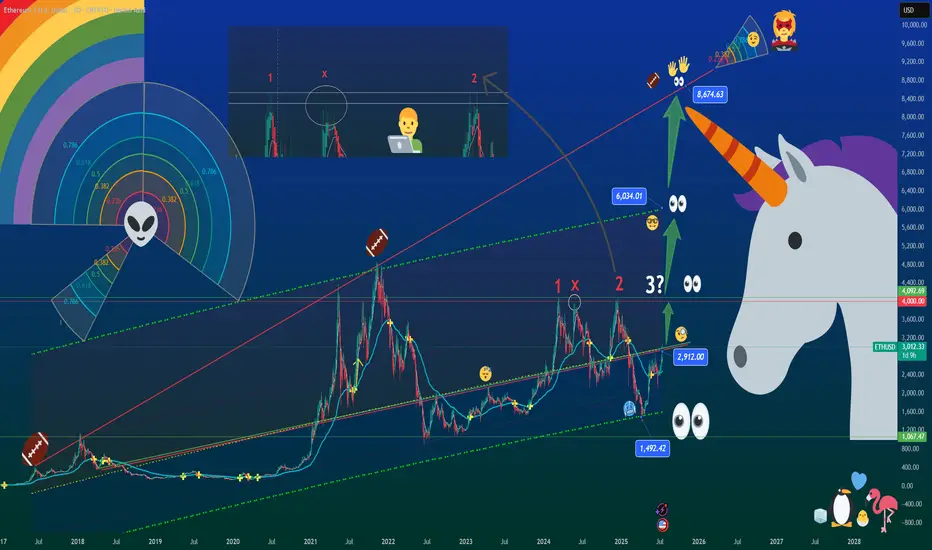
The Unicorn Breakout – Regression, Madness & Meme Math🦄 The Unicorn Breakout – Regression, Madness & Meme Math
FX_Professor | July 14, 2025
🎨 Welcome to my world…
Some draw straight lines.
I draw quadratic regression channels, alien spirals, and unicorns.
Because sometimes, the market is not just math — it’s emotion, storytelling, and madness t
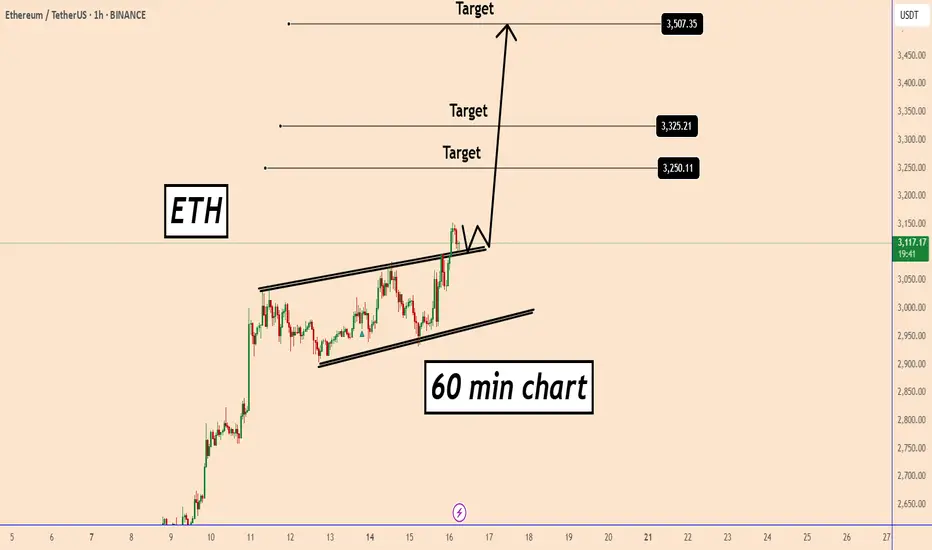
ETH about to reach 3500ETH about to reach 3500
On all time frames ETH is in a clear bullish trend.
Yesterday the price created also a new structure high above the small pattern indicating for a growth on the bullish momentum.
Given that ETH didn't rise for a long time the chances that ETH may start even a bigger bullis
See all crypto ideas
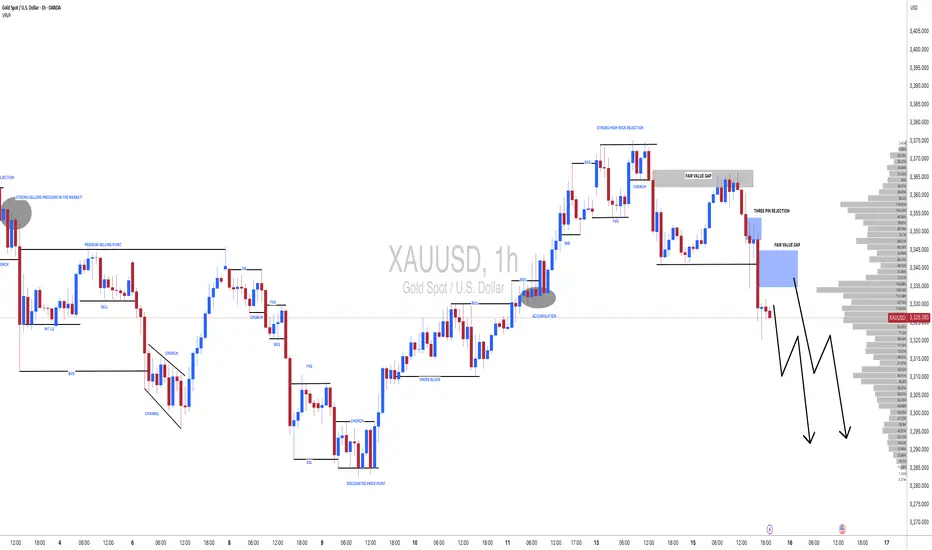
#XAUUSD(GOLD): Strong Sellers Hold, Further Drop Incoming! God dropped from our area of entry yesterday as we initially expected. However, since the massive drop, we are now seeing some short-term correction in the prices. In the coming time, we can expect further price drops around 3280 or 3250.
If you like our idea, please like and comment.
Team Setupsf
GOLD Set for Big Move? | Key Zones + CPI Impact Explained !Gold Analysis – Key Levels + CPI Outlook!
In this video, I broke down the recent rejection from the $3366–$3369 resistance zone, the drop to $3346, and current price action around $3357.
We’ll also look ahead at what to expect with the upcoming CPI report — and how it could shape gold’s next big mo

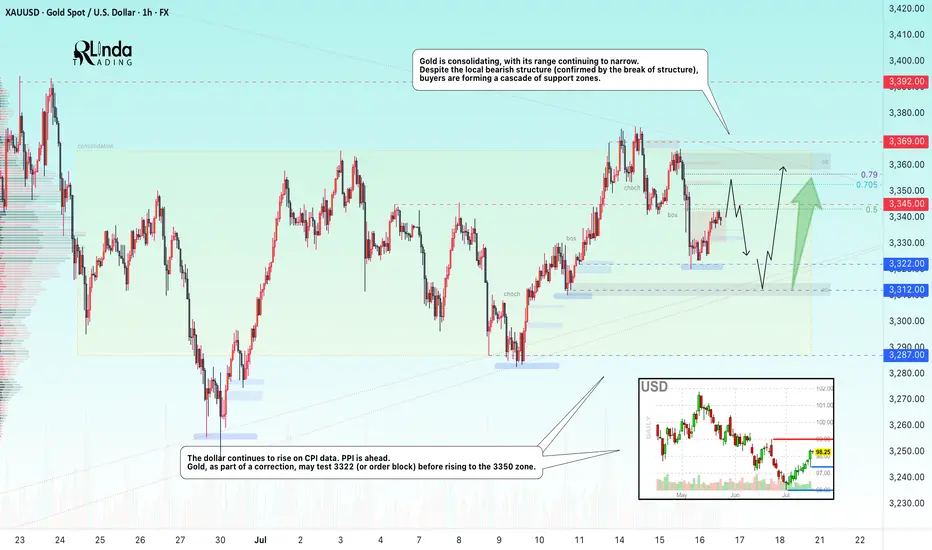
GOLD → Borders are shrinking. Consolidation continues...FX:XAUUSD is adjusting amid controversial CPI data and confirming the local bearish market structure. The PPI is ahead, and gold is consolidating, with its boundaries continuing to narrow...
Gold is recovering slightly but remains under pressure amid rising bond yields and a stronger US dollar
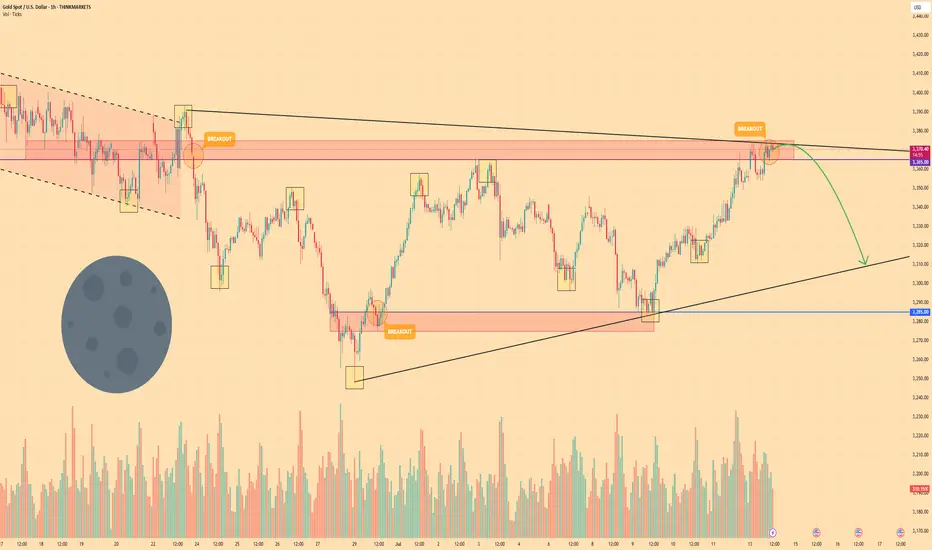
GOLD - Price can start to decline and break support levelHi guys, this is my overview for EURUSD, feel free to check it and write your feedback in comments👊
Gold initially traded inside a steady falling channel, carving lower highs at $3390 and lower lows around $3285 as bears held sway.
A brief fake breakout at $3365 briefly flipped sentiment, but sell
Lingrid | GOLD potential Bullish Move From Confluence ZoneOANDA:XAUUSD is forming a higher low above trend support, following a breakout from the consolidation zone and a bullish continuation leg. Price is currently pulling back toward the 3345–3350 region, which aligns with the previous breakout and key structure support. A successful retest of this area

Using 1 min time frame for entries on VX algo & day tradingwhat time frames do you use to confirm entries outside of a buy signal?
If I am day trading, I will mainly use the 1 minute time frame to look for moving average support and resistance, and read the candle stick patterns as well from that chart.
However, there are times I'll switch to a 5 minute a
Gold Pullback in Play – Still Aiming for 3450 📌 In yesterday’s analysis, I argued that bulls likely won the battle and that a new leg up toward 3450 could be next from a swing trade perspective. I also mentioned that buying dips remains the preferred strategy.
And indeed – we got that dip.
📉 Price pulled back to 3340 and bounced,
but it hasn’

GOLD 1H CHART ROUTE MAP UPDATEHey Everyone,
Quick follow up on our 1H chart idea
We had a nice push up on the chart at the start of the week, coming close but just short of the 3381 gap. Still, it was a solid catch that respected our levels beautifully.
Following that, we cleared our 3353 Bearish Target, which also triggered

Gold 30Min Engaged ( Bullish Reversal Entry Detected )Time Frame: 30-Minute Warfare
Entry Protocol: Only after volume-verified breakout
🩸Bullish Reversal 3329 Zone
➗ Hanzo Protocol: Volume-Tiered Entry Authority
➕ Zone Activated: Dynamic market pressure detected.
The level isn’t just price — it’s a memory of where they moved size.
Volume is rising

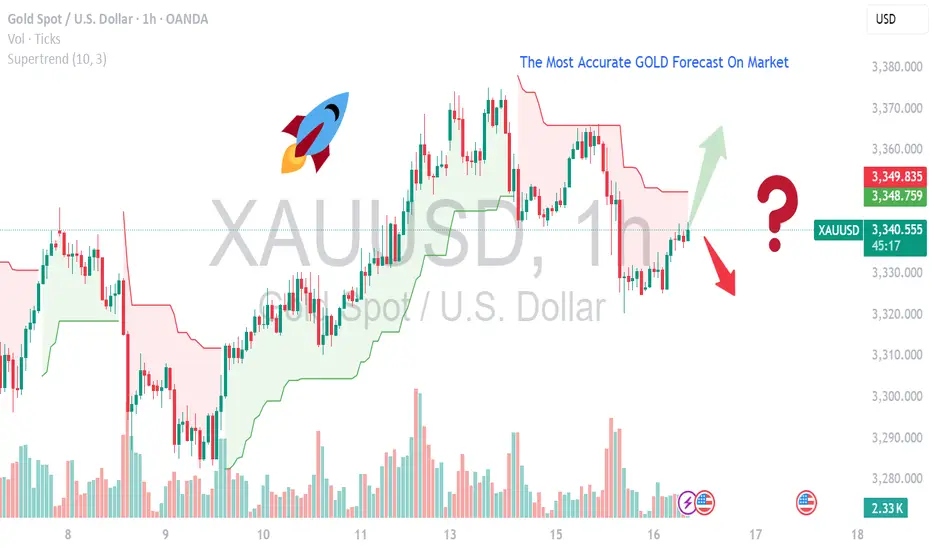
MOST ACCURATE XAUUSD GOLD FORECAST ANALYSIS MARKETCurrent Setup & Technical Outlook
Consolidation & Pennant Formation: Gold is building a bullish pennant and trading above its 50‑day MA — a classic continuation pattern suggesting a breakout toward new highs if momentum resumes .
Key Levels:
Support: $3,330–3,340 — confirmed by multiple technical
See all futures ideas
EURUSDHello Traders! 👋
What are your thoughts on EURUSD?
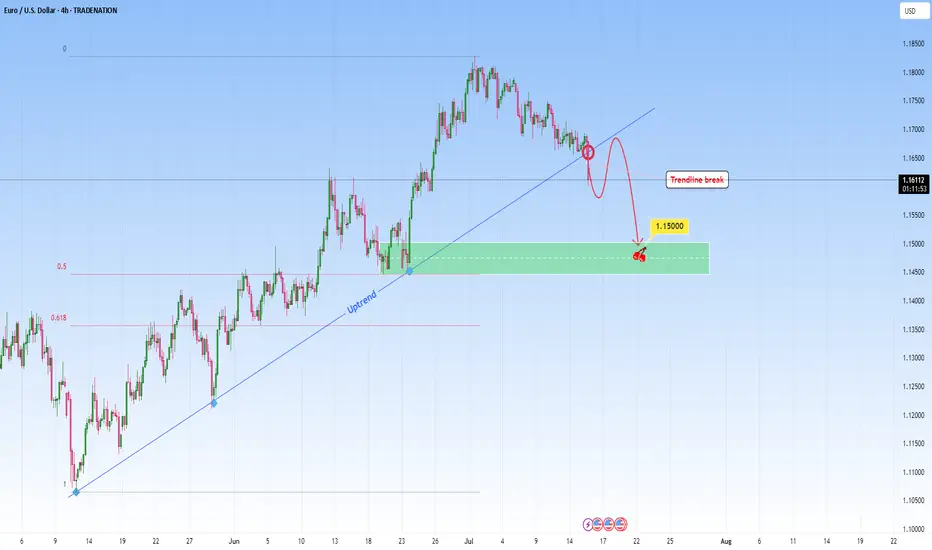
EURUSD has broken support level and its ascending trendline, indicating a possible shift in short-term market structure and growing bearish pressure.
In the short term, we expect a pullback toward the broken support/trendline zone.
If price fails
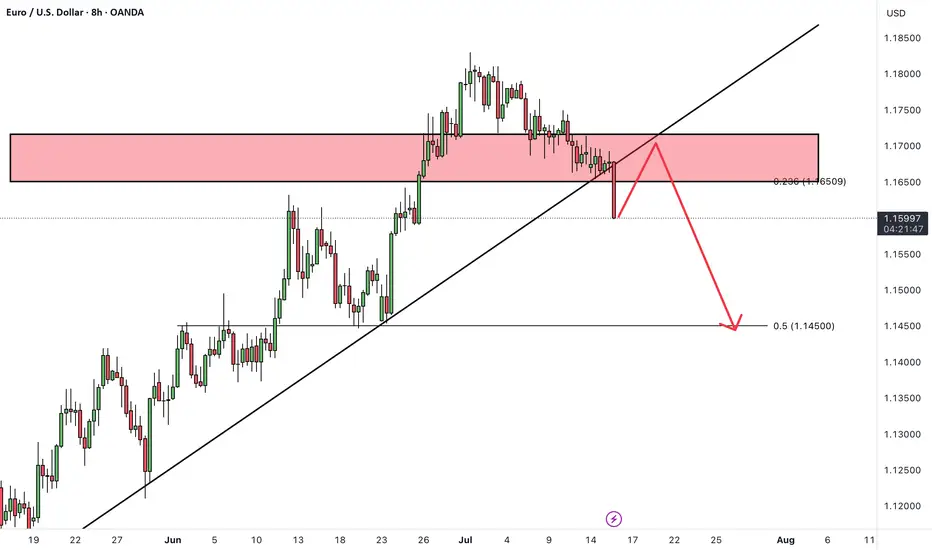
EURUSD: Sell Opportunity after Trendline breakEURUSD was in a steep uptrend but it might stop with this recent break through the uptrend. A break like this one on a strong trendline that had multiple touches, indicates either a potential reversal or major pause in the trend. This candle that broke the trendline signals the first hint of structu
GBPUSD I Weekly CLS to be completed I Target Key LevelYo Market Warriors ⚔️
GBPUSD is going to complete WCLS, in to the key level. In COT data we see shorts being added which is taking net positions down. Intraday shorts model 0 are possible, Its early to long.
if you’ve been riding with me, you already know:
🎯My system is 100% mechanical. No emotio

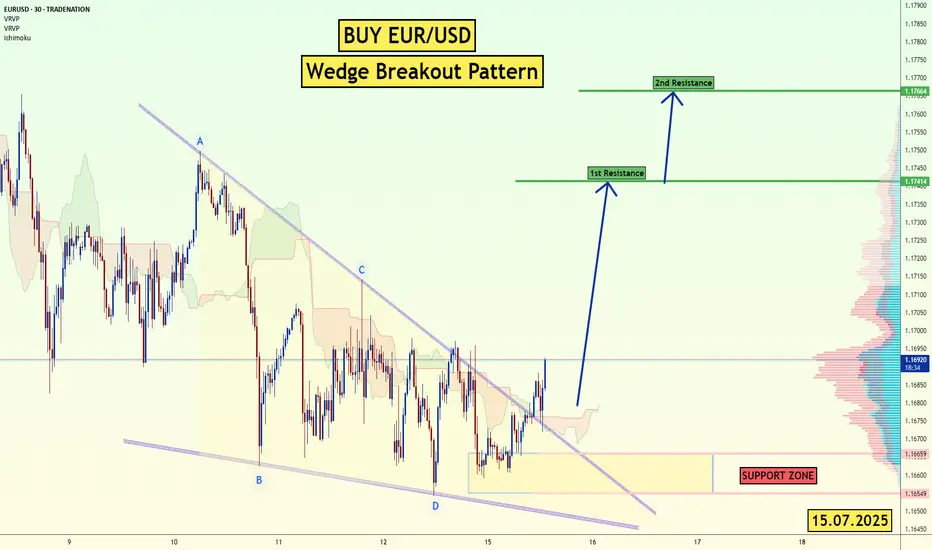
EUR/USD - Wedge Breakout (CPI- Today) 15.07.2025 The EUR/USD pair on the M30 timeframe presents a Potential Buying Opportunity due to a recent Formation of a Wedge Breakout Pattern. This suggests a shift in momentum towards the upside and a higher likelihood of further advances in the coming hours.
Possible Long Trade:
Entry: Consider Entering
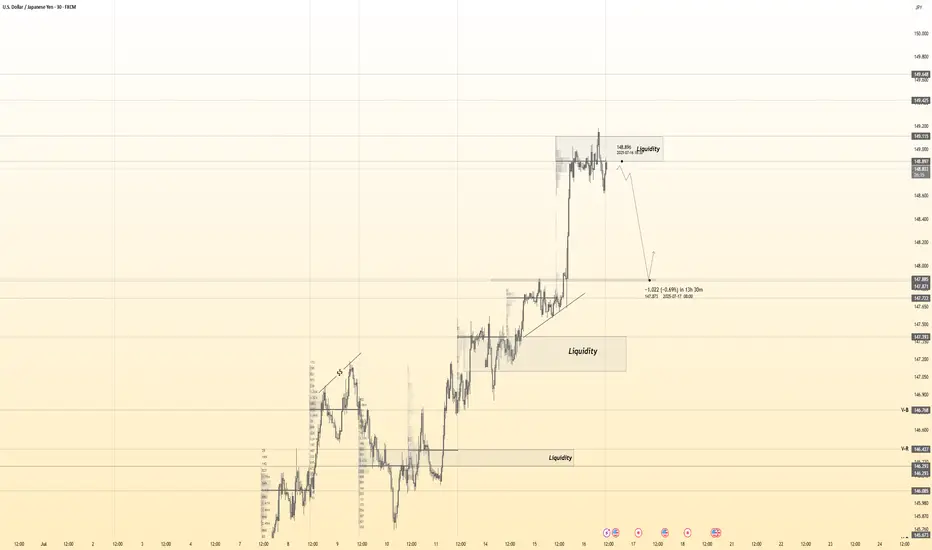
USDJPY 30Min Engaged ( Bearish Entry Detected )Time Frame: 30-Minute Warfare
Entry Protocol: Only after volume-verified breakout
🩸Bearish move from : 148.900 Zone
➗ Hanzo Protocol: Volume-Tiered Entry Authority
➕ Zone Activated: Dynamic market pressure detected.
The level isn’t just price — it’s a memory of where they moved size.
Volume is r
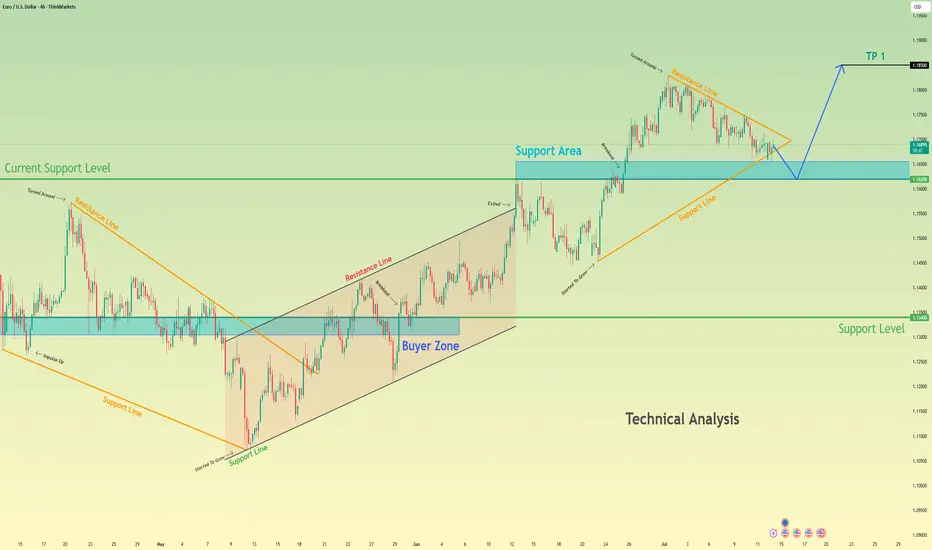
Euro may fall to support area and then start to growHello traders, I want share with you my opinion about Euro. The price previously moved inside a wedge formation, where it tested the buyer zone and showed a strong reaction from this area. After that, the pair broke out upward and started to trade inside an upward channel, building momentum and form
EURUSD Bearish Ahead as US Resilience Meets Eurozone FragilityEURUSD has shifted into bearish territory, pressured by growing divergence between a resilient US economy and a struggling Eurozone. The pair recently rejected the 1.1700 zone, forming multiple bearish structures on the 4H chart. With sticky US inflation, Trump’s renewed tariff agenda, and a dovish

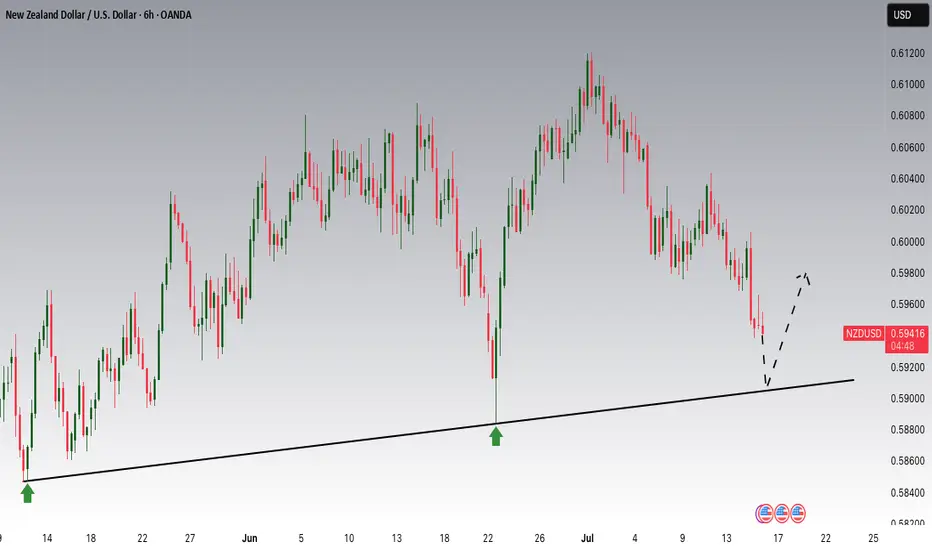
NZDUSD is Nearing an Important SupportHey Traders, in today's trading session we are monitoring NZDUSD for a buying opportunity around 0.59100 zone, NZDUSD is trading in an uptrend and currently is in a correction phase in which it is approaching the trend at 0.59100 support and resistance area.
Trade safe, Joe.
EURUSD Under Pressure After Hot CPI – More Downside Ahead?Today, the US released key inflation figures :
Core CPI m/m: 0.2% (vs 0.3% forecast)
CPI m/m: 0.3% (as expected)
CPI y/y: 2.7% (vs 2.6% forecast, up from 2.4%)
Fundamental Analysis ( EURUSD ):
The slightly lower Core CPI suggests some easing in underlying inflation pressures. However,
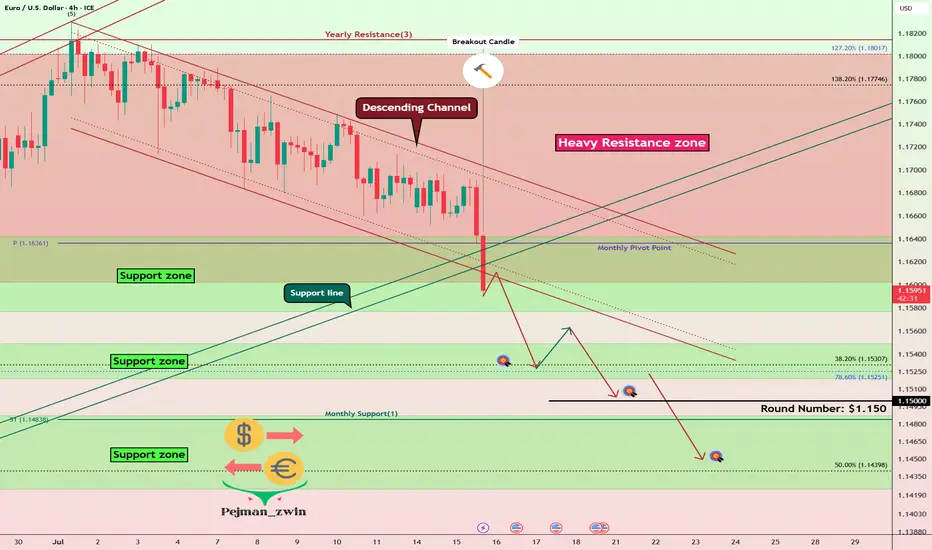
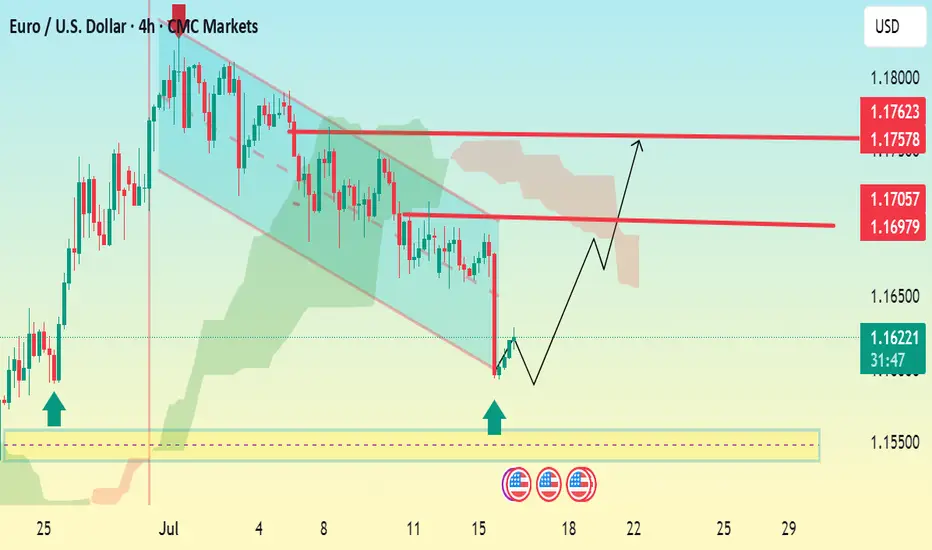
EUR/USD 4H Bullish Reversal Setup Analysis:The chart shows a falling wedge pattern, a typical bullish reversal signal.
Price has broken out of the wedge, suggesting a potential trend reversal to the upside.
Two strong demand zones (highlighted with blue arrows and yellow box) show strong buying pressure around 1.15500–1.15700.
The Ichimok
See all forex ideas
| - | - | - | - | - | - | - | ||
| - | - | - | - | - | - | - | ||
| - | - | - | - | - | - | - | ||
| - | - | - | - | - | - | - | ||
| - | - | - | - | - | - | - | ||
| - | - | - | - | - | - | - | ||
| - | - | - | - | - | - | - | ||
| - | - | - | - | - | - | - |
Trade directly on the supercharts through our supported, fully-verified and user-reviewed brokers.


