Meta Platforms (META) Shares DeclineMeta Platforms (META) Shares Decline
Shares of the US tech giant Meta Platforms (META) hit a record high last week, climbing above $780 following the release of a strong earnings report:
→ Earnings per share (EPS) came in at $7.14, significantly exceeding the forecast of $5.88.
→ The company also

The best trades require research, then commitment.
Get started for free$0 forever, no credit card needed

Scott "Kidd" PoteetThe unlikely astronaut

Where the world does markets
Join 100 million traders and investors taking the future into their own hands.

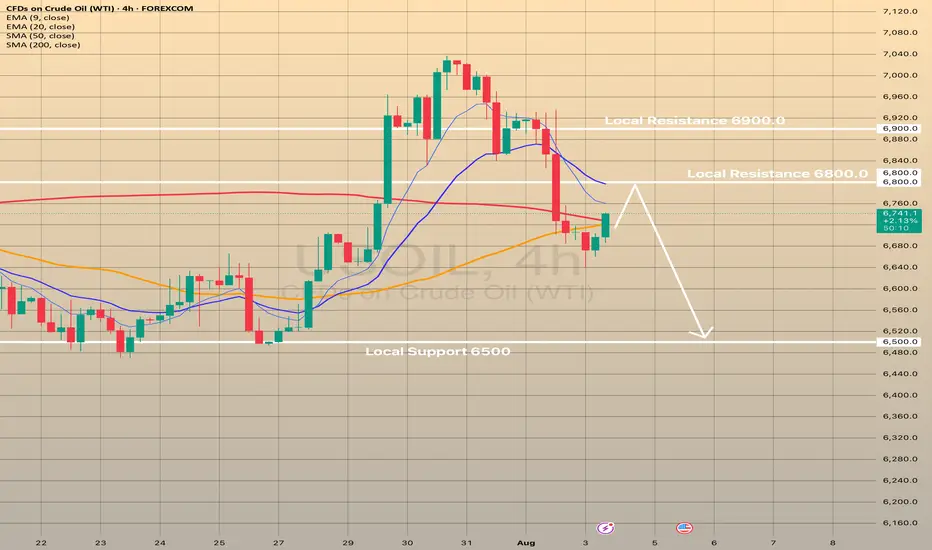
USOIL declines for the 3 days in a row. What's next?USOIL declines for the 3 days in a row. What's next?
Since the last post the USOIL has already declined on 2.5%, currently rebounding from SMA50 on 4-h chart. 2 main reasons are behind this.
On August 3, the Organization of the Petroleum Exporting Countries and their partners, collectively known
Figma Stock Goes Parabolic in Market Debut — Should You Buy?Figma stock NYSE:FIG more than tripled on IPO day. But that’s not thanks to the Figma guys — they had agreed to sell the company to Adobe NASDAQ:ADBE just two years ago.
Figma stock NYSE:FIG made a spectacular entrance into public markets last week — and then some. Shares of the design softw

ATEC - NEW 52-WEEK HIGHATEC - CURRENT PRICE : 13.77
ATEC made a new 52-week high last Friday with burst in trading activity. Look at the volume pointed by red arrows. On 31 Oct 2024 there was a significant gap up with high volume, from there the stock continue rises - indicating strong buying interest. Now same scenario

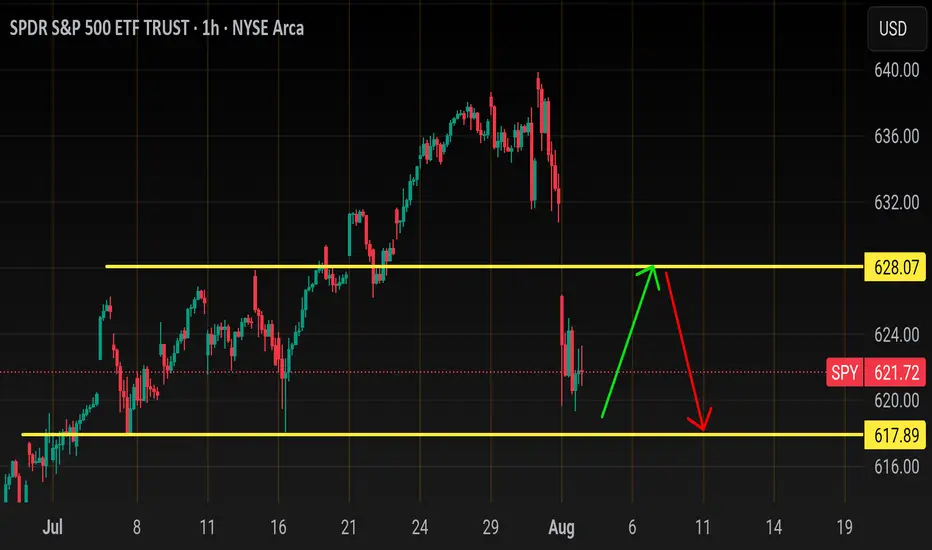
SpySo.... I'm looking for a rebound this week early on from Smallcaps, banks, and cyclical. All last week everything non tech sold off.. it all started with TVC:NYA hitting this monthly trendline
As you can see, this has been resistance for about 5yrs and every time it has tagged , a correction
XRP 4H – Double Bottom… or Just Another Lower High?
XRP bounced cleanly from major support — the same zone that sparked its last leg up.
This could mark the early stages of a double bottom or just another bear market rally before continuation.
🔹 Previous top = strong supply rejection
🔹 Current support = high-volume bounce zone
🔹 Stoch RSI turning

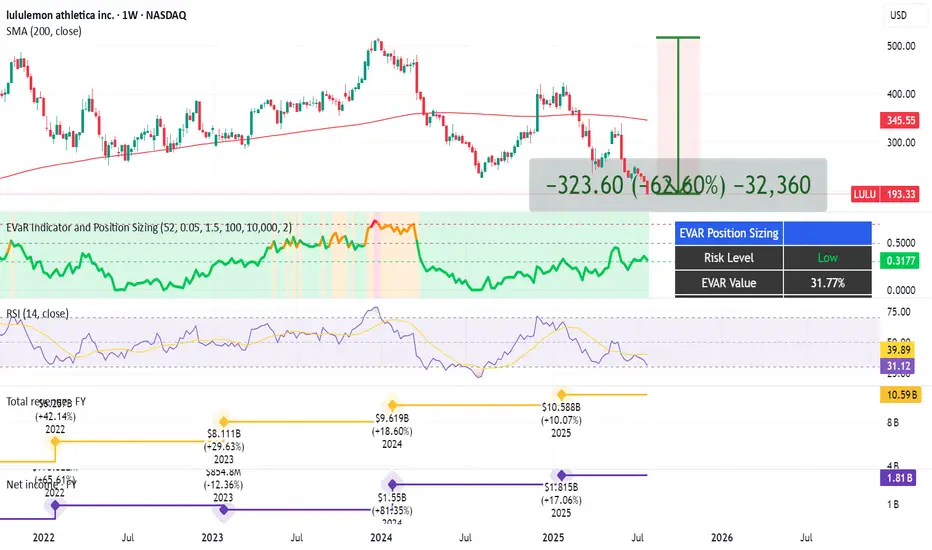
Yoga Pants, Tariffs, and Upside: The $LULU BetLululemon NASDAQ:LULU - My Investment Thesis 👖
Hey team,
I've been keeping an eye on NASDAQ:LULU for a while, and I'm finally going to pull the trigger.
In this market of overhyped MAG 7 stocks, Lululemon dropped 62% since its high in Dec. 2023 until now.
Here's why I'm into LULU:
Revenu
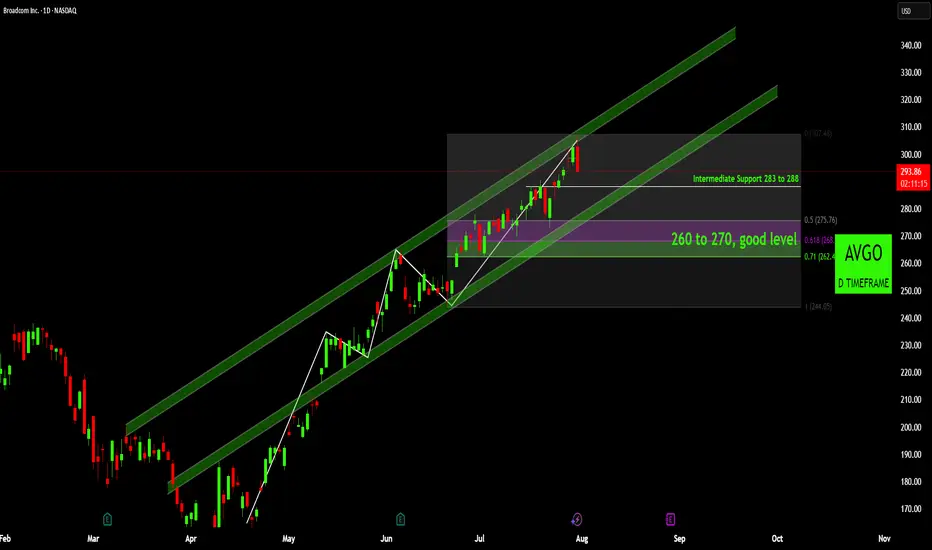
Broadcom (AVGO): Is This the Dip You've Been Waiting For?Broadcom (AVGO) has been demonstrating a remarkably strong bullish trend since early April, carving out a clear path of higher highs and higher lows. This robust upward momentum is well-defined by a series of ascending channels.
Trend and Channel Dynamics:
Initially, we observed price action mov
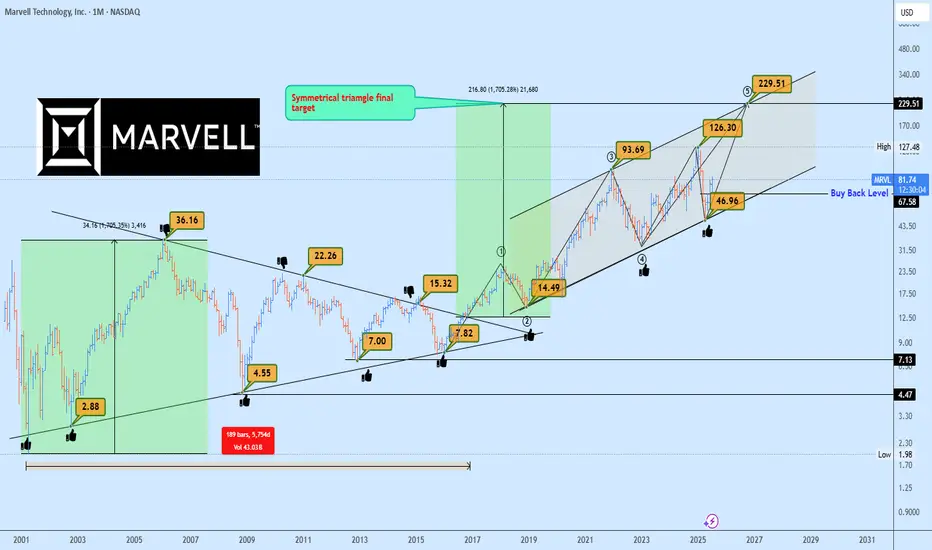
MRVL Massive 15-Years Symmetrical Breakout Targets AheadMarvell Technology (MRVL) has just completed a monumental breakout from a 15-years symmetrical triangle, a rare and powerful long-term accumulation structure. This type of macro consolidation typically precedes a major directional expansion, and in this case, the breakout confirmed bullish continuat
TSLA Long-Term Bold Projection (2025-2035)This is a long-term analysis of Tesla (TSLA) stock on the weekly timeframe, combining Elliott Wave Theory, Fibonacci extensions, and price structure (base formations) within a broad logarithmic trend channel.
Key Highlights:
🔹 Base Formations:
Base 1 (2010–2013): First consolidation before TSLA’s

See all editors' picks ideas
Trading Report Generator from CSVMany people use the Trading Panel. Unfortunately, it doesn't have a Performance Report. However, TradingView has strategies, and they have a Performance Report :-D
What if we combine the first and second? It's easy!
This script is a special strategy that parses transactions in csv format from Paper

Smart Money Breakout Channels [AlgoAlpha]🟠 OVERVIEW
This script draws breakout detection zones called “Smart Money Breakout Channels” based on volatility-normalized price movement and visualizes them as dynamic boxes with volume overlays. It identifies temporary accumulation or distribution ranges using a custom normalized volatility me

Trend Range Detector (Zeiierman)█ Overview
Trend Range Detector (Zeiierman) is a market structure tool that identifies and tracks periods of price compression by forming adaptive range boxes based on volatility and price movement. When prices remain stable within a defined band, the script dynamically draws a range box; when p

BE-Indicator Aggregator toolkit█ Overview:
BE-Indicator Aggregator toolkit is a toolkit which is built for those we rely on taking multi-confirmation from different indicators available with the traders. This Toolkit aid's traders in understanding their custom logic for their trade setups and provides the summarized results o

Synthetic VX3! & VX4! continuous /VX futuresTradingView is missing continuous 3rd and 4th month VIX (/VX) futures, so I decided to try to make a synthetic one that emulates what continuous maturity futures would look like. This is useful for backtesting/historical purposes as it enables traders to see how their further out VX contracts would'

Intrabar Efficiency Ratio█ OVERVIEW
This indicator displays a directional variant of Perry Kaufman's Efficiency Ratio, designed to gauge the "efficiency" of intrabar price movement by comparing the sum of movements of the lower timeframe bars composing a chart bar with the respective bar's movement on an average ba

Strategy█ OVERVIEW
This library is a Pine Script™ programmer’s tool containing a variety of strategy-related functions to assist in calculations like profit and loss, stop losses and limits. It also includes several useful functions one can use to convert between units in ticks, price, currency or a per

Signs of the Times [LucF]█ OVERVIEW
This oscillator calculates the directional strength of bars using a primitive weighing mechanism based on a small number of what I consider to be fundamental properties of a bar. It does not consider the amplitude of price movements, so can be used as a complement to momentum-based osc

Estimated Time At Price [Kioseff Trading]Hello!
This script uses the same formula as the recently released "Volume Delta" script to ascertain lower timeframe values.
Instead, this script looks to estimate the approximate time spent at price blocks; all time estimates are in minute.second format.
The image above shows functionality.

Volume Profile, Pivot Anchored by DGTVolume Profile (also known as Price by Volume ) is an charting study that displays trading activity over a specified time period at specific price levels. It is plotted as a horizontal histogram on the finacial isntrumnet's chart that highlights the trader's interest at specific price levels. Specif

See all indicators and strategies
Community trends
Figma Stock Goes Parabolic in Market Debut — Should You Buy?Figma stock NYSE:FIG more than tripled on IPO day. But that’s not thanks to the Figma guys — they had agreed to sell the company to Adobe NASDAQ:ADBE just two years ago.
Figma stock NYSE:FIG made a spectacular entrance into public markets last week — and then some. Shares of the design softw
I am bullish on GOOGLE stockI am bullish on GOOGLE stock
Following last week's pullback, I see a positive ride back to the all-time high (ATH) around $209 or beyond.
Trade with care.
I look forward to connecting with you.
Please share your thoughts in the comment section, share, like and follow

ATEC - NEW 52-WEEK HIGHATEC - CURRENT PRICE : 13.77
ATEC made a new 52-week high last Friday with burst in trading activity. Look at the volume pointed by red arrows. On 31 Oct 2024 there was a significant gap up with high volume, from there the stock continue rises - indicating strong buying interest. Now same scenario
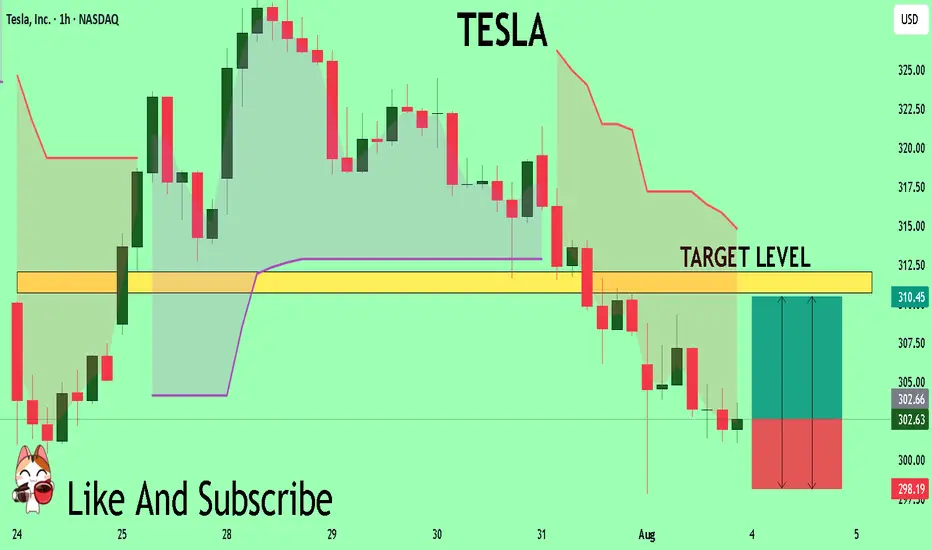
TESLA Sellers In Panic! BUY!
My dear friends,
TESLA looks like it will make a good move, and here are the details:
The market is trading on 302.63 pivot level.
Bias - Bullish
Technical Indicators: Supper Trend generates a clear long signal while Pivot Point HL is currently determining the overall Bullish trend of the mar
$NVDA’s Moves Weren’t Exactly SubtleUltraShort signals on NASDAQ:NVDA nailed key tops at $185, $182, and $177, each followed by sharp retracements that cooled off aggressive buyers. On the flip side, UltraBuy signals around $170, $172, and $174 teed up solid rebounds just as momentum threatened to fade. Price chopped around the 50/2

SPOT: Rebounding Off the 150 SMA -- Upper Channel Next?SPOT (Spotify) has been trading within a well-defined ascending parallel channel since late 2022. The recent dip brought price action close to the lower boundary of the channel, right at the 150-day moving average, which acted as support several times in the past.
This confluence between trendline

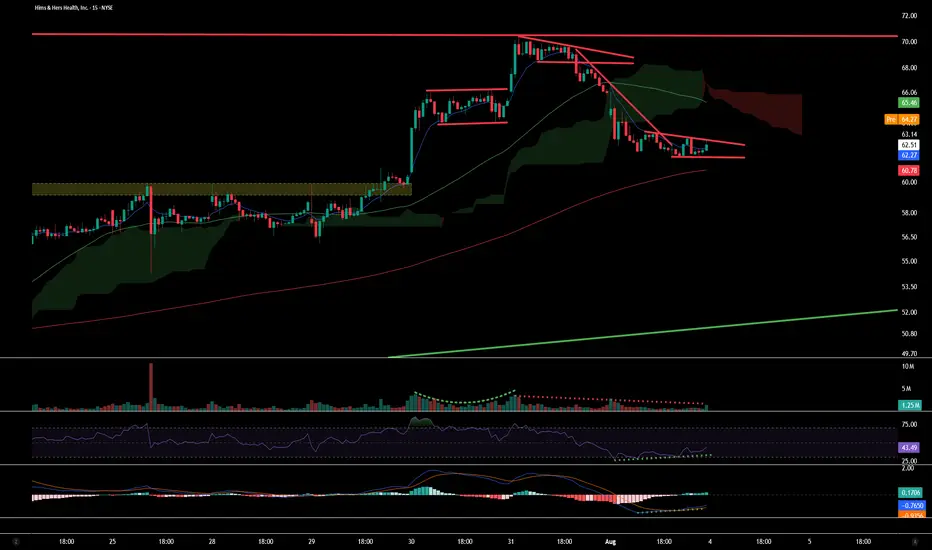
$HIMS TANYSE:HIMS on the Daily Chart still with an ascending triangle - with resistance at $72-$70 - is still being respected with price touching the top trendline, with weakening volume, an evening star which is suggesting trend exhaustion from the rally from the 23rd June, succeeding the 30% drop from th
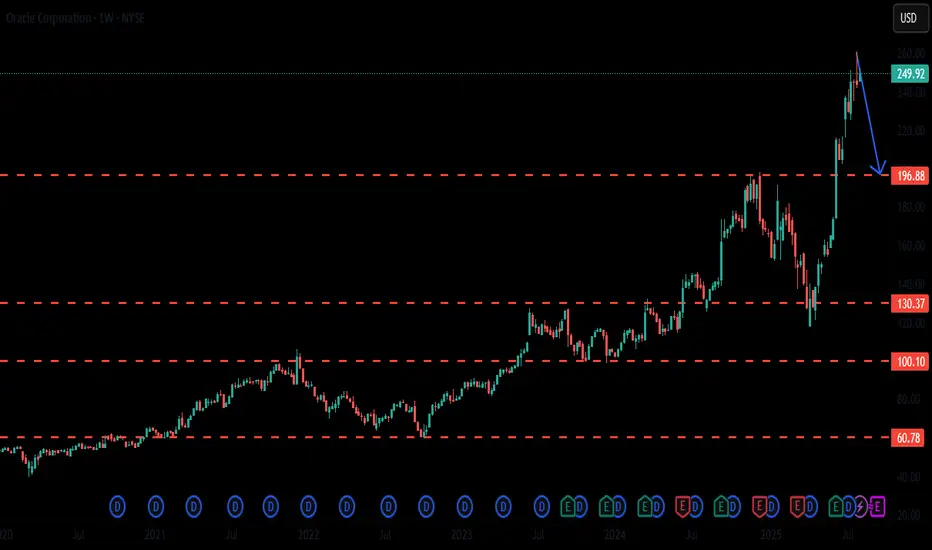
Next entry point for ORLCThe last strong support was at 130$.
I'm waiting for a big correction, so the next entry point will be at 190$ - 195$. This is corresponding with the 50 Fib retracement.
What do you think?
A Jade Lizard Play for Earnings (4-dte) on PLTR.
This is 4-DTE with a wide $140 short Put and $170 Short Call spread.
A slightly bullish strategy combining an out-of-the-money short put and out-of-the-money bear call spread. When created properly, this strategy has no upside risk. It is best suited for oversold stocks with high implied volati

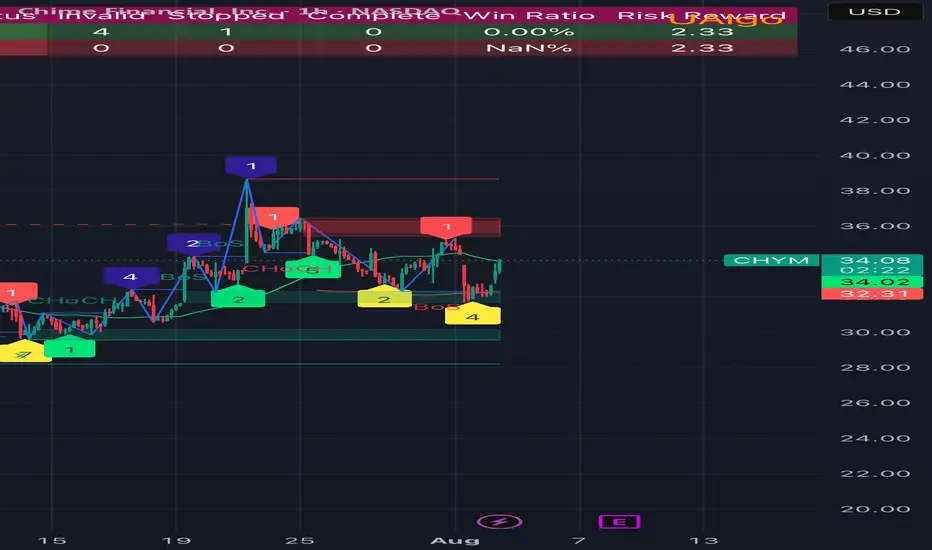
Chym options plays🔎 Chart Analysis (1H)
• Current price: ~$34
• Support: 32–33 zone (recent bounce area)
• Resistance: 35–36, then 40 (major target)
• Structure: Multiple BoS (Break of Structure) and CHoCH levels show accumulation and trend reversal signs.
• Bias: If it holds above 32, the move toward 40 looks p
See all stocks ideas
Today
HSICHenry Schein, Inc.
Actual
—
Estimate
1.19
USD
Today
DDDuPont de Nemours, Inc.
Actual
—
Estimate
1.06
USD
Today
EPCEdgewell Personal Care Company
Actual
—
Estimate
0.99
USD
Today
MDPediatrix Medical Group, Inc.
Actual
—
Estimate
0.42
USD
Today
ATKRAtkore Inc.
Actual
—
Estimate
1.58
USD
Today
FLOCFlowco Holdings Inc.
Actual
—
Estimate
0.31
USD
Today
LDOSLeidos Holdings, Inc.
Actual
—
Estimate
2.66
USD
Today
YOUClear Secure, Inc.
Actual
—
Estimate
0.29
USD
See more events
Community trends
BTC - Short Setup at 0.702 Fibonacci & Fair Value GapMarket Context
Bitcoin recently rejected from a major resistance area and has since been retracing downward, finding temporary support inside a bullish Fair Value Gap. The market is currently in a corrective phase, with buyers attempting to defend lower levels while sellers look for optimal positio

Bitcoin Preparing for Explosive Breakout Toward $167KBitcoin is currently respecting a clean trendline resistance following a bullish pennant formation. Price is holding firmly above the neckline breakout from the inverse head and shoulders (ISHS), confirming demand strength around the $111K–$113K region. The structure implies another 48% rally projec

Bitcoin Hits $40,000, It Will Recover —Name Your AltcoinSorry, there is a typo there on the title, I meant to say: Bitcoin hits $114,000, soon to recover.
As you can see from our trading range, Bitcoin just went beyond the lower boundary and hit a new low, the lowest since 10-July but there is good news. There isn't room for prices to move much lower, t
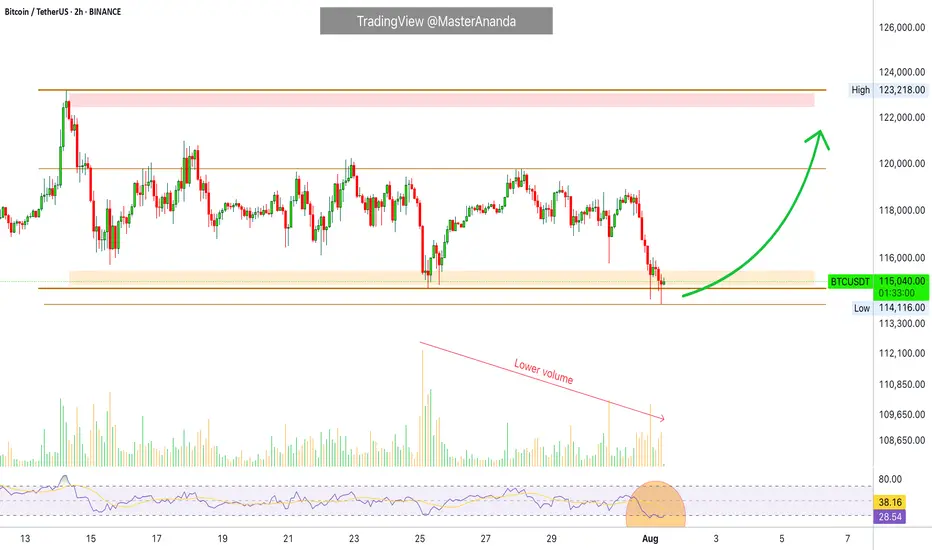
Bitcoin: 113K Support Bounce Buy Signal.Bitcoin has retraced thanks mostly to "unexpected" revisions to labor market statistics. While this move has many making outrageous forecasts, price has simply retraced to the 113K support levels and has generated a swing trade long signal (break of 114K). IF the momentum stays intact, it is within

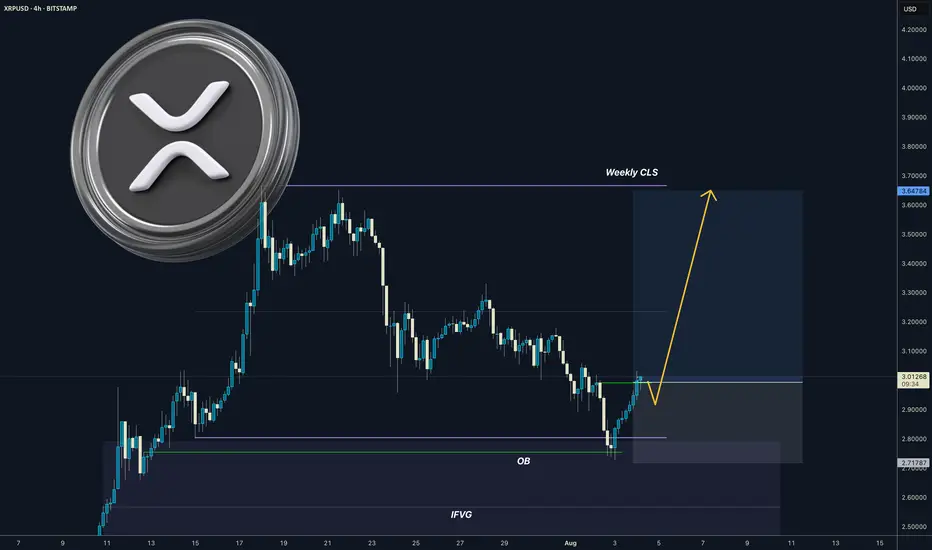
XRP I Weekly CLS I Model 1 I OB confirmations - Highs in playYo Market Warriors ⚔️
Fresh Crypto Analysis— if you’ve been riding with me, you already know:
🎯My system is 100% mechanical. No emotions. No trend lines. No subjective guessing. Working all timeframes. Just precision, structure, and sniper entries.
🧠 What’s CLS?
It’s the real smart money. The i
Adding to our first bitcoin sell position now We are adding to our first sell position on bitcoin because we are to see more sell off from here

BTC Breaks Down: Retest Could Lead to More LossesHello guys!
Bitcoin has officially broken below the descending channel it was stuck in for weeks. Right now, price is pulling back to retest the broken channel, which is now acting as resistance around the 114,700 zone.
What I'm watching:
Broken channel = bearish signal
Retest zone around 1

ADA has broken out from a key structure zone near 0.7780ADA - CARDANO, has broken out from a key structure zone near 0.7780
As long as the price remains below this level, the likelihood of a decline toward 0.6490 and potentially 0.5580 remains elevated.
This bearish potential is further supported by BTC, which appears to be entering a broader correcti

Bitcoin - Imbalance Fill Before Liquidity ExpansionBitcoin is trading inside a compressing structure beneath a clean descending trendline. Price action has been choppy but controlled, creating multiple zones of inefficiency that remain unfilled. We’re currently positioned between two major Fair Value Gaps, one above and one below, which gives us a c

BITCOIN PREDICTION: THIS Breaks - and BTC WILL CRASH TO HERE!!!!Yello Paradisers! I’m sharing my Bitcoin prediction with you. We’re using technical analysis on TradingView, specifically Elliott Wave theory.
On the ultra-high time frame, we noticed a Shooting star candlestick pattern. We’re analyzing the channel where the zigzag formation is occurring.
We’re

See all crypto ideas
Lingrid | GOLD Weekly Market Analysis: Strong Bullish ReboundOANDA:XAUUSD market has demonstrated resilience with a strong bullish rebound following the NFP, suggesting that institutional buyers are stepping in at critical support levels. The precious metal is now testing key resistance zones that will determine whether the recovery can gain sustainable mome

XAUUSDHello Traders! 👋
What are your thoughts on GOLD?
Gold saw a strong rally on Friday following the U.S. Non-Farm Payrolls (NFP) report and is now trading near a key resistance zone.
At this resistance, a short-term pullback is likely as traders lock in profits.
We expect the correction to be containe

Gold 30Min Engaged ( Bullish & Bearish Entry Detected )Time Frame: 30-Minute Warfare
Entry Protocol: Only after volume-verified breakout
🩸Bullish From now Price - 3354
🩸Bearish Reversal : 3400
➗ Hanzo Protocol: Volume-Tiered Entry Authority
➕ Zone Activated: Dynamic market pressure detected.
The level isn’t just price — it’s a memory of where they mo

GOLD ROUTE MAP UPDATEHey Everyone,
Great start to the week with our chart idea playing out, as analysed.
We got our Bullish target 3370 hit and now waiting for ema5 lock to confirm gap to 3392. Failure to lock will see lower Goldturns tested for suport and bounce, inline with our plans to buy dips.
We will keep the

GOLD → Consolidation after the rally...FX:XAUUSD is not falling back after a strong rally, but is consolidating against resistance at 3362.8. Continued high demand could allow the market to strengthen...
The price of gold halted its two-day rally, trading around $3362.8 on Monday morning after weak US employment data. This heighten

Gold Eyes QML Resistance: Ready for a PullbackHelloooo!
Gold, after gapping up strongly, has now entered the green QML (Quasimodo Level) supply zone at roughly 3,380–3,390. This zone has acted as resistance before, so a reaction here makes perfect sense.
What I see:
Engulfed Level (3,315.66): Earlier support that got taken out. This is our

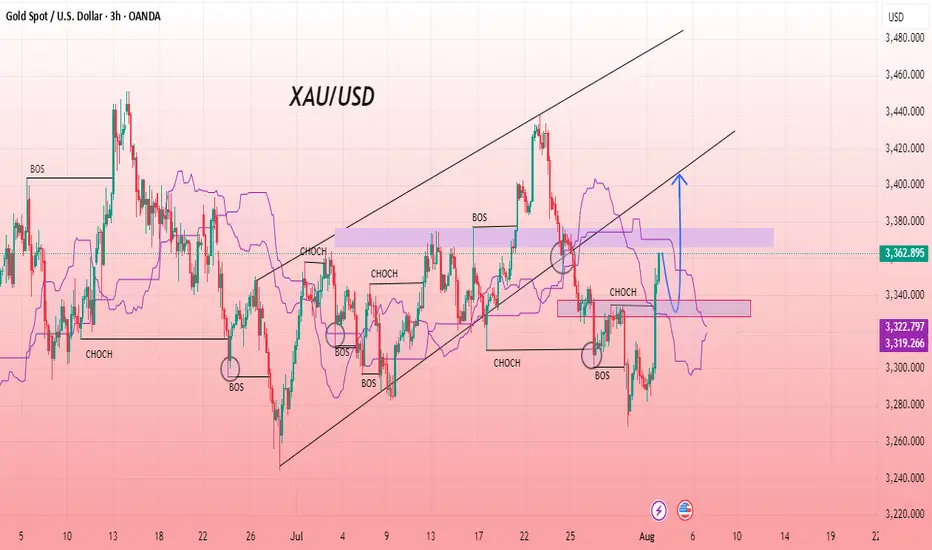
XAU/USD Bullish Setup Building MomentumGold has reclaimed bullish momentum after a strong bounce from the recent demand zone around 3319–3322. The chart shows a clear Change of Character (CHOCH) and subsequent Break of Structure (BOS), suggesting buyers are regaining control. Price is now trading above the Ichimoku cloud, further confirm
GOLD undecided: Looking for a positive outlookThe current market context on GOLD seems undecided and heavily influenced by news release and macroeconomic catalysts. The recent reversal from the support was pretty decisive, catching short-sellers off guard and forcing them to cover positions.
However, the structure has yet to produce a clean b

Gold Bearish Breakdown Setup – Targeting 3324 ZoneGold is showing a potential bearish setup on the 1-hour chart. A break below the key support zone at 3345 could trigger a downward move toward the target at 3324.579. Price action suggests a possible lower high formation before the drop.

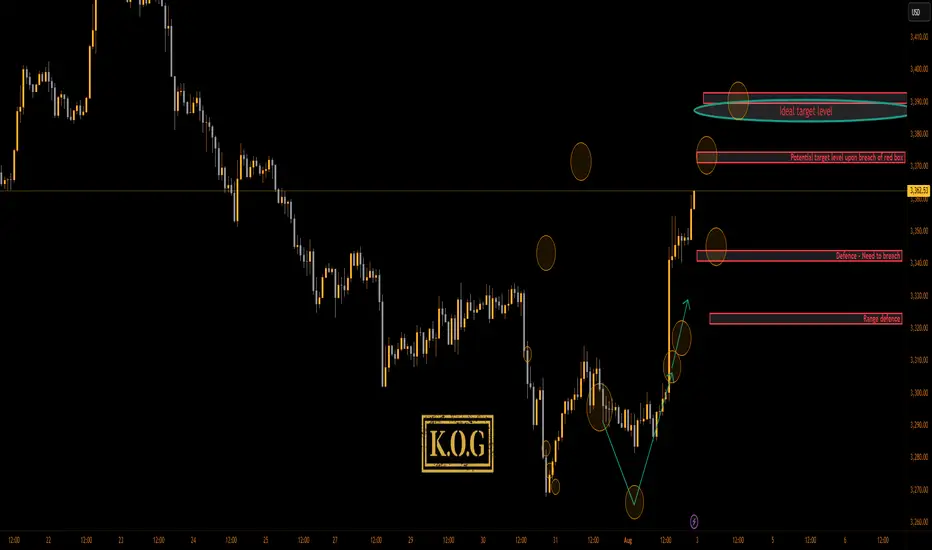
THE KOG REPORT - NFP UPDATE 1H 1H:
This is the chart we used last week for the FOMC and NFP KOG Reports. From the chart we can see the low was captured for FOMC and NFP didn’t give us an undercut low. We’ve kept the potential target box from the Report and for now we’ll stick with it. Red box defence is active below at the 3
See all futures ideas
EURUSD - Major resistance ahead with the fair value gaps!The EUR/USD pair remains firmly within a prevailing downtrend, characterized by a consistent pattern of lower highs and lower lows. This bearish momentum has resulted in the formation of several significant Fair Value Gaps (FVGs) on the 4-hour chart, which now act as potential resistance zones on an

USDJPY I Weekly CLS Range I Model 1 I COT is BullishYo Market Warriors ⚔️
Fresh outlook drop — if you’ve been riding with me, you already know:
🎯My system is 100% mechanical. No emotions. No trend lines. No subjective guessing. Just precision, structure, and sniper entries.
🧠 What’s CLS?
It’s the real smart money. The invisible hand behind $7T/d

EURUSD rises again amid growing Fed rate cut expectationsEURUSD rises again amid growing Fed rate cut expectations
On Friday, U.S. job data (NFP) showed an increase of just 73,000 for July—far below forecasts. This weak result suggests deeper problems in the labor market.
Many financial institutions now expect the Federal Reserve to cut interest rates

GBPJPY: More Growth is Coming! 🇬🇧🇯🇵
GBPJPY will likely bounce from a key daily support,
following a formation of a double bottom pattern
on an hourly time frame.
I think that the price will reach 196.7 level soon.
❤️Please, support my work with like, thank you!❤️
I am part of Trade Nation's Influencer program and receive a mon

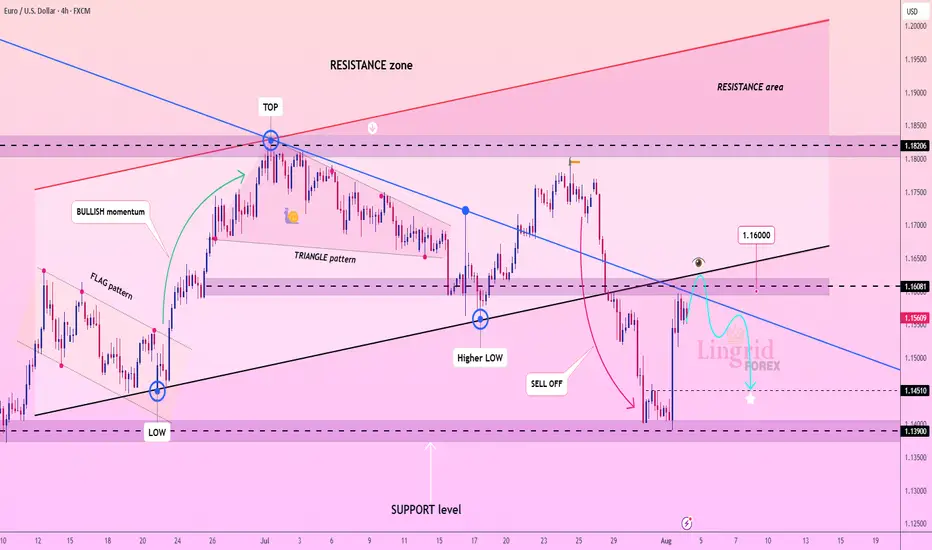
Lingrid | EURUSD Confluence Zone: Shorting Opportunity. The price perfectly fulfilled my previous idea . FX:EURUSD is pulling back toward a confluence of resistance formed by the broken upward trendline and the descending channel boundary. Price structure suggests a lower high beneath the $1.16081 zone after a sharp sell-off from the July peak. As lon
AUDUSD Breakout and Potential RetraceHey Traders, in today's trading session we are monitoring AUDUSD for a buying opportunity around 0.64700 zone, AUDUSD was trading in a downtrend and successfully managed to break it out. Currently is in a correction phase in which it is approaching the retrace area at 0.64700 support and resistance

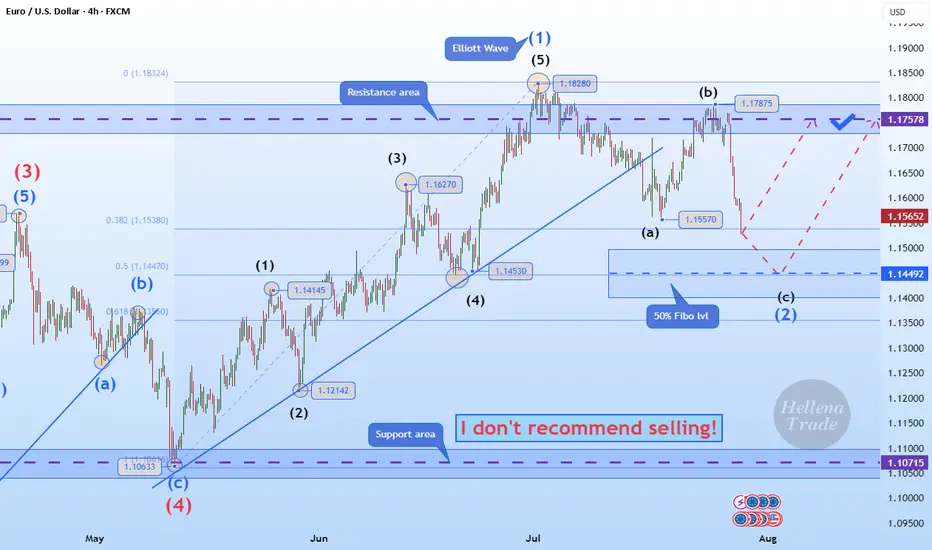
Hellena | EUR/USD (4H): LONG to the resistance area 1.17578.Colleagues, the price has made a strong downward movement, which can only mean one thing: the correction is not complete.
This means that the latest upward movement is wave “1” of medium order.
Therefore, I now expect the correction to end in wave “2” at the 50% Fibonacci level and thean upward mov
GBP/USD Bearish Wedge Breakdown Setup Targeting 1.31873This is a 1-hour GBP/USD chart showing a bearish setup. Price is currently at resistance (1.32719) within a rising wedge pattern. Multiple black arrows suggest potential bearish breakdown scenarios targeting 1.31873, with a deeper drop possible toward 1.31410. The red path indicates a less likely bu

EURUSD – Retest in Play After NFP Reversal?EURUSD started last week with a heavy bearish tone, dropping 200 pips on Monday alone — which is quite a move for such a typically stable pair.
After a brief consolidation around the neckline support of the recent double top, sellers came back in, pushing the pair down to 1.1400 by Friday — a level

USDCHF – Bullish comeback in progress?Hey everyone! What’s your take on the current trend of USDCHF?
While the pair experienced a recent dip, take a step back and look at the bigger picture — doesn’t it still seem to be moving within an ascending channel?
Right now, USDCHF is hovering around 0.8092 and starting to bounce back. The rec

See all forex ideas
| - | - | - | - | - | - | - | ||
| - | - | - | - | - | - | - | ||
| - | - | - | - | - | - | - | ||
| - | - | - | - | - | - | - | ||
| - | - | - | - | - | - | - | ||
| - | - | - | - | - | - | - | ||
| - | - | - | - | - | - | - | ||
| - | - | - | - | - | - | - |
Trade directly on the supercharts through our supported, fully-verified and user-reviewed brokers.


