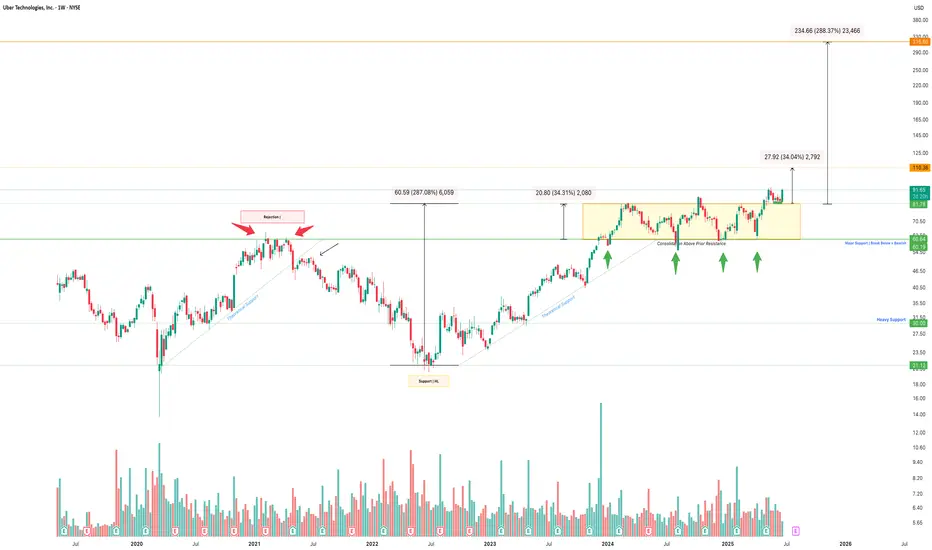
Ride UBER to $300.00 The chart of Uber Technologies Inc. (UBER) showcases a multi-year bullish setup following a prolonged accumulation phase and key breakout signals:
Consolidation: The stock entered a horizontal consolidation phase above previous resistance, now acting as strong support ($60–$80), confirmed by multip

The best trades require research, then commitment.
Get started for free$0 forever, no credit card needed

Scott "Kidd" PoteetThe unlikely astronaut

Where the world does markets
Join 100 million traders and investors taking the future into their own hands.
Bitcoin Analysis 23-Jun-25Bitcoin price in the weekend retested around 98,500$, this drop was mainly supported by the fear in the markets due to the escalations in the Middle East, & the US taking part in the War.
In this short analysis video, we will be discussing the Areas of interest and possible price movement we coul

Coffee just gave a two-bar reversal to go long6 23 25 oil just went higher presumably from what happened with Tehran... and I heard several people say that oils going a lot higher. I really don't believe that but more importantly we can use some of the tools on the chart to decide when to take trades as a buyer and a seller. there's a cl

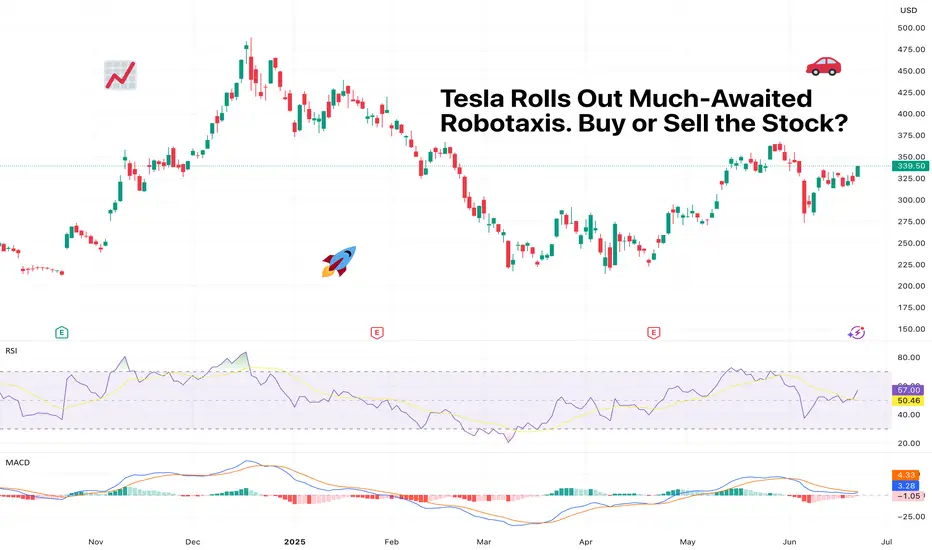
Tesla Rolls Out Much-Awaited Robotaxis. Buy or Sell the Stock?They’re here. After years of tweets, teasers, and timelines that aged like unrefrigerated dairy, Tesla NASDAQ:TSLA officially launched its long-awaited robotaxi service in Austin, Texas.
The self-driving revolution, we were told, would arrive like a lightning bolt. Instead, it quietly rolled up
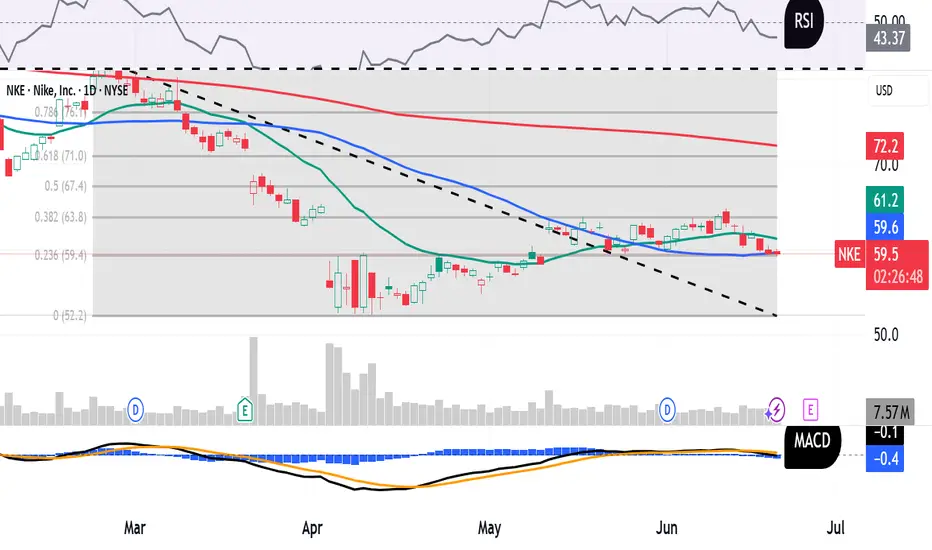
Will Nike’s Upcoming Earnings ‘Just Do It’ for Investors?This hasn’t been the greatest year for Nike NYSE:NKE , which will report earnings next Thursday at a time when the stock is down more than 20% year to date. What does technical and fundamental analysis say might happen to the stock from here?
Let’s take a look:
Nike’s Fundamental Analysis
NKE
Is Alt season dead? - June 2025Let me start by saying, Youtube influencers are lying to you. The collective narrative (from those links shared with me) talk almost exclusively about the same set of narratives for triggering “alt season”:
M2 money supply. The printer will be turned on any minute.
The FED is going to cut rat

Bitcoin Long: Going for Final Wave 5 of 5Bitcoin has hit the previous target and even breached lower. Now I believe the time has come to go long again with the stop just below recent low of around $98,500 and the take profit target as the old high of $112,000.
Good luck!

US Missiles Flyin'! Buy USD vs EUR GBP AUD NZD CAD CHF JPY!This is the FOREX futures outlook for the week of Jun 22-28th.
In this video, we will analyze the following FX markets:
USD Index, EUR, GBP, AUD, NZD, CAD, CHF, and JPY.
The USD is the world's reserve currency. When there are geo-political hot spots in the world, the USD sees inflows from investo

Multi-Timeframe Analysis & Trend Continuation TradingThe EURJPY has recently violated an important level of structure leading us to make the prediction of price continuing to go higher.
In this video we'll take a look at where the next stopping point may be and what I'm waiting for the market to do in order to get involved in the trade.
If you hav

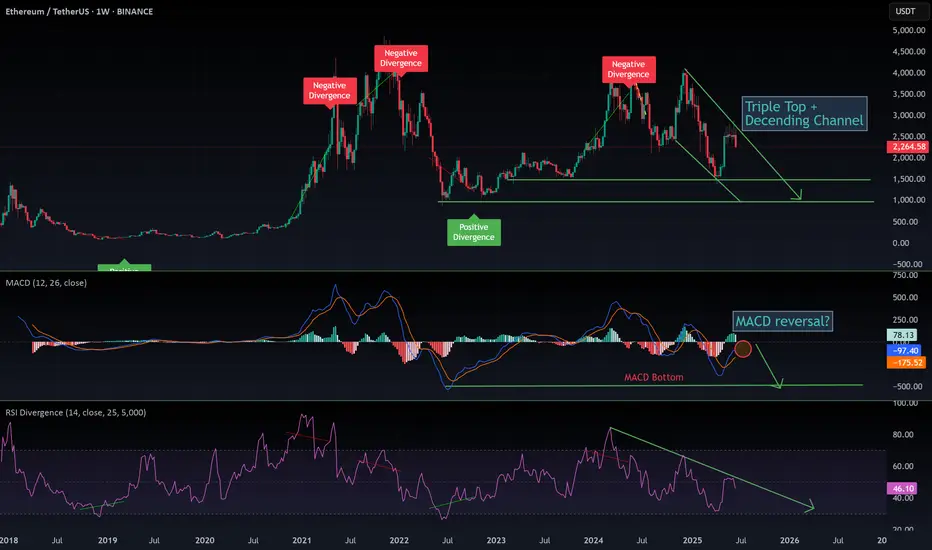
$ETH: The 1-week chart is an absolute disaster!Once again, I want to make it clear: I’m naturally a bull. But I live in Thailand, far from the noise of influencers shouting "buy, buy, buy!" I’ve learned my lesson—when they scream buy, you get rekt. That’s why I rely solely on the charts.
Charts are just mathematics—they don’t lie. So here’s my
See all editors' picks ideas
Advanced Fed Decision Forecast Model (AFDFM)The Advanced Fed Decision Forecast Model (AFDFM) represents a novel quantitative framework for predicting Federal Reserve monetary policy decisions through multi-factor fundamental analysis. This model synthesizes established monetary policy rules with real-time economic indicators to generate proba

Timeframe LoopThe Timeframe Loop publication aims to visualize intrabar price progression in a new, different way.
🔶 CONCEPTS and USAGE
I got inspiration from the Pressure/Volume loop, which is used in Mechanical Ventilation with Critical Care patients to visualize pressure/volume evolution during inhal

Deviation Trend Profile [BigBeluga]🔵 OVERVIEW
A statistical trend analysis tool that combines moving average dynamics with standard deviation zones and trend-specific price distribution.
This is an experimental indicator designed for educational and learning purposes only.
🔵 CONCEPTS
Trend Detection via SMA Slope: Detect

Rolling Z-Score Trend [QuantAlgo]🟢 Overview
The Rolling Z-Score Trend measures how far the current price deviates from its rolling mean in terms of standard deviations. It transforms price data into standardized scores to identify overbought and oversold conditions while tracking momentum shifts.
The indicator displays a Z-S

Yelober - Sector Rotation Detector# Yelober - Sector Rotation Detector: User Guide
## Overview
The Yelober - Sector Rotation Detector is a TradingView indicator designed to track sector performance and identify market rotations in real-time. It monitors key sector ETFs, calculates performance metrics, and provides actionable stock

TASC 2025.07 Laguerre Filters█ OVERVIEW
This script implements the Laguerre filter and oscillator described by John F. Ehlers in the article "A Tool For Trend Trading, Laguerre Filters" from the July 2025 edition of TASC's Traders' Tips . The new Laguerre filter utilizes the UltimateSmoother filter in place of an exponenti

Trend Impulse Channels (Zeiierman)█ Overview
Trend Impulse Channels (Zeiierman) is a precision-engineered trend-following system that visualizes discrete trend progression using volatility-scaled step logic. It replaces traditional slope-based tracking with clearly defined “trend steps,” capturing directional momentum only when

Magnificent 7 OscillatorThe Magnificent 7 Oscillator is a sophisticated momentum-based technical indicator designed to analyze the collective performance of the seven largest technology companies in the U.S. stock market (Apple, Microsoft, Alphabet, Amazon, NVIDIA, Tesla, and Meta). This indicator incorporates established

SmartPhase Analyzer📝 SmartPhase Analyzer – Composite Market Regime Classifier
SmartPhase Analyzer is an adaptive regime classification tool that scores market conditions using a customizable set of statistical indicators. It blends multiple normalized metrics into a composite score, which is dynamically evaluated

ATR RopeATR Rope is inspired by DonovanWall's "Range Filter". It implements a similar concept of filtering out smaller market movements and adjusting only for larger moves. In addition, this indicator goes one step deeper by producing actionable zones to determine market state. (Trend vs. Consolidation)
>

See all indicators and strategies
Community trends
Ride UBER to $300.00 The chart of Uber Technologies Inc. (UBER) showcases a multi-year bullish setup following a prolonged accumulation phase and key breakout signals:
Consolidation: The stock entered a horizontal consolidation phase above previous resistance, now acting as strong support ($60–$80), confirmed by multip
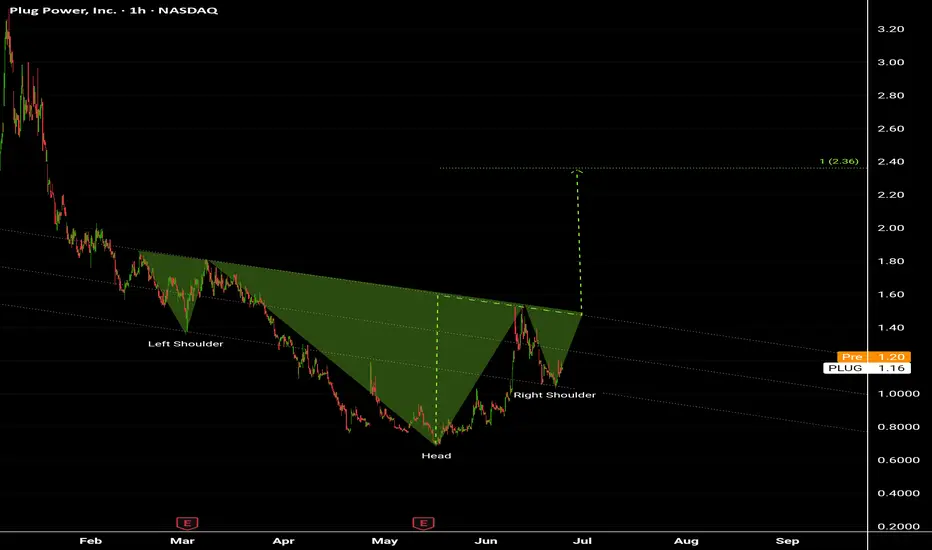
Plug Power Inc. (PLUG) Inverted Head and Shoulders pattern at the bottom.
Target price as shown on the Chart and could be much more .
Highly recommended for Buying this stock Today 👌
Buy it now as much as you can take.
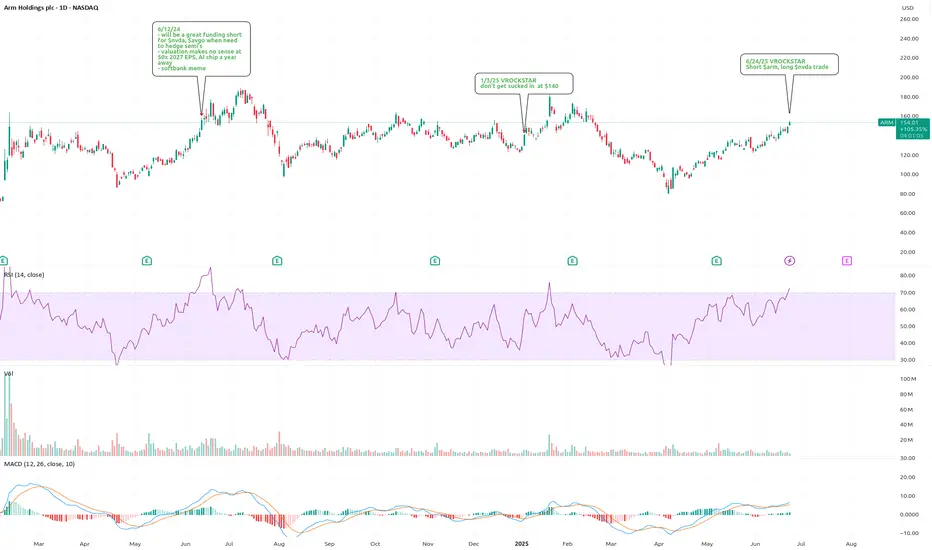
6/24/25 - $arm - Short $arm, long $nvda trade6/24/25 :: VROCKSTAR :: NASDAQ:ARM
Short NASDAQ:ARM , long NASDAQ:NVDA trade
- the trade that keeps on giving
- NASDAQ:ARM on it's NASDAQ:NVDA pair (ARM/NVDA) has only been down and do the right, the chart is not something you'd want to step in front of unless you knew of "why" it would fu
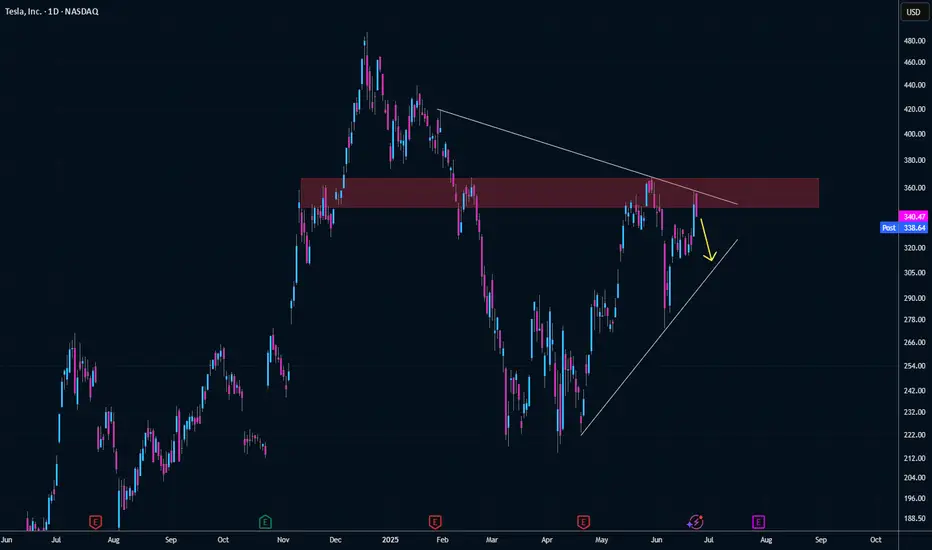
Pull-back Post Austin LaunchNot quite a dark cover cloud candlestick today but given how strong the Nasdaq was today and NASDAQ:TSLA slumped is a fairly pathetic price action on day 2 post Austin launch.
IMO a lot of shorts were on the sidelines until robotaxi commenced. They waited for the pop and now feel more confident i
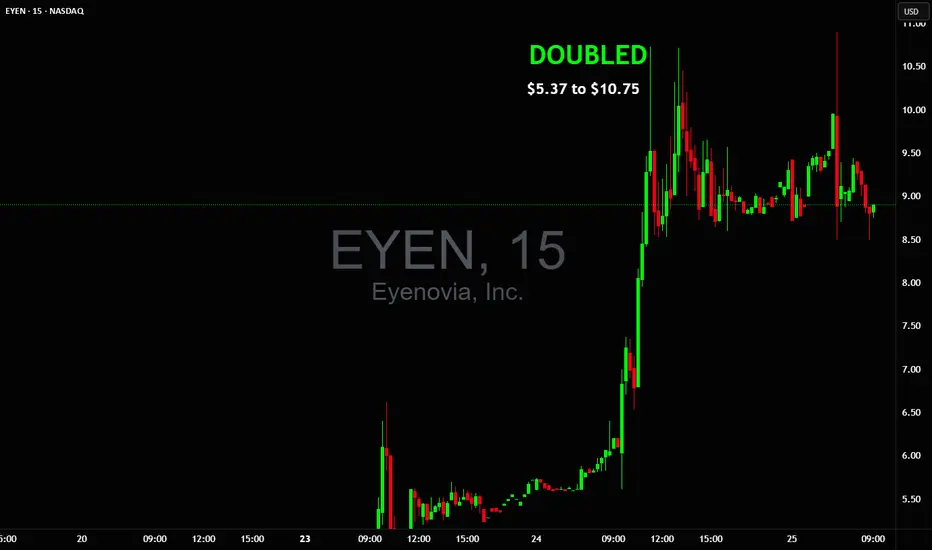
Ready for a new day, please bring another doubler like $EYENReady for a new day, please bring another doubler like NASDAQ:EYEN $5 to $10 or NYSE:SRFM yesterday which were the only 2 trades made and 2 nice wins🙏🏻
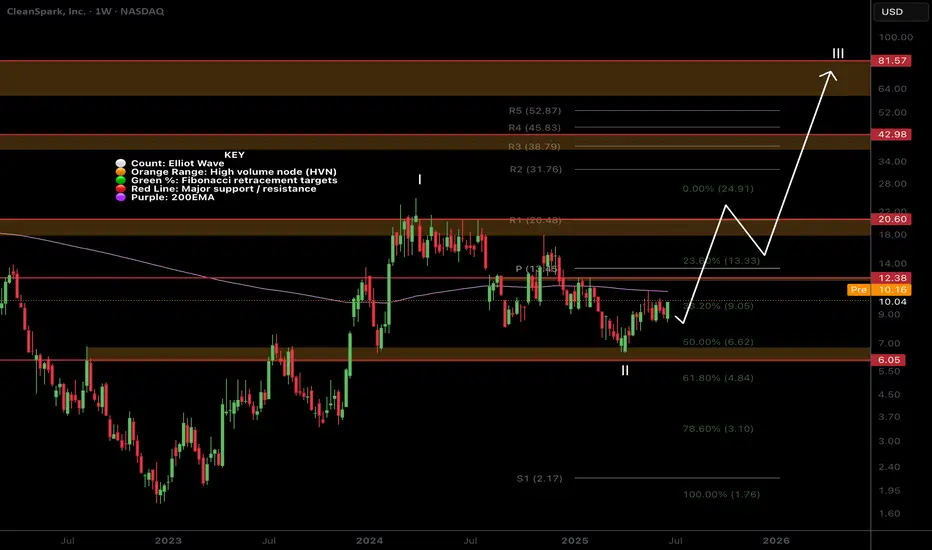
CLSK Finally Ready for a strong move up?Price printed a textbook motif wave 1 and ABC wave 2 correction ending at the 61.8 Fibonacci retracement golden pocket and High Volume Node (HVN) major support.
Price continues to flirt with weekly 200EMA and looks ready for another test as resistance on the local chart.
The weekly pivot still loo
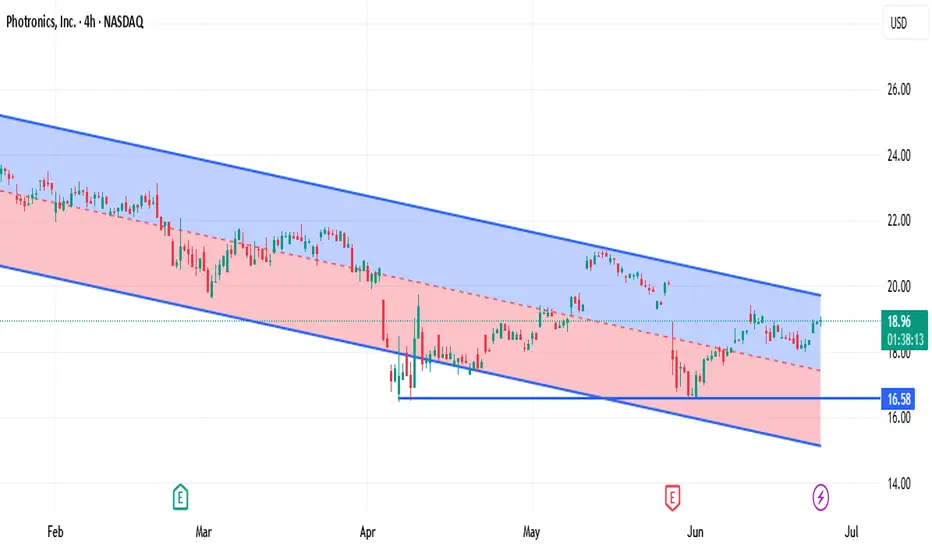
Undervalued with strong margins and market positioning
Attractive entry point: Improved margins and undervaluation make it a compelling buy
Pricing power: Dominates the photomask niche in semiconductors, enabling high, stable margins
China risk managed: Heavy China exposure, but resilient through geopolitical pressure
Bottom line: Well-positioned
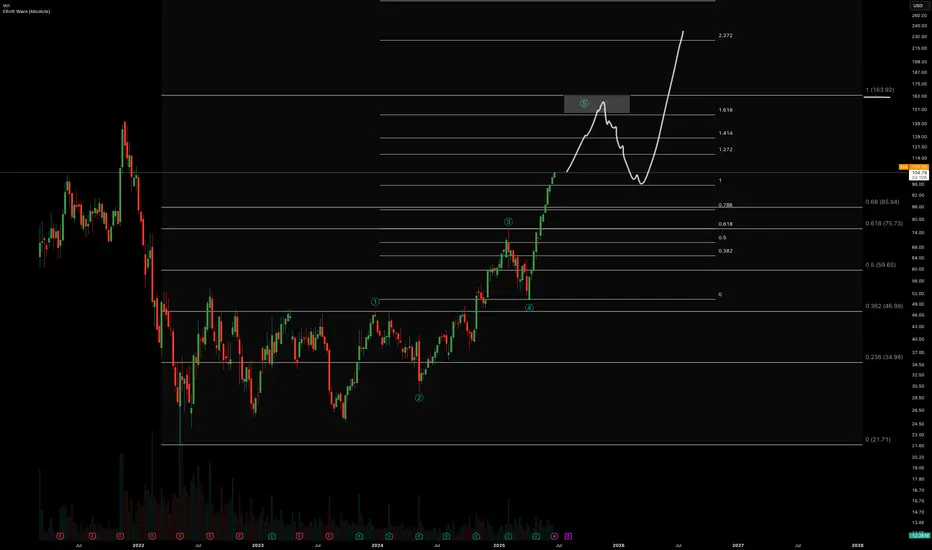
#RBLX (Y25.P2.E1). strong chartHi traders,
This ranged for years and I missed the breakout. I'm monitoring this chart for a study case and using my methodology to see if its accurate to forecast key level targets.
If I do see an opportunity to enter a long, so be it but its not giving any at the moment.
Elliott wave suggests e
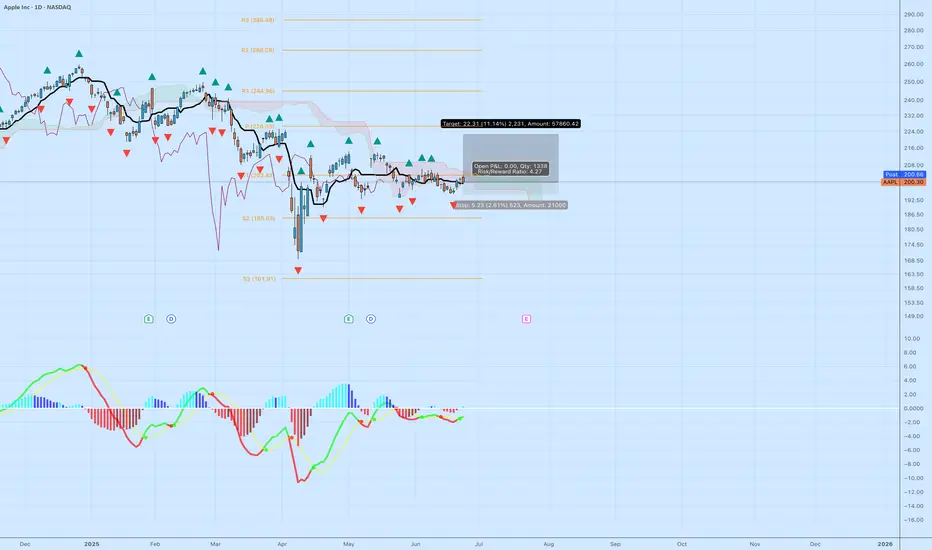
$AAPL Long Setup – Range Breakout Potential with Tight RiskApple ( NASDAQ:AAPL ) is finally showing signs of strength after a prolonged sideways range. Price is attempting to break above the Ichimoku Cloud on the daily chart while MACD is starting to curve upward—indicating a potential shift in momentum. After holding the $190–$200 zone as support for month
See all stocks ideas
Today
GISGeneral Mills, Inc.
Actual
0.74
USD
Estimate
0.71
USD
Today
WGOWinnebago Industries, Inc.
Actual
0.81
USD
Estimate
0.79
USD
Today
DAKTDaktronics, Inc.
Actual
0.18
USD
Estimate
0.15
USD
Today
MEIMethode Electronics, Inc.
Actual
—
Estimate
0.00
USD
Today
QMCOQuantum Corporation
Actual
—
Estimate
−1.17
USD
Today
POWWOutdoor Holding Company
Actual
—
Estimate
−0.02
USD
Today
IGCIGC Pharma, Inc.
Actual
—
Estimate
−0.02
USD
Today
KEQUKewaunee Scientific Corporation
Actual
—
Estimate
—
See more events
Community trends
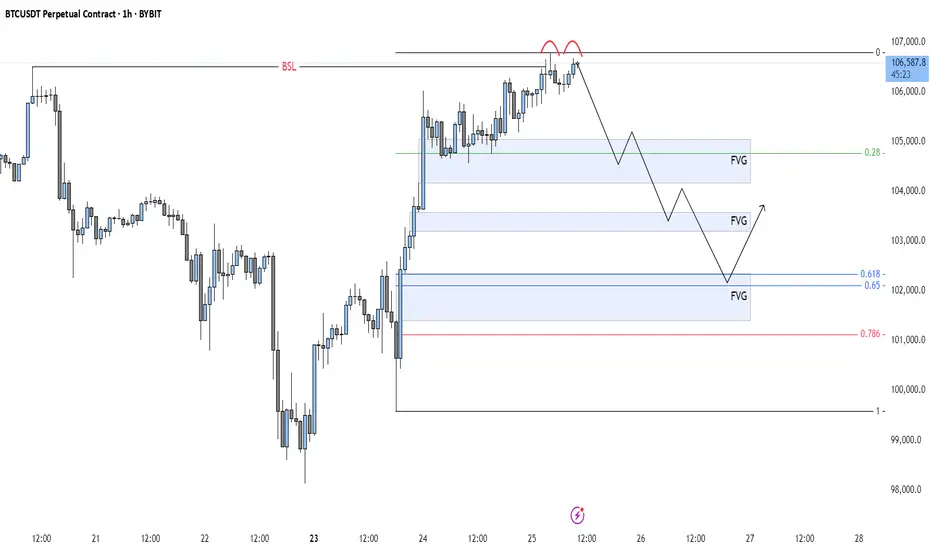
BTC - Double Top after Liquidity Sweep?Price has recently executed a Buy Side Liquidity Sweep just above the previous high. This type of move often signals a potential shift in market direction, especially when followed by signs of exhaustion or failure to push higher. In this case, price has formed a double top near the 106,600 level,
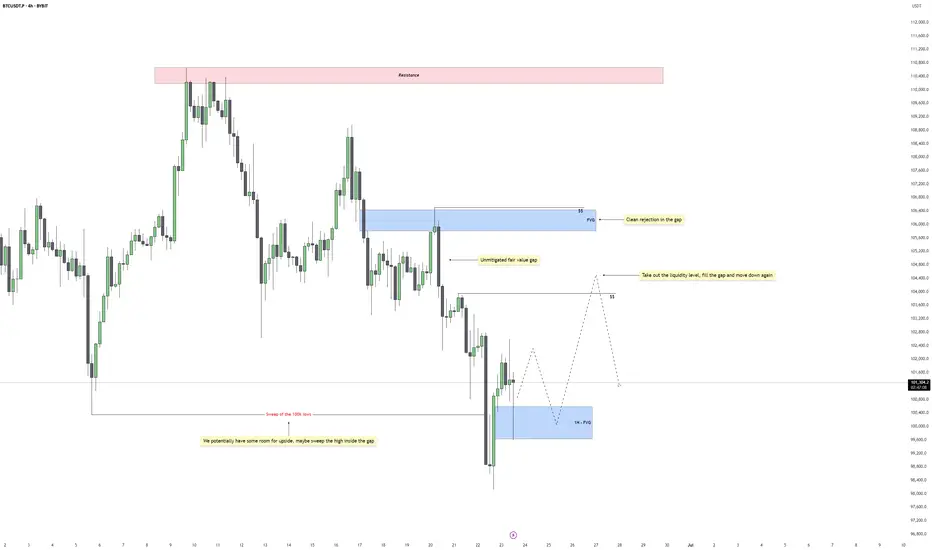
Bitcoin - Bounce Incoming or Breakdown to 97.5k?Market Context
Bitcoin recently swept the 100k lows, clearing out built-up liquidity beneath that level. This move formed a strong reaction candle, suggesting interest from buyers and confirming the presence of resting demand. The sweep aligns with the concept of smart money targeting obvious liqui
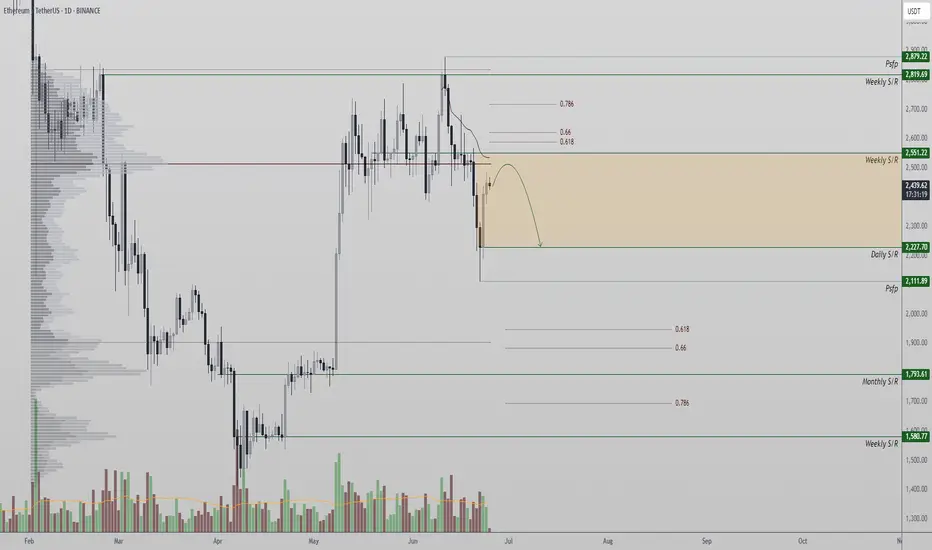
Ethereum at Key Resistance After Short Squeeze BounceEthereum recently found a local bottom at $2,111, triggering a sharp bounce that resembles a short squeeze. However, the rally has met a significant resistance zone—a former support level now flipped into resistance. This zone is technically loaded with multiple confluences: the point of control, th
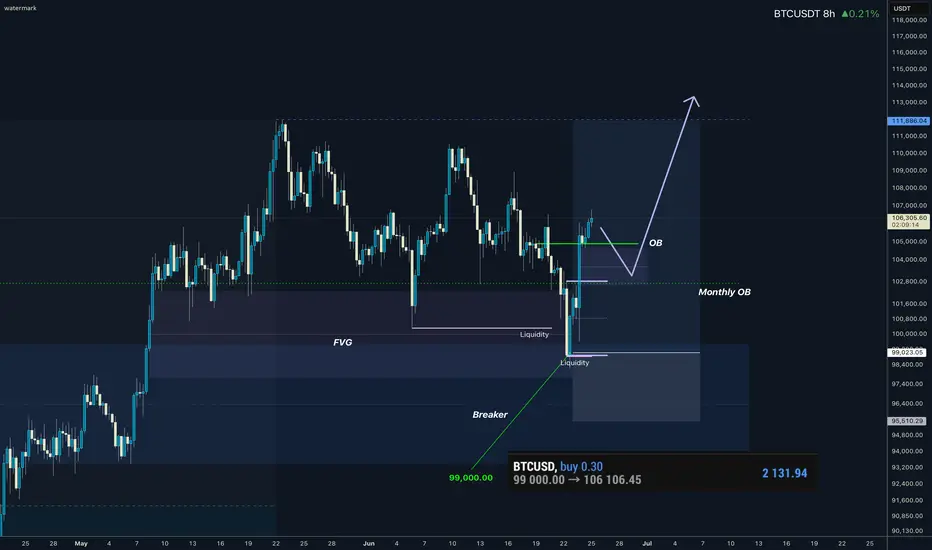
BTCUSD I H8 CLS I Monthly OB I ATH Coming then $200KHey, Market Warriors, here is another outlook on this instrument
If you’ve been following me, you already know every setup you see is built around a CLS Footprint, a Key Level, Liquidity and a specific execution model.
If you haven't followed me yet, start now.
My trading system is completely
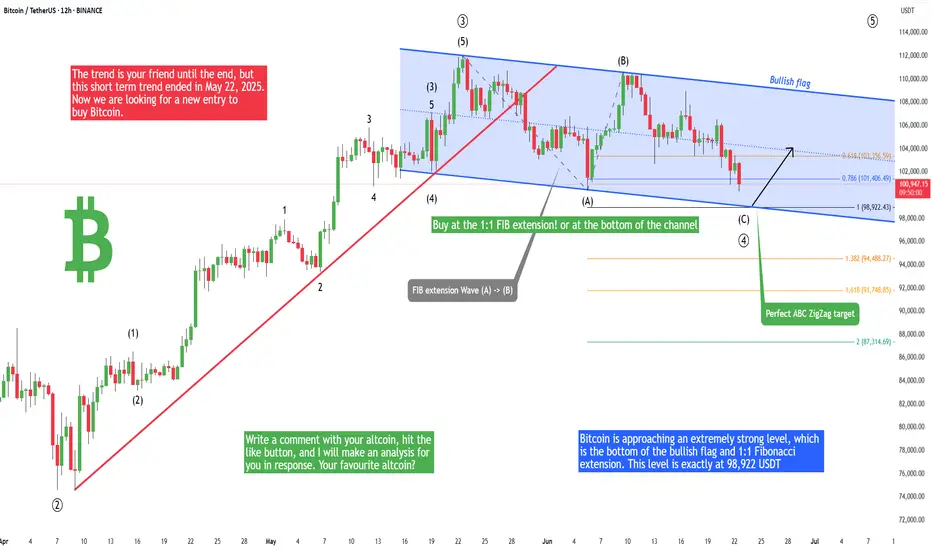
Bitcoin - Drop to 98,922 then a big pump! (Buy here)Bitcoin is falling again mostly because of Trump's aggressive attack on Iran. But technical analysis in general is very strong, and we can find strong levels where smart money has their buy orders. You, as a fish, always want to trade with big whales. Bitcoin is approaching an extremely strong level
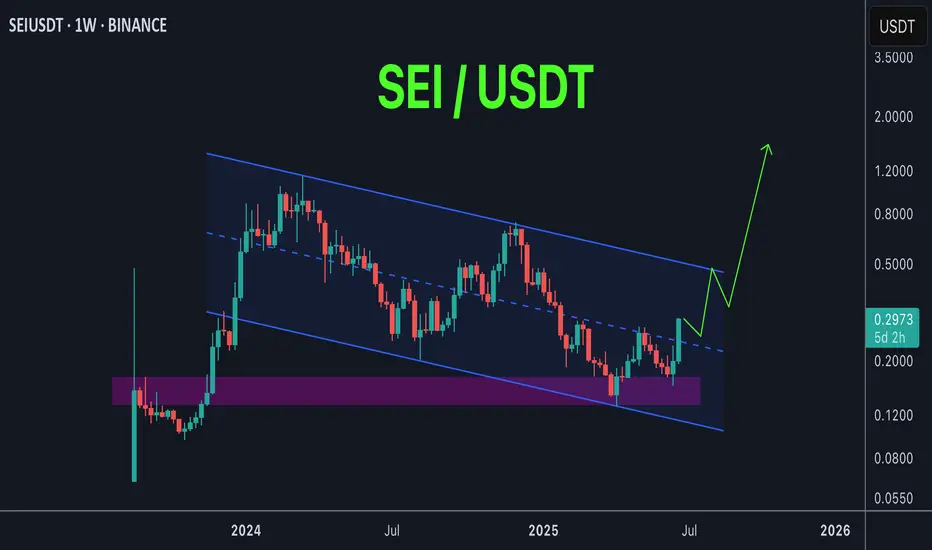
SEI possible playout SEI / USDT
Price is trading inside big descending channel
Next stop : price will hit the upper trendline of the channel and if managed to breakout this resistance it will skyrocket maybe to new ATH
Keep an eye on it …
SPY/QQQ Plan Your Trade For 6-24 : Post Market UpdateThis post-market update highlights the weakening volume while my primary proprietary modeling system continues to stay BULLISH.
The markets are really quite interesting right now. Weakening volume in this Gapping uptrend, today, suggests traders are not buying into the ceasefire between Iran and Is

Bitcoin Update 25.06.2025 —Altcoins, Top Altcoins Choice & MoreGood morning my fellow Cryptocurrency trader, I hope you are having a nice week and a wonderful day.
We have good news to start today and it is all based on Bitcoin's price action. This is going a bit deep on the daily noise, price swings.
Price action analysis
Bitcoin went deep on its sideways
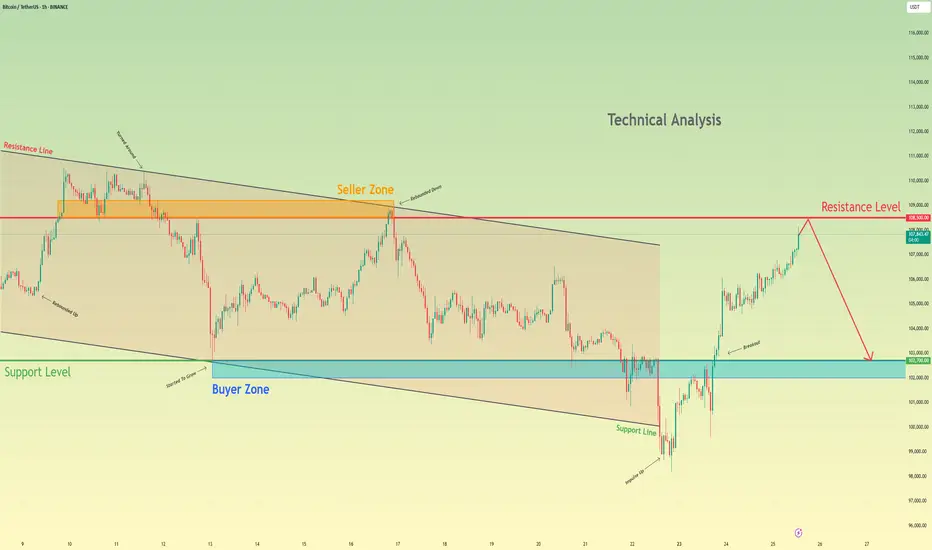
Bitcoin may reach resistance level and then start to declineHello traders, I want share with you my opinion about Bitcoin. Previously, the price was trading inside a well-defined downward channel, repeatedly rebounding from both the support and resistance lines. Each upward move got rejected within the seller zone, especially around the 108500 - 109200 range
Bitcoin: Trading Scenarios and Multi-Time Frame Analysis Bitcoin: Trading Scenarios and Multi-Time Frame Analysis
In this video, I break down all the key scenarios currently unfolding for Bitcoin.
The price is approaching a critical zone and is likely to make a decisive move soon.
While I believe a downside move remains the more probable outcome, al

See all crypto ideas
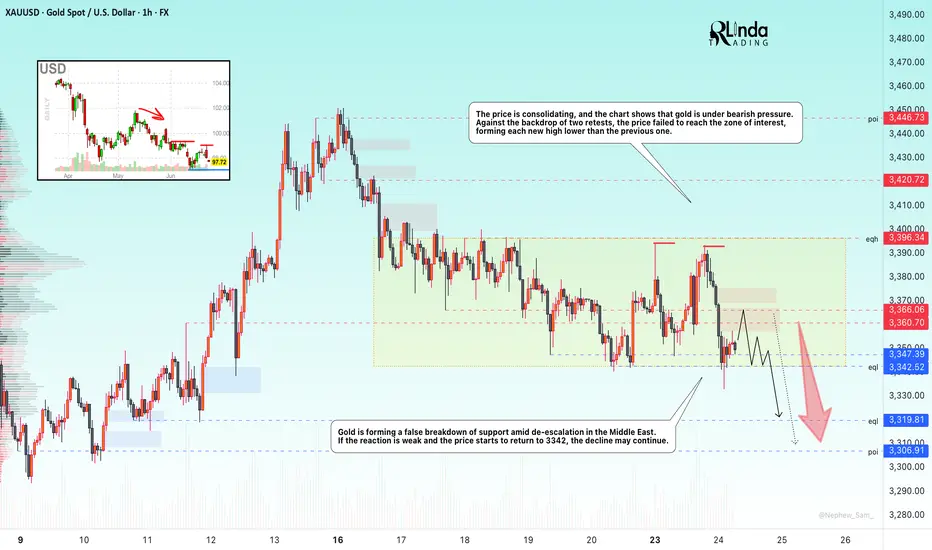
GOLD → Declining interest. Retest of supportFX:XAUUSD experienced significant volatility toward the end of the US trading session. This was due to developments in the Middle East. The de-escalation of the situation is leading to a decline in interest in the metal.
The announced ceasefire between Iran and Israel has reduced demand for gold
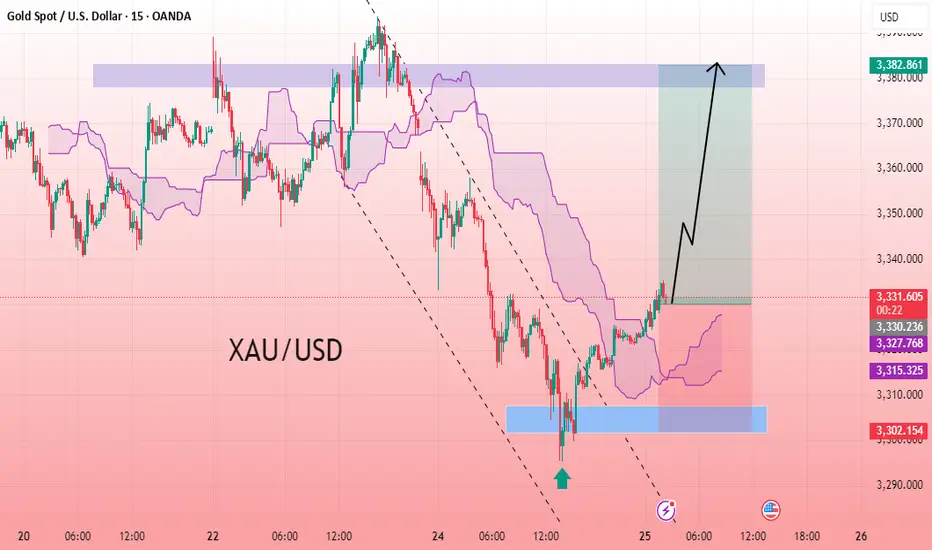
XAU/USD Reversal Signal Bullish Momentum: Targeting 3337The XAU/USD 15-minute chart indicates a strong bullish reversal after price action bounced from the key support zone near 3302. A clear breakout from the descending channel signals that bearish momentum has faded. Price is now trading above the Ichimoku cloud, reinforcing the shift in short-term sen
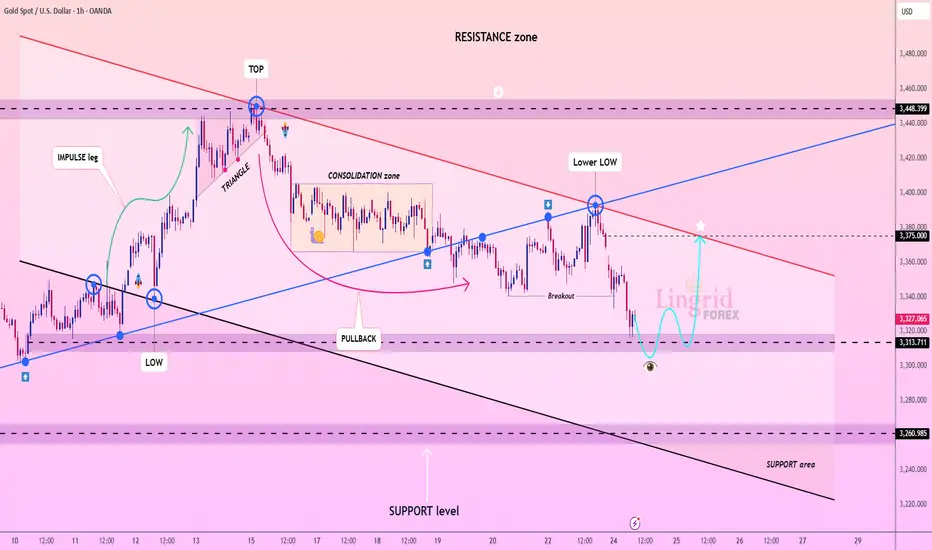
Lingrid | GOLD Retracement Entry Opportunity from Support ZoneOANDA:XAUUSD is attempting to stabilize after breaking below the consolidation zone and forming a new lower low near the 3,313 support. Price action hints at a bullish rebound setup, potentially targeting the 3,375 resistance aligned with the descending red trendline. The structure may shift if pr
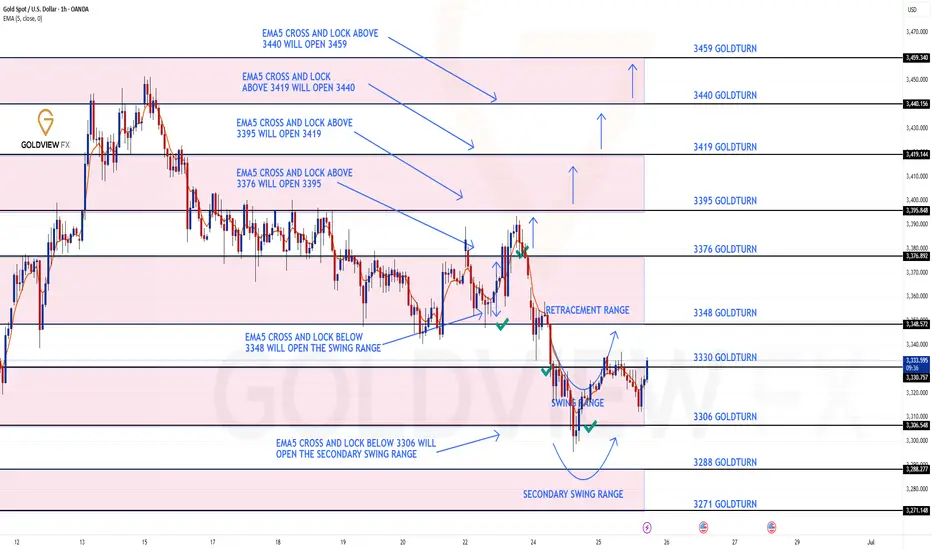
GOLD ROUTE MAP UPDATEHey Everyone,
Another smashing day on the charts with our levels being respected perfectly inline with our plans to buy dips.
After completing our bearish 3348 and bullish 3376 target we had the cross and lock above 3376 leaving a gap to 3395, which fell short just by few pips.
We then had the c
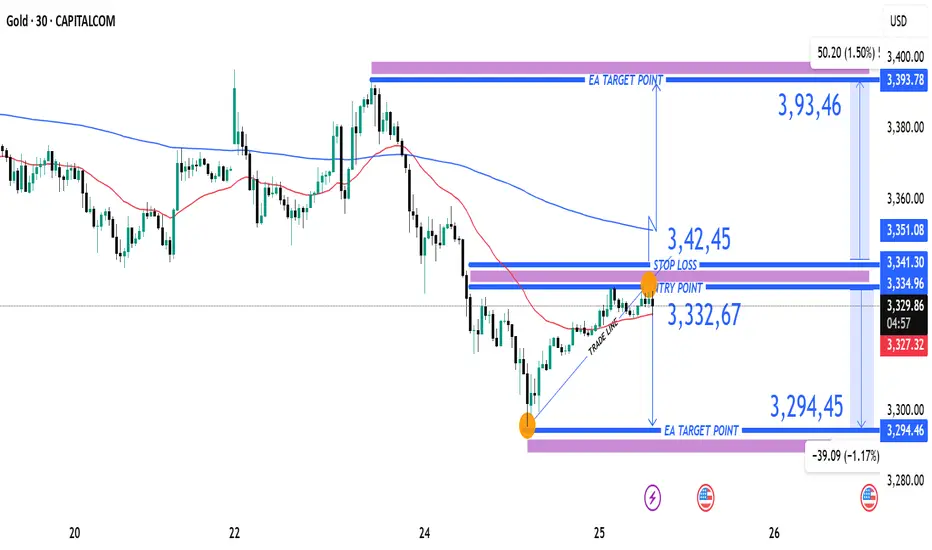
XAUUAD Reversal Setup Short Trade Opportunity Below Resistance Current Price: 3,327.56 USD
Entry Point: 3,332.67 USD
Stop Loss: 3,342.45 USD
Take Profit Levels:
Target 1 (Downside): 3,294.45 USD (-1.17%)
Target 2 (Upside): 3,393.78 USD (+1.50%)
🔧 Technical Indicators & Tools
Trade Line: Upward sloping trendline connecting higher lows, supporting recent bu
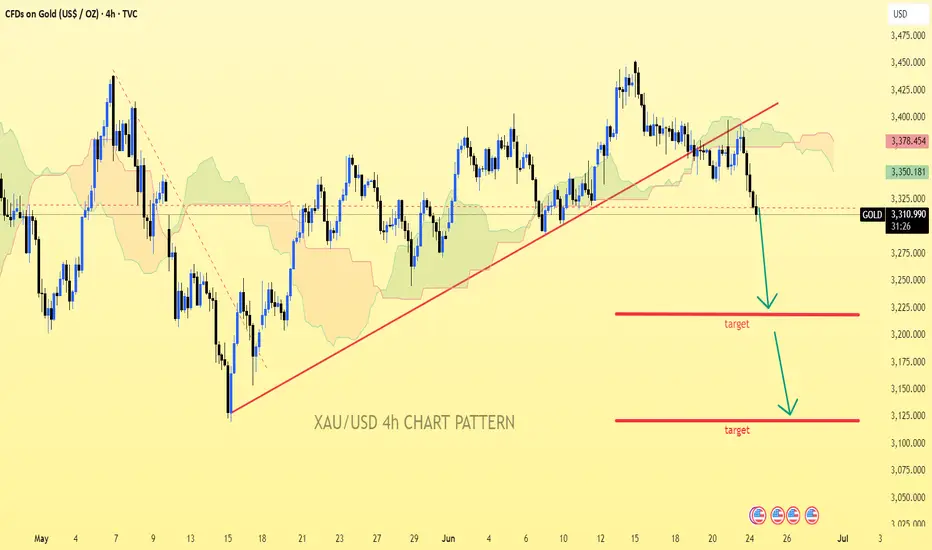
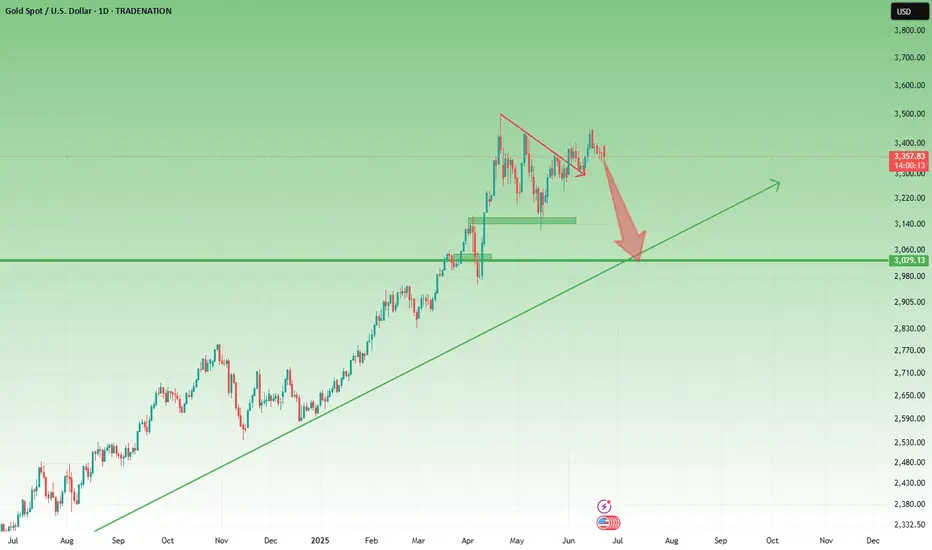
XAU/USD 4h chart patternXAU/USD (Gold) 4H Chart, the price has clearly broken below the ascending trendline, indicating a bearish structure.
Visual Targets from My Chart:
1. First Target Zone: Around 3,210 - 3,215 USD
2. Second Target Zone: Around 3,130 - 3,135 USD
Price Action Breakdown:
Current Price: Around 3,31
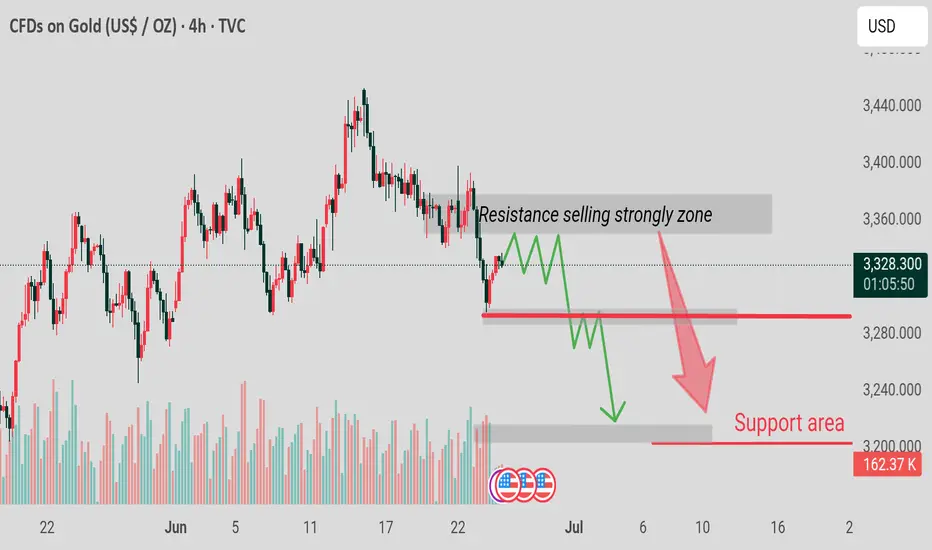
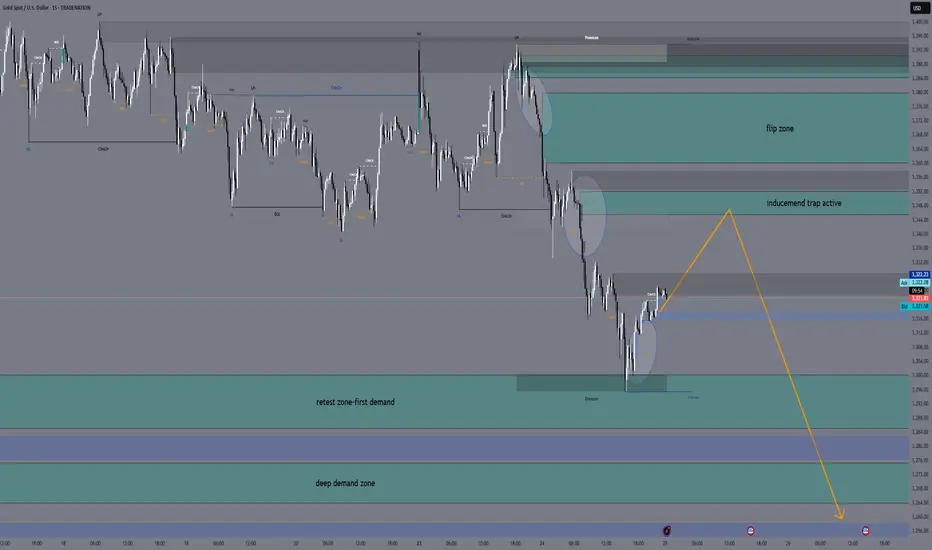
XAUUSD h4 down Bearish Continuation Assumption? Maybe Not So Fast…
The chart assumes a clean, step-by-step drop to the “Support Area,” but:
There’s a liquidity gap just above current price (~3340–3360) where stop hunts could occur.
Smart money might push price higher briefly to fill orders before any major sell
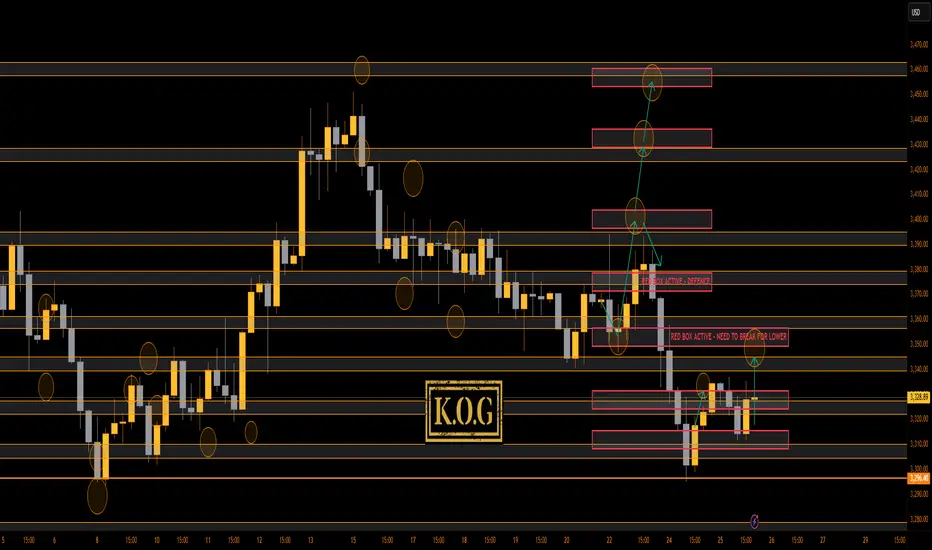
THE KOG REPORT - UpdateEnd of day update from us here at KOG:
A ranging day and honestly, very frustrating for traders due to the up and down which hasn't allowed us to really hold without ridiculous stop losses. We hit the target yesterday, we're still not retesting that low so those entries are still active, but we re
XAUUSD Daily Sniper Plan – June 25, 2025👋👋 Hello traders!
Gold is still moving down strongly. Today’s plan is made for traders who want clear and precise levels. Let’s look at the structure, important zones, and where to watch for trades.
1. Higher Timeframe Overview (Daily, H4, H1)
Daily: Price is falling near the 200 EMA around 3323.
Geopolitical Spike Fades Fast – Gold Eyes 3300As highlighted in Friday’s analysis, the daily and short-term charts remain messy, but the weekly chart is leaning clearly bearish – with a potential Dark Cloud Cover candlestick formation now confirmed.
🌍 Geopolitical Gap Up... and Quick Rejection
Monday’s Asian open brought a gap up, triggered
See all futures ideas
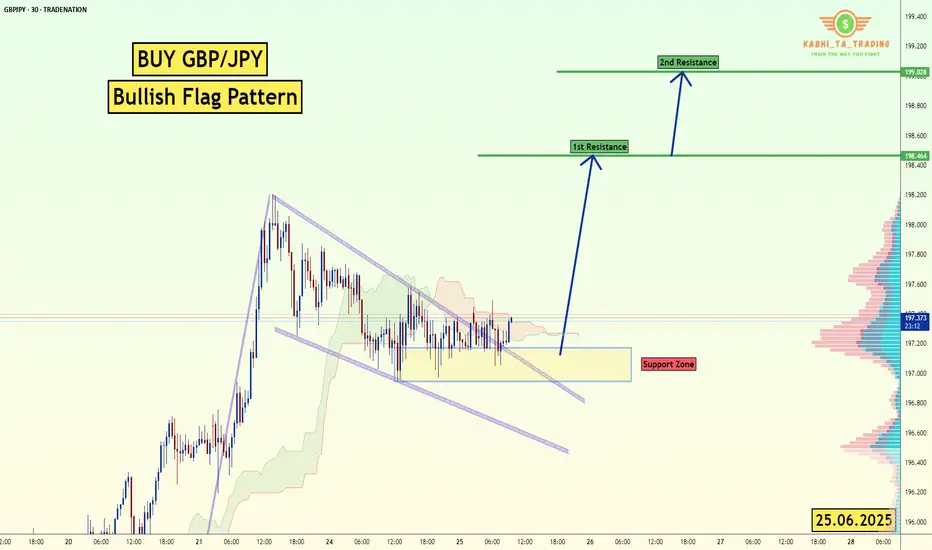
GBP/JPY Bullish Flag (25.06.2025) The GBP/JPY pair on the M30 timeframe presents a Potential Buying Opportunity due to a recent Formation of a Bullish Flag Pattern. This suggests a shift in momentum towards the upside and a higher likelihood of further advances in the coming hours.
Possible Long Trade:
Entry: Consider Entering A
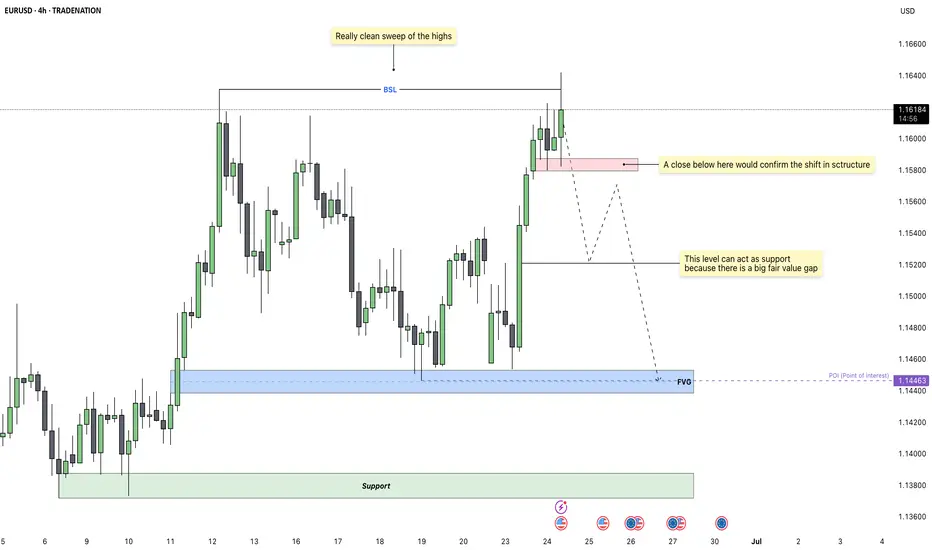
EURUSD - Bears Preparing a Bearish Shift in StructureEURUSD has been pushing higher over the past few sessions, reaching into a key liquidity zone. On the 4H chart, we’ve now seen a very clean sweep of previous swing highs, which completes the first step needed for a potential reversal. This sweep acted as a buy-side liquidity run, taking out resting
CHF JPY short Target 177CHFJPY recently hit an all-time high and is now in a downtrend. The pair is currently undergoing a pullback consolidation and is likely to resume its downward move soon.

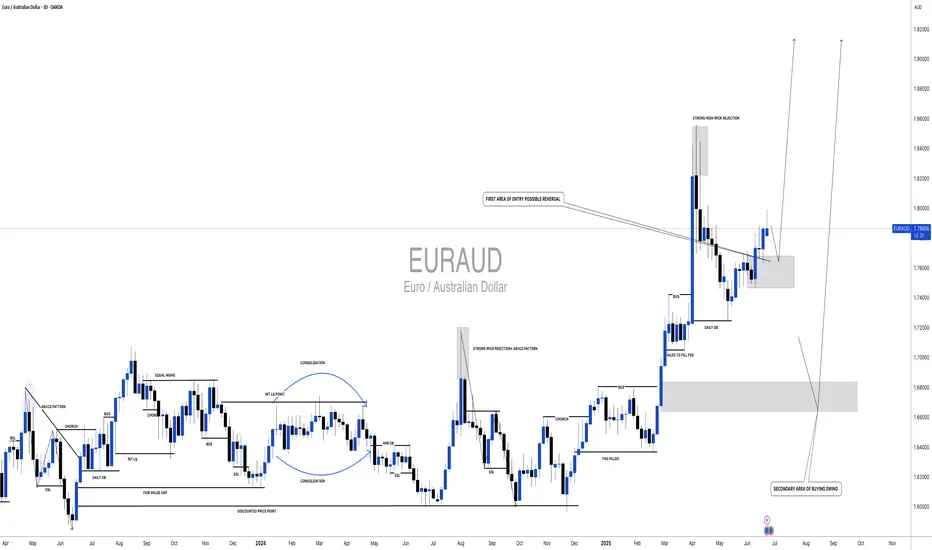
#EURAUD: Two Swing Bullish Entry Worth Thousands Pips! EURAUD is currently at a critical level, and the price isn’t yet decided for the next move. However, the current price behaviour suggests strong bullish volume presence in the market. There are two areas to buy from. The first is activated, and we think price could just be starting the next bull run
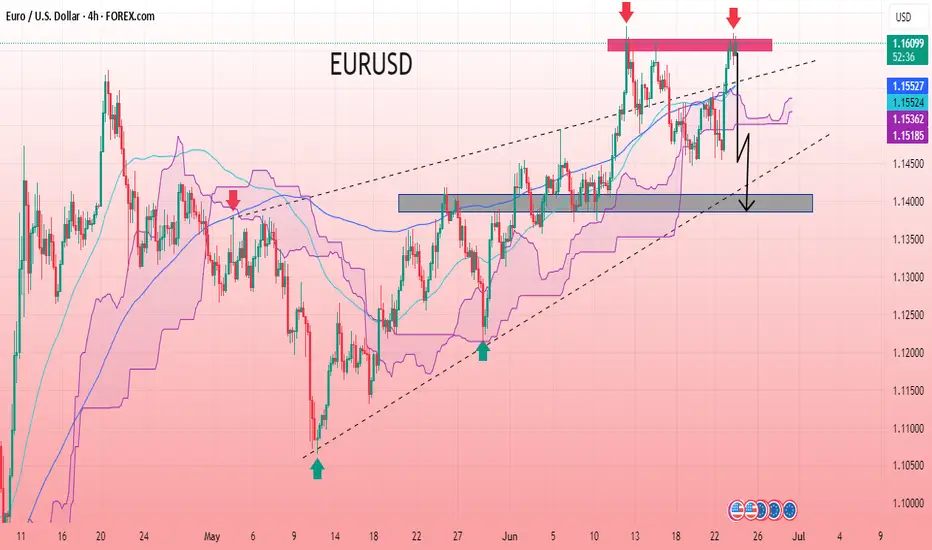
EUR/USD 4H CHART PATTERNThe EUR/USD 4-hour chart signals a bearish reversal after forming a double top near a strong resistance zone. Price was rejected twice from the same level, indicating exhaustion in bullish momentum. The chart also shows a potential breakdown from the rising channel, suggesting a trend shift. The Ich
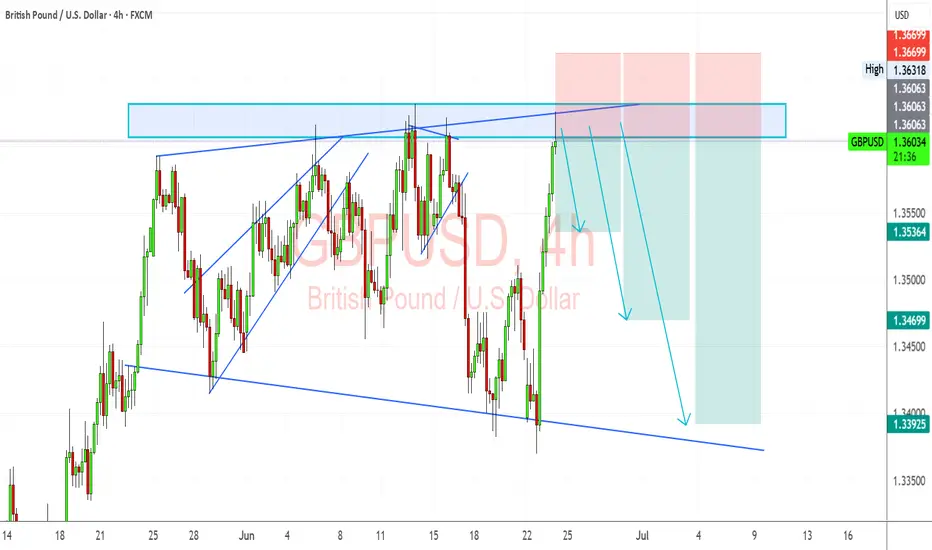
GBPUSD– Rejection at Resistance: Technical and Macro PullbackGBPUSD has climbed back into a strong multi-week resistance zone just beneath 1.3670. While the recent rally was sharp, it now confronts both structural resistance and weakening UK fundamentals. The British economy is losing steam—GDP contracted more than expected, manufacturing output is weak, and
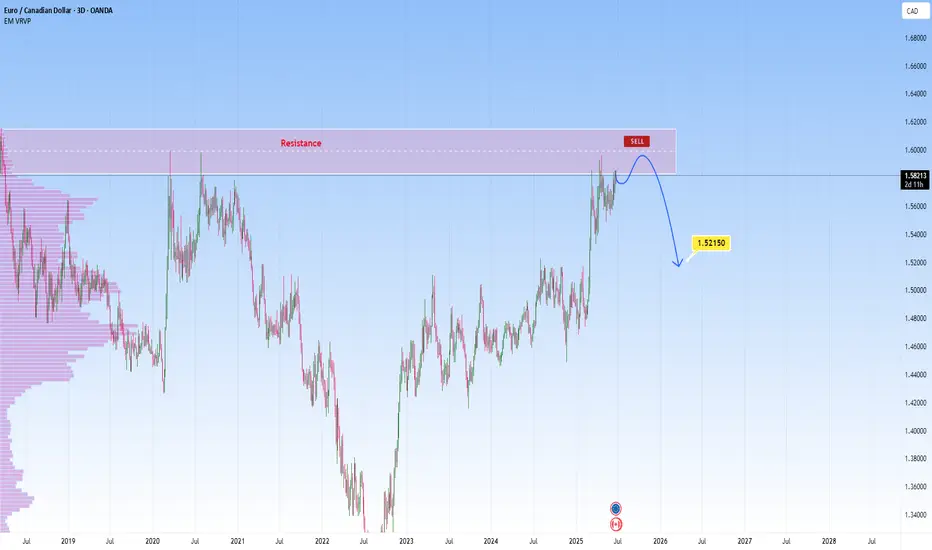
EURCAD at key resistance: Will price rebound to 1.5215?The price is currently at a strong resistance level, where it has struggled to break through and reversed sharply to the downside before. This makes the area particularly important to monitor, especially for traders considering potential short setups.
If we begin to see signs of rejection at this
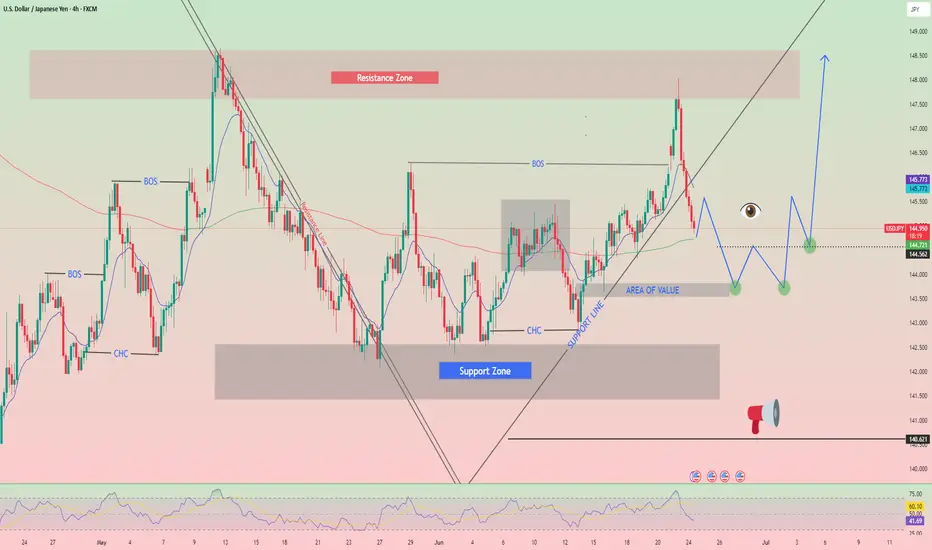
Trading Recommendations and Analysis for USDJPYThe technical picture on Monday may shape future developments in the medium term. The week began a gap up, followed by the formation of a long upper shadow. The daily close occurred exactly at the support level of 146.11 thereby closing the gap.
Today's trading also opened exactly at the same level
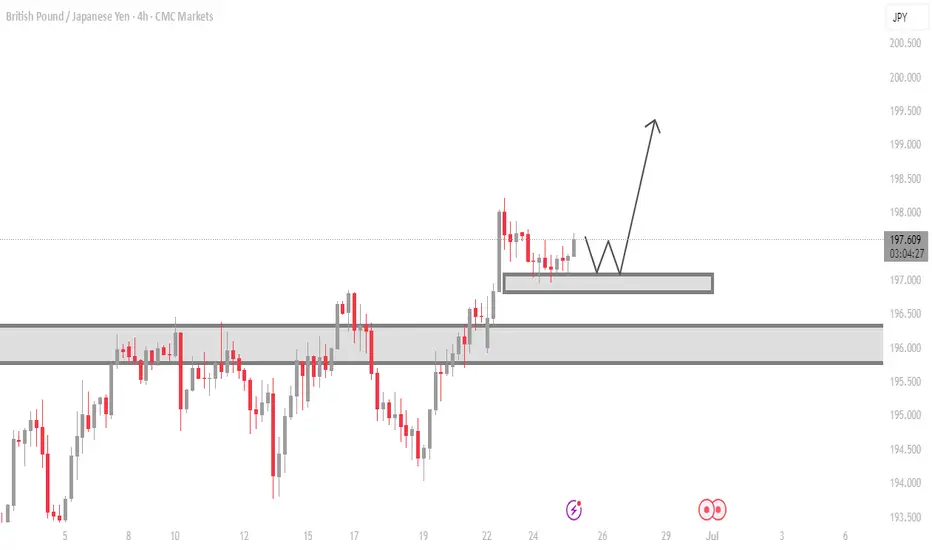
GBPJPY H4 Accumulation Zone – Ready for Bullish Breakout GBPJPY H4 Analysis – Bullish Setup Forming After Accumulation
Price is currently consolidating above a fresh demand zone after a strong impulse move. This is likely a bullish accumulation phase before continuation to the upside.
We're watching for a liquidity grab below the range, followed by bull
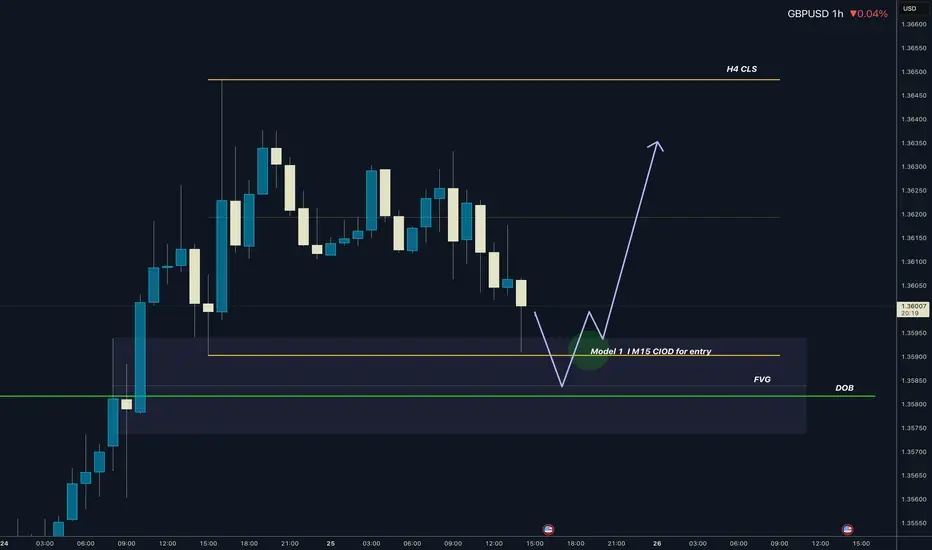
GBPUSD I H4 CLS I KL - DOB I Liquidity on TOPHey, Market Warriors, here is another outlook on this instrument
If you’ve been following me, you already know every setup you see is built around a CLS Footprint, a Key Level, Liquidity and a specific execution model.
If you haven't followed me yet, start now.
My trading system is completely
See all forex ideas
| - | - | - | - | - | - | - | ||
| - | - | - | - | - | - | - | ||
| - | - | - | - | - | - | - | ||
| - | - | - | - | - | - | - | ||
| - | - | - | - | - | - | - | ||
| - | - | - | - | - | - | - | ||
| - | - | - | - | - | - | - | ||
| - | - | - | - | - | - | - |
Trade directly on the supercharts through our supported, fully-verified and user-reviewed brokers.


