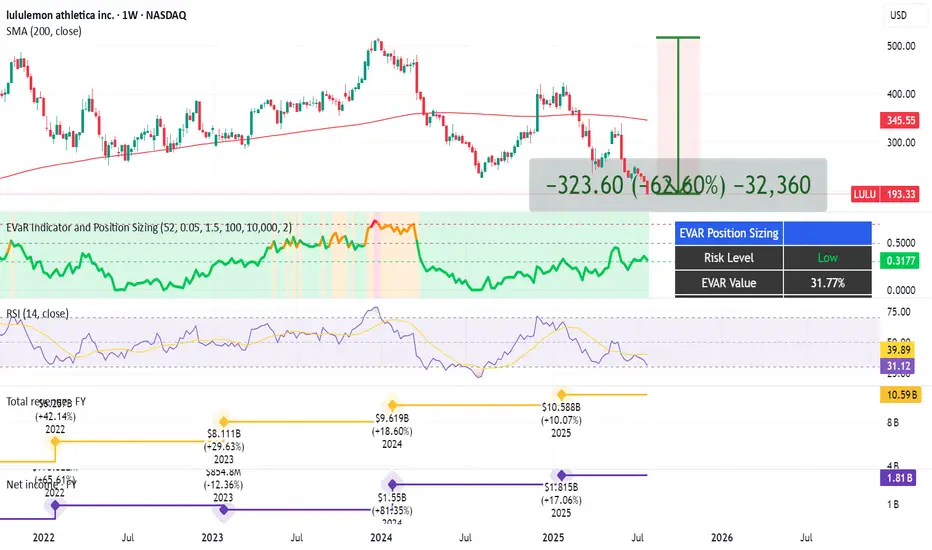
Yoga Pants, Tariffs, and Upside: The $LULU BetLululemon NASDAQ:LULU - My Investment Thesis 👖
Hey team,
I've been keeping an eye on NASDAQ:LULU for a while, and I'm finally going to pull the trigger.
In this market of overhyped MAG 7 stocks, Lululemon dropped 62% since its high in Dec. 2023 until now.
Here's why I'm into LULU:
Revenu

The best trades require research, then commitment.
Get started for free$0 forever, no credit card needed

Scott "Kidd" PoteetThe unlikely astronaut

Where the world does markets
Join 100 million traders and investors taking the future into their own hands.
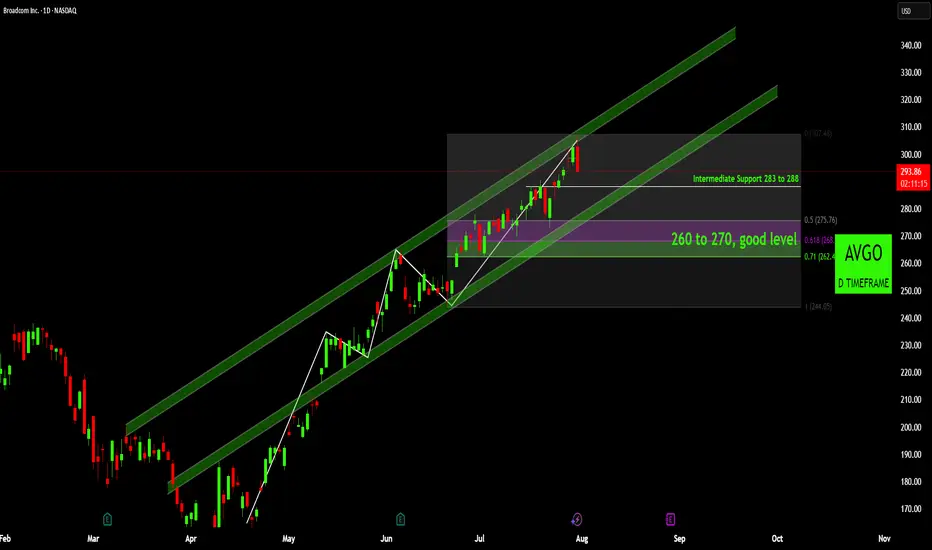
Broadcom (AVGO): Is This the Dip You've Been Waiting For?Broadcom (AVGO) has been demonstrating a remarkably strong bullish trend since early April, carving out a clear path of higher highs and higher lows. This robust upward momentum is well-defined by a series of ascending channels.
Trend and Channel Dynamics:
Initially, we observed price action mov
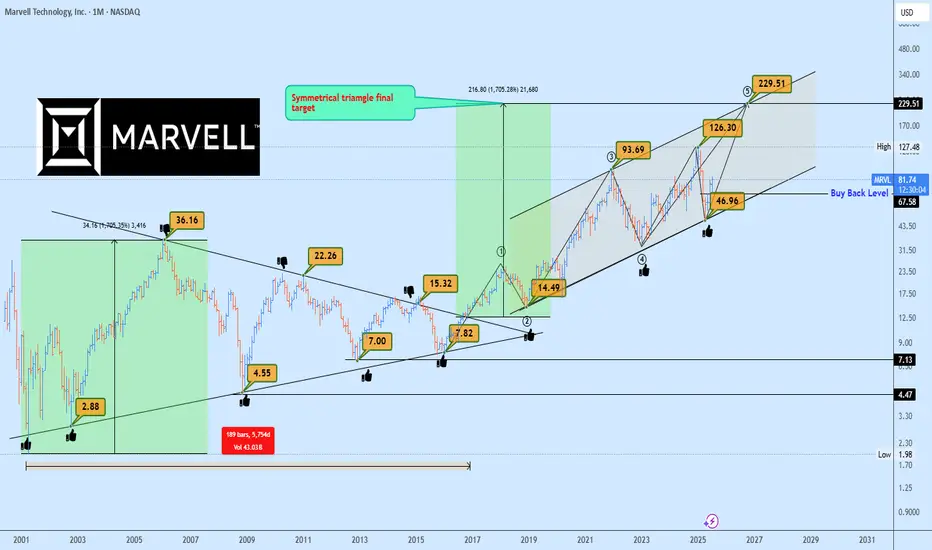
MRVL Massive 15-Years Symmetrical Breakout Targets AheadMarvell Technology (MRVL) has just completed a monumental breakout from a 15-years symmetrical triangle, a rare and powerful long-term accumulation structure. This type of macro consolidation typically precedes a major directional expansion, and in this case, the breakout confirmed bullish continuat
TSLA Long-Term Bold Projection (2025-2035)This is a long-term analysis of Tesla (TSLA) stock on the weekly timeframe, combining Elliott Wave Theory, Fibonacci extensions, and price structure (base formations) within a broad logarithmic trend channel.
Key Highlights:
🔹 Base Formations:
Base 1 (2010–2013): First consolidation before TSLA’s

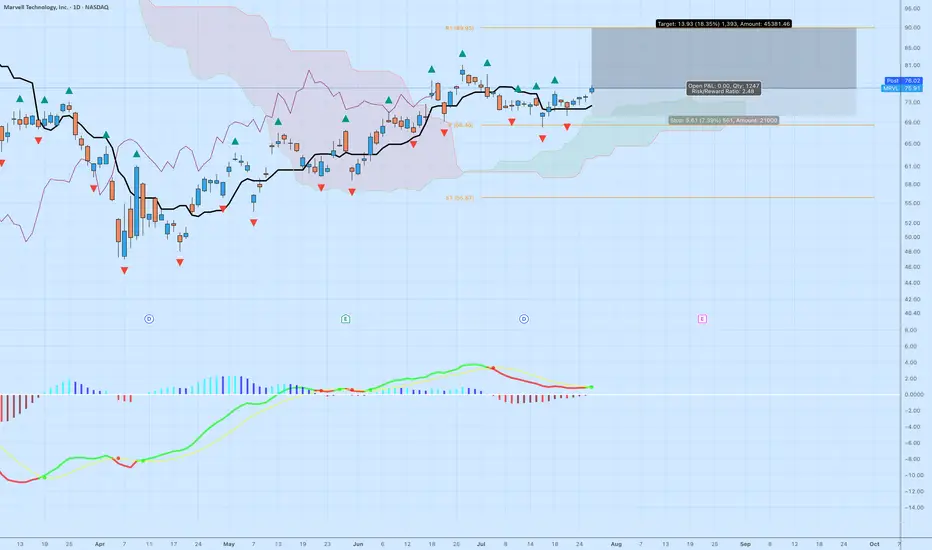
MRVL | Ichimoku Breakout Setup with Fractal and MACDMarvell Technology (MRVL) just printed a clean bullish breakout setup across multiple technical systems. Here's the breakdown:
Why This Setup Matters
Ichimoku Cloud: Price has decisively cleared the cloud with bullish Tenkan-Kijun alignment. The Senkou Span A is rising, and the cloud ahead is thin
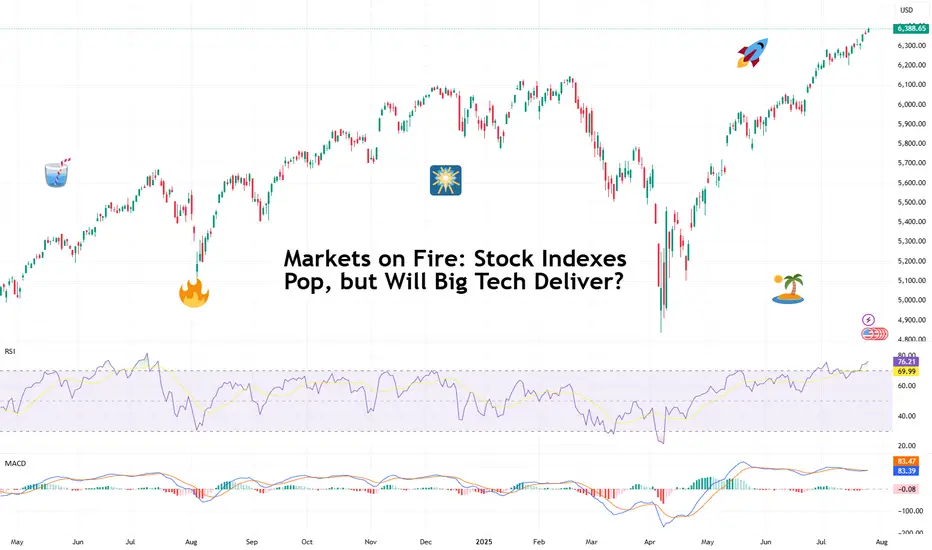
Markets on Fire: Stock Indexes Pop, but Will Big Tech Deliver?S&P 500 and Nasdaq set records. Now it's up to big tech to justify that.
Talk about forward-looking valuation. Tech companies’ valuations are largely based on future potential rather than current performance. And that’s what we’re seeing right now getting priced in across the big indexes.
You’d
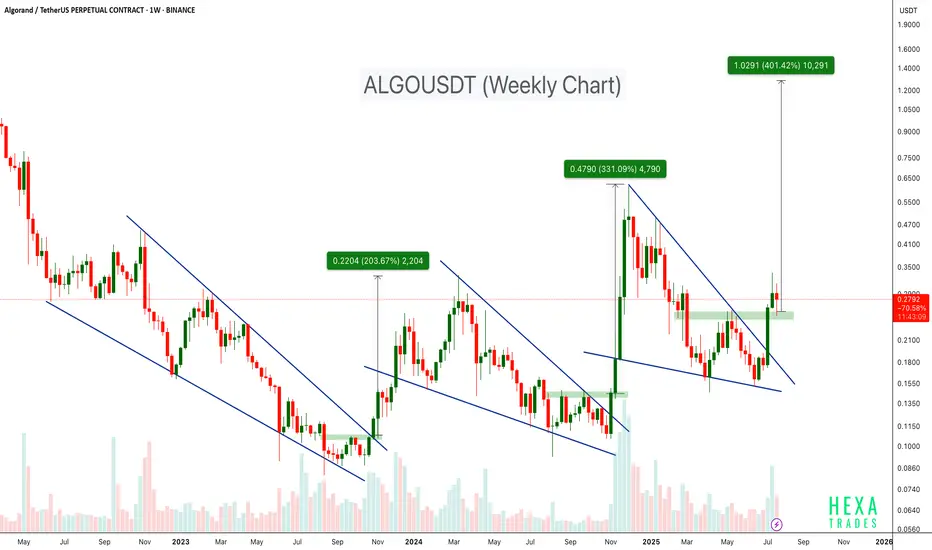
ALGO Breaks Out of Falling Wedge – 400% Target Ahead?BINANCE:ALGOUSDT has consistently followed a bullish pattern on the weekly timeframe. Each major rally has been preceded by a falling wedge breakout, as shown by the three highlighted instances on the chart.
- First breakout: ~200%+ move
- Second breakout: ~300%+ move
- Current breakout projection
Retro Editors' picks 2021Going further in our retro EP selection , we present to you a collection of additional scripts from 2021 that have earned a spot in our Editors' picks. These retrospective selections reflect our continued commitment to honoring outstanding contributions in our community, regardless of when they wer
Retro Editors' picks 2022Going further in our retro EP selection , we present to you the third collection of additional scripts that have earned a spot in our Editors' picks, now from 2022.
These retrospective selections reflect our continued commitment to honoring outstanding contributions in our community, regardless o

XRP 4H – Golden Pocket Bounce, But Will Bulls Reclaim $3.60?XRP pulled back cleanly into the golden pocket (0.618 Fib) after a strong rally — and buyers stepped in with force. Momentum flipped quickly, and Stochastic RSI is curling up with bullish intent.
Now price is holding above short-term support, but faces a key challenge:
→ $3.60 marks the prior high

See all editors' picks ideas
Trend Range Detector (Zeiierman)█ Overview
Trend Range Detector (Zeiierman) is a market structure tool that identifies and tracks periods of price compression by forming adaptive range boxes based on volatility and price movement. When prices remain stable within a defined band, the script dynamically draws a range box; when p

BE-Indicator Aggregator toolkit█ Overview:
BE-Indicator Aggregator toolkit is a toolkit which is built for those we rely on taking multi-confirmation from different indicators available with the traders. This Toolkit aid's traders in understanding their custom logic for their trade setups and provides the summarized results o

Synthetic VX3! & VX4! continuous /VX futuresTradingView is missing continuous 3rd and 4th month VIX (/VX) futures, so I decided to try to make a synthetic one that emulates what continuous maturity futures would look like. This is useful for backtesting/historical purposes as it enables traders to see how their further out VX contracts would'

Intrabar Efficiency Ratio█ OVERVIEW
This indicator displays a directional variant of Perry Kaufman's Efficiency Ratio, designed to gauge the "efficiency" of intrabar price movement by comparing the sum of movements of the lower timeframe bars composing a chart bar with the respective bar's movement on an average ba

Strategy█ OVERVIEW
This library is a Pine Script™ programmer’s tool containing a variety of strategy-related functions to assist in calculations like profit and loss, stop losses and limits. It also includes several useful functions one can use to convert between units in ticks, price, currency or a per

Signs of the Times [LucF]█ OVERVIEW
This oscillator calculates the directional strength of bars using a primitive weighing mechanism based on a small number of what I consider to be fundamental properties of a bar. It does not consider the amplitude of price movements, so can be used as a complement to momentum-based osc

Estimated Time At Price [Kioseff Trading]Hello!
This script uses the same formula as the recently released "Volume Delta" script to ascertain lower timeframe values.
Instead, this script looks to estimate the approximate time spent at price blocks; all time estimates are in minute.second format.
The image above shows functionality.

Volume Profile, Pivot Anchored by DGTVolume Profile (also known as Price by Volume ) is an charting study that displays trading activity over a specified time period at specific price levels. It is plotted as a horizontal histogram on the finacial isntrumnet's chart that highlights the trader's interest at specific price levels. Specif

Fair Value MSThis indicator introduces rigid rules to familiar concepts to better capture and visualize Market Structure and Areas of Support and Resistance in a way that is both rule-based and reactive to market movements.
Typical "Market Structure" or "Zig-Zag" methods determine swing points based on fixed t

TextLibrary "Text"
library to format text in different fonts or cases plus a sort function.
🔸 Credits and Usage
This library is inspired by the work of three authors (in chronological order of publication date):
Unicode font function - JD - Duyck
UnicodeReplacementFunction - wlhm

See all indicators and strategies
Community trends
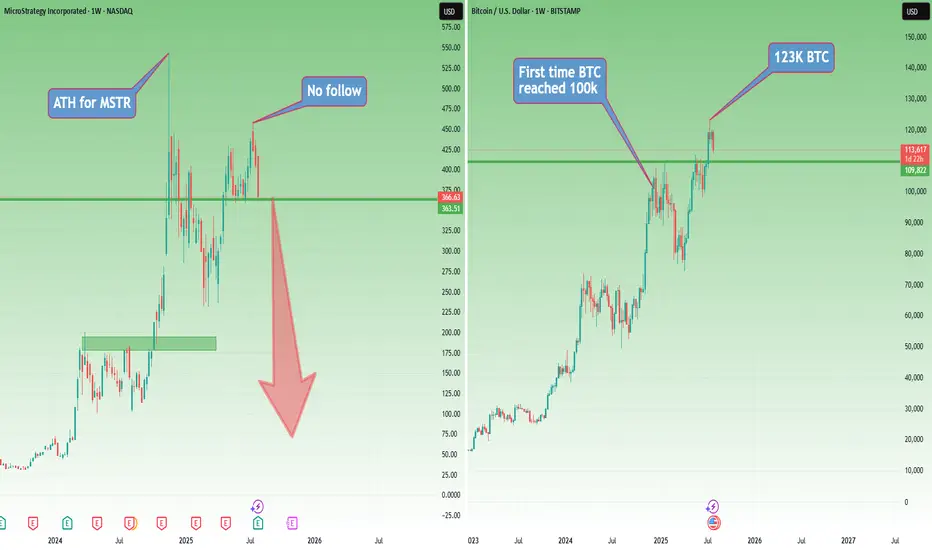
Why Pay $250K for a $115K Bitcoin? Welcome to Strategy (MSTR)This is already the third article I’ve written about Strategy (formerly MicroStrategy), and for good reason.
You don’t need to be a financial expert to ask: why buy a stock that simply mirrors Bitcoin’s price — but at a massive premium?
No matter how sophisticated the explanations may sound, or how
MRVL Massive 15-Years Symmetrical Breakout Targets AheadMarvell Technology (MRVL) has just completed a monumental breakout from a 15-years symmetrical triangle, a rare and powerful long-term accumulation structure. This type of macro consolidation typically precedes a major directional expansion, and in this case, the breakout confirmed bullish continuat
Yoga Pants, Tariffs, and Upside: The $LULU BetLululemon NASDAQ:LULU - My Investment Thesis 👖
Hey team,
I've been keeping an eye on NASDAQ:LULU for a while, and I'm finally going to pull the trigger.
In this market of overhyped MAG 7 stocks, Lululemon dropped 62% since its high in Dec. 2023 until now.
Here's why I'm into LULU:
Revenu
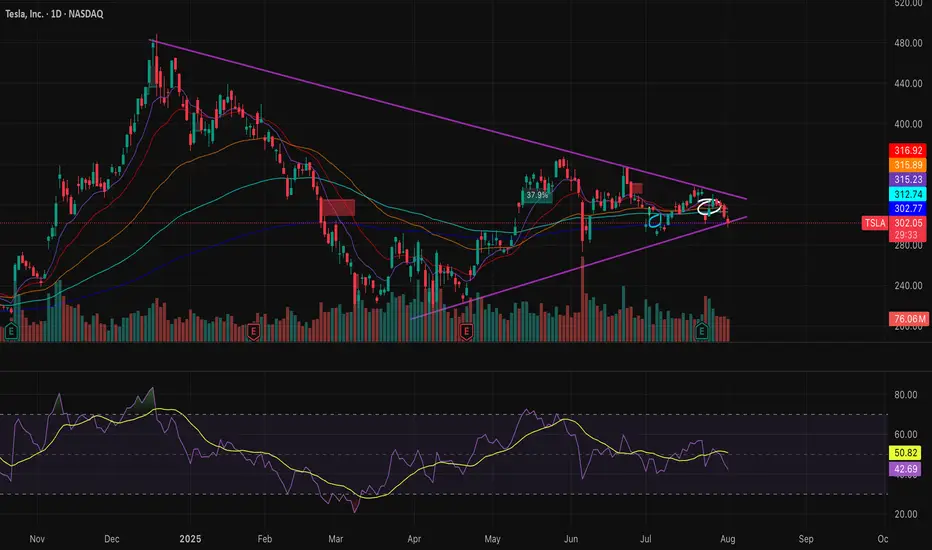
Make or Break point for TSLAlots of bulls and bears for TSLA. Wedging for a bit now. Filled the 296 gap and gap above, now its time to see if TSLA wants up or down. RSI MACD stabilized, volume thinned out, so whatever direction it chooses I think will be explosive. Plenty of Call and Put flow on both sides.
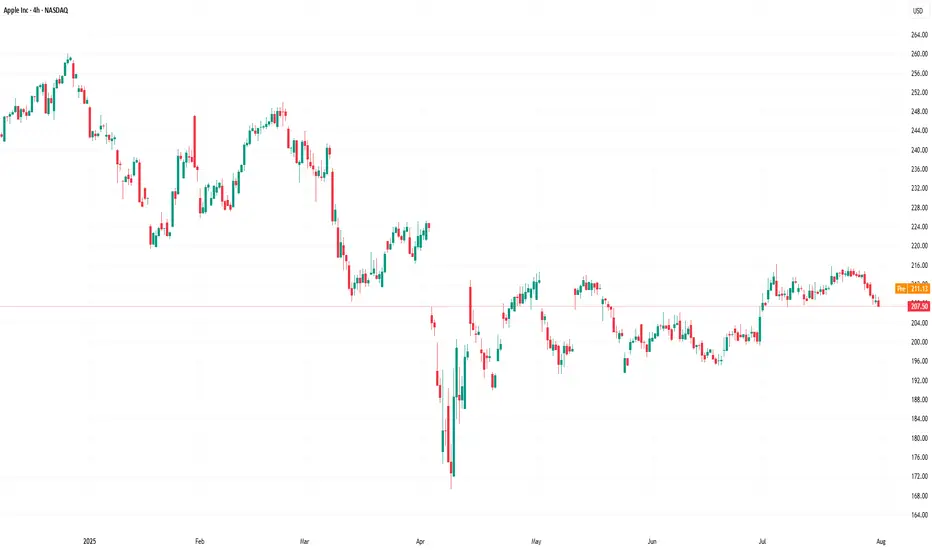
Apple (AAPL) Shares Jump Following Earnings ReportApple (AAPL) Shares Jump Following Earnings Report
Yesterday, after the close of the regular trading session, Apple released its earnings report, which surpassed analysts’ expectations:
→ Earnings per share: actual = $1.57, forecast = $1.43;
→ Revenue: actual = $94.04 billion, forecast = $89.35
$TSLA 3rd Time's a CharmI bottom called NASDAQ:TSLA twice in a row. About to do it a third time today. 312.5C 8/8 @ 4.47 were just bought for $1.3 million.
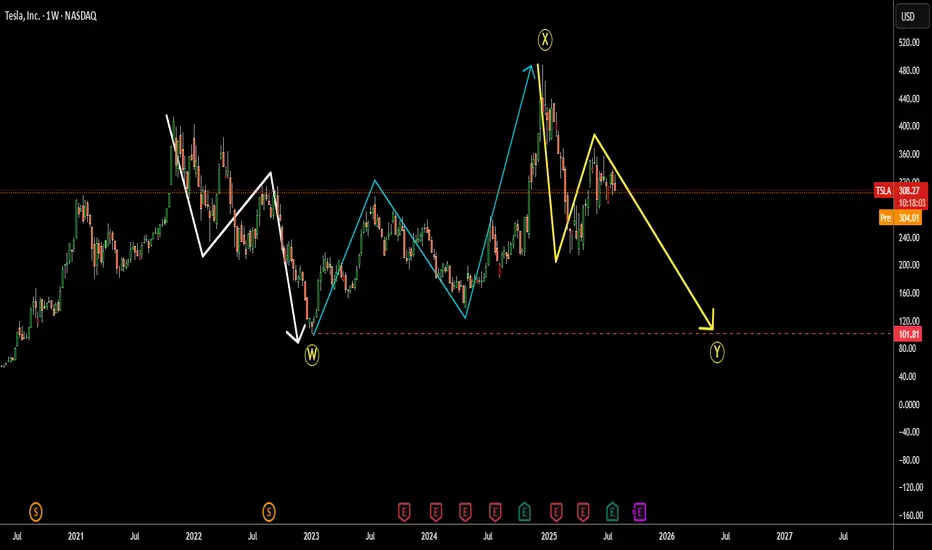
Tesla (TSLA) Crash Ahead? $101.81 Retest in SightThe Tesla price chart appears to show a large flat correction labeled W-X-Y.
Wave W consists of three downward waves from 2021 to 2023. (white)
Wave X shows a three-wave upward retracement from 2023 to 2024, which even overshot the start of wave W. (blue)
Now, we seem to be in the final leg of th
8/2/25 - $talk - Unclear to me, still8/2/25 :: VROCKSTAR :: NASDAQ:TALK
Unclear to me, still
- I really like the growth profile here, at least what's expected but the stock has not really been beating expectations in the last few Q's and while the market moved higher this has been bad money and while stock price doesn't necessarily

Let`s play some pokkerThere`s a pattern ;) So why not..
There`s room to grow min till pre-earnings
Trade safe!

TSLA LONGQuite a simple set up. Confirmation is still needed on 3d, and daily. Bullish candles and volume is desperately needed for validation of symmetrical setup.
Volatility incoming. Break of ATH with strength leads to price discovery into $500+.

See all stocks ideas
Tomorrow
WATWaters Corporation
Actual
—
Estimate
2.94
USD
Tomorrow
CNACNA Financial Corporation
Actual
—
Estimate
0.97
USD
Tomorrow
LLoews Corporation
Actual
—
Estimate
—
Tomorrow
IDXXIDEXX Laboratories, Inc.
Actual
—
Estimate
3.30
USD
Tomorrow
FRPTFreshpet, Inc.
Actual
—
Estimate
0.10
USD
Tomorrow
ENREnergizer Holdings, Inc.
Actual
—
Estimate
0.62
USD
Tomorrow
BRKRBruker Corporation
Actual
—
Estimate
0.41
USD
Tomorrow
TSEMTower Semiconductor Ltd.
Actual
—
Estimate
0.45
USD
See more events
Community trends
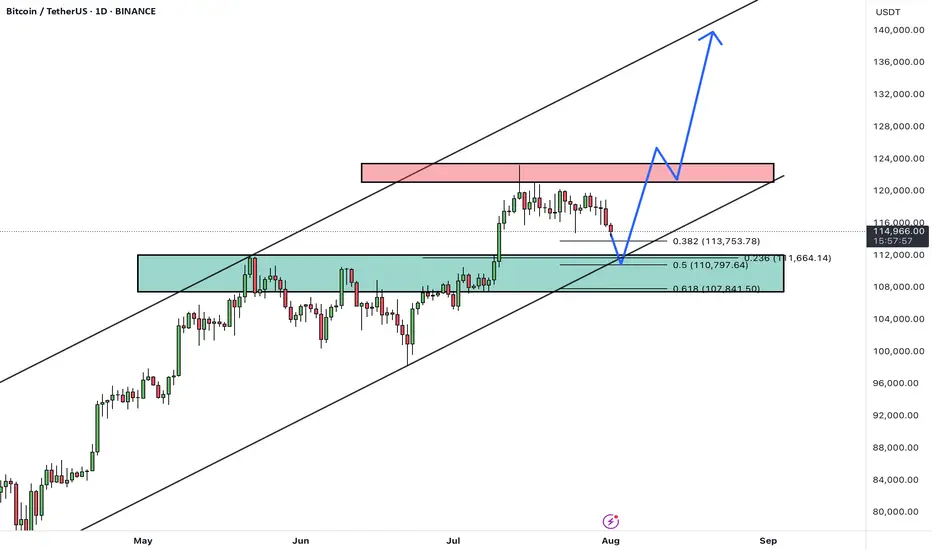
BTCUSDTHello Traders! 👋
What are your thoughts on BITCOIN?
After a strong rally, BTC is currently pulling back from the 124K resistance area, heading toward a major confluence support zone between 108,000– 110,000, which aligns with:
✅ Previous breakout zone
✅ 0.5–0.618 Fibonacci retracement
✅ Lower boun
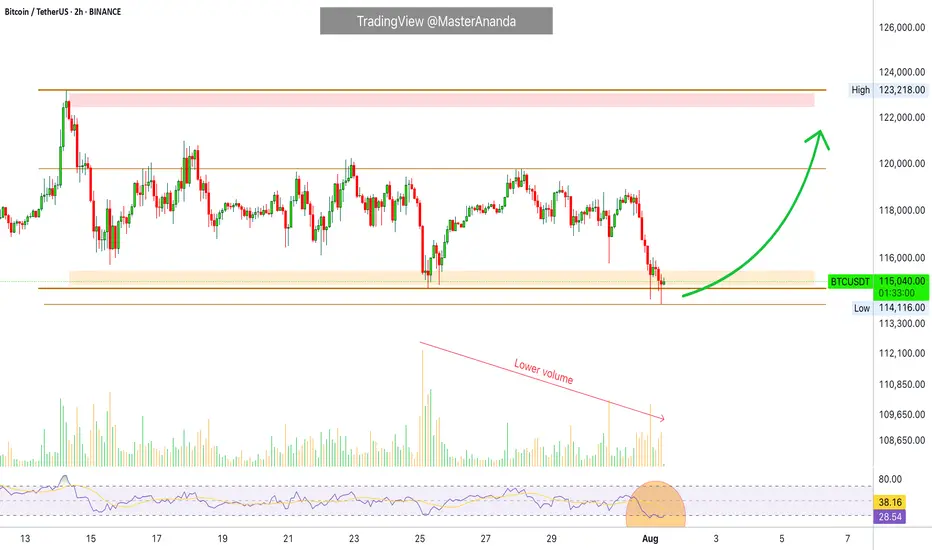
Bitcoin Hits $40,000, It Will Recover —Name Your AltcoinSorry, there is a typo there on the title, I meant to say: Bitcoin hits $114,000, soon to recover.
As you can see from our trading range, Bitcoin just went beyond the lower boundary and hit a new low, the lowest since 10-July but there is good news. There isn't room for prices to move much lower, t
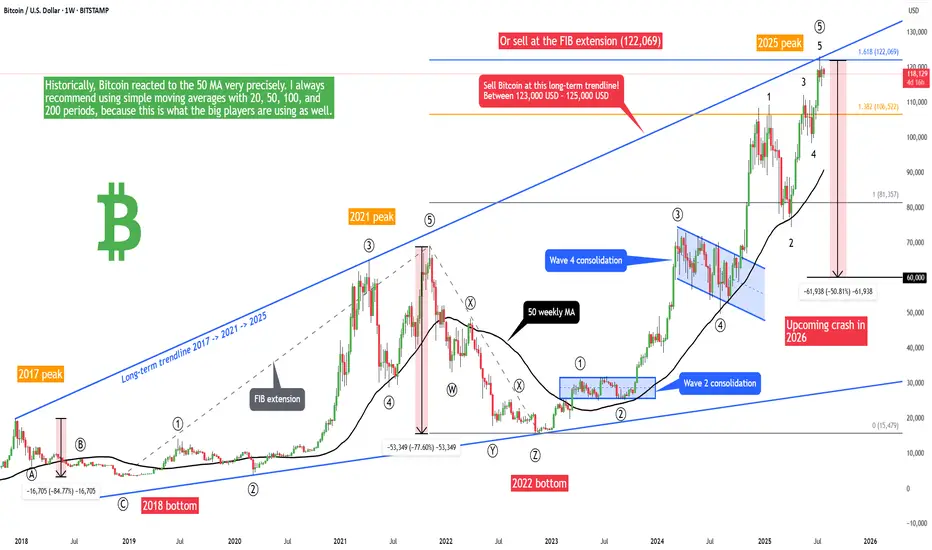
Bitcoin - 50% crash is starting! (2017 trendline, huge warning)Bitcoin is in the final stage of the bullish cycle, and we want to look for the best price to sell and prepare for the 2025/2026 bear market! The best price to sell Bitcoin is at the 1.618 FIB extension or at the main long-term 2017-2021-2025 trendline. This is exactly at 122,069, as we can see on t
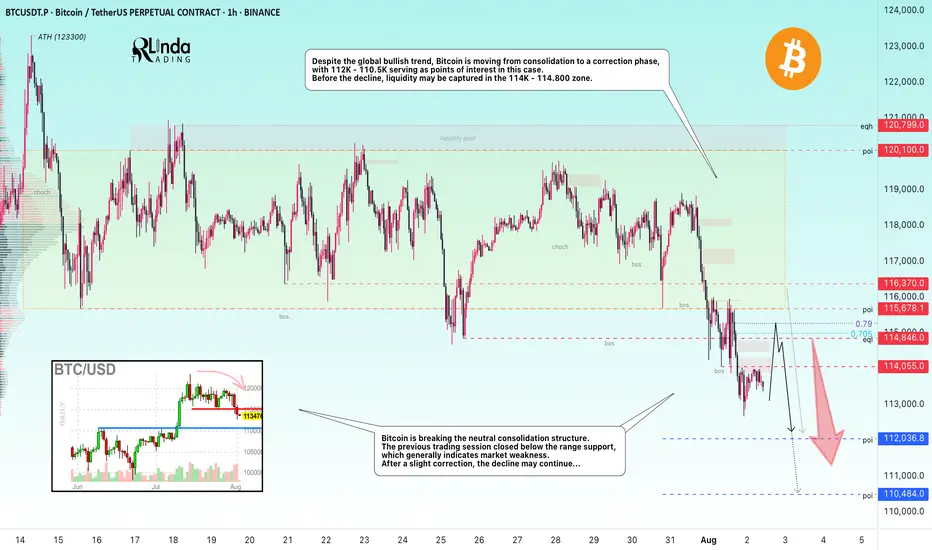
BITCOIN → From consolidation to distribution. Market weaknessBINANCE:BTCUSDT.P is moving from consolidation to a correction phase. The price broke through the support zone of 114.5–115.5, closing within the Friday trading session in the sell zone...
Previous idea from July 22: BITCOIN → Consolidation and compression to 116K. Correction?
The fundamenta
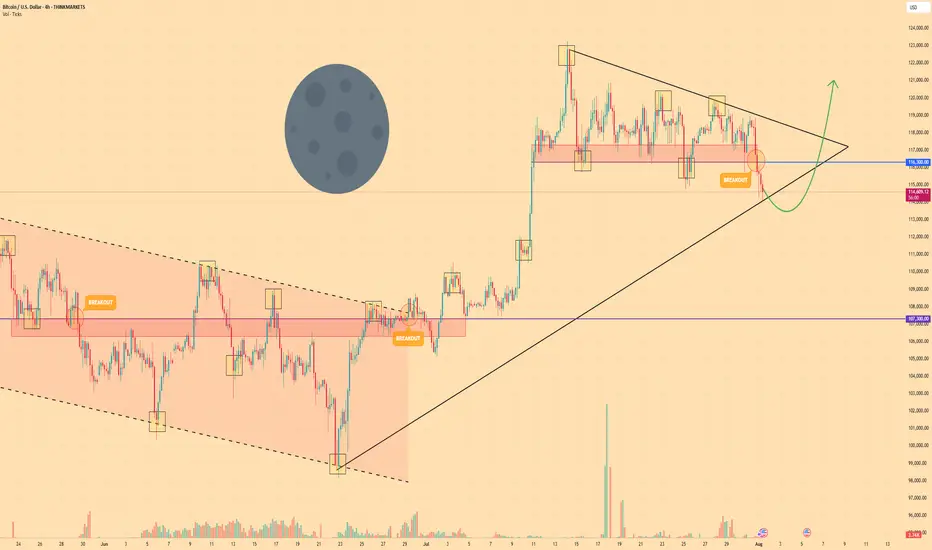
BITCOIN - Price can turn around and start to move upHi guys, this is my overview for BTCUSD, feel free to check it and write your feedback in comments👊
The price reversed its prior downtrend with a decisive breakout from a falling channel.
This breakout triggered a strong upward impulse, which then began to consolidate into a large symmetrical penn
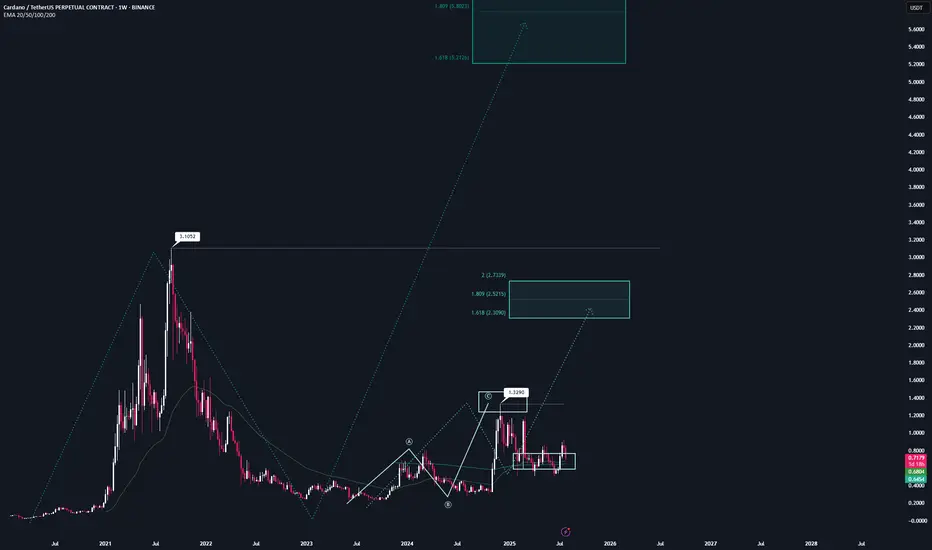
ADA | Full AnalysisHere is the top-down analysis for CRYPTOCAP:ADA as requested 🫡
Weekly Timeframe:
We have one large potential sequence on the weekly chart that will be activated once we break the ATH at $3.1, with a target zone around $5.2. This is also my conservative target for this bull run, assuming we get
BTC DOMINANCE UPDATE- So, all elements are annotated throughout the graphic, like always.
- Timeline.
- Older Top Dom (2021) (red doted line).
- New Top Dom (2025) (red line).
- Some supports ( Orange Line ).
- Some Bottoms ( Green Lines ).
- Most important in chart : Fibonnacci Retracements.
- After this chart, I’l

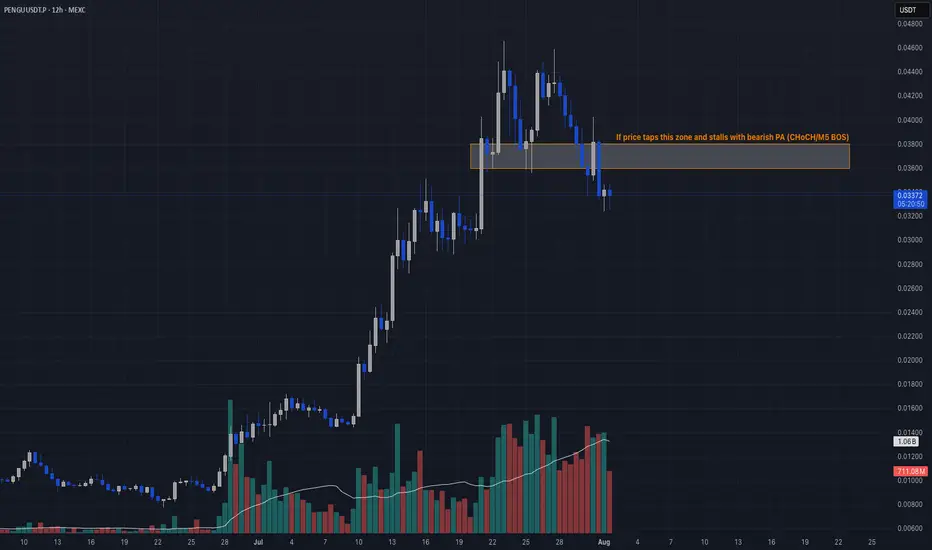
Insider Selloff + Liquidity Sweep🔻 PENGU/USDT TRADE IDEA 🔻
📣 Hey CandleCraft crew!
Today we’re diving into a chilly little bird that flew a bit too close to the heat. 🐧 PENGU pumped hard — but when team wallets start dumping $17M worth of tokens, that’s not bullish, that’s suspicious. Think iceberg ahead.
🔥 TRADE SETUP
Bias: Shor
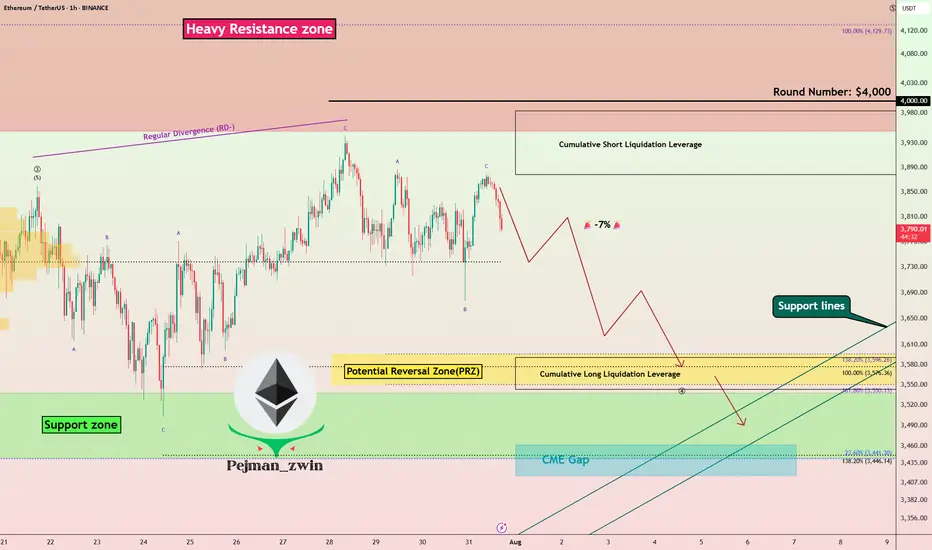
ETH at Critical Resistance + Liquidation Zone | Time to Short?Today I want to analyze Ethereum ( BINANCE:ETHUSDT ) on the 1-hour time frame . Is there a short position opportunity?
Please stay with me.
Ethereum is currently trading near a Heavy Resistance zone($4,390-$3,950) , Cumulative Short Liquidation Leverage($3,983-$3,878) and the $4,000 (
TradeCityPro | Bitcoin Daily Analysis #142👋 Welcome to TradeCity Pro!
Let's get into the Bitcoin analysis. Yesterday, Bitcoin continued its correction and we need to see what is going to happen in the market today.
📅 Daily Timeframe
First, let’s take a look at the higher timeframe. On the daily chart, that curved upward trendline we had wa

See all crypto ideas
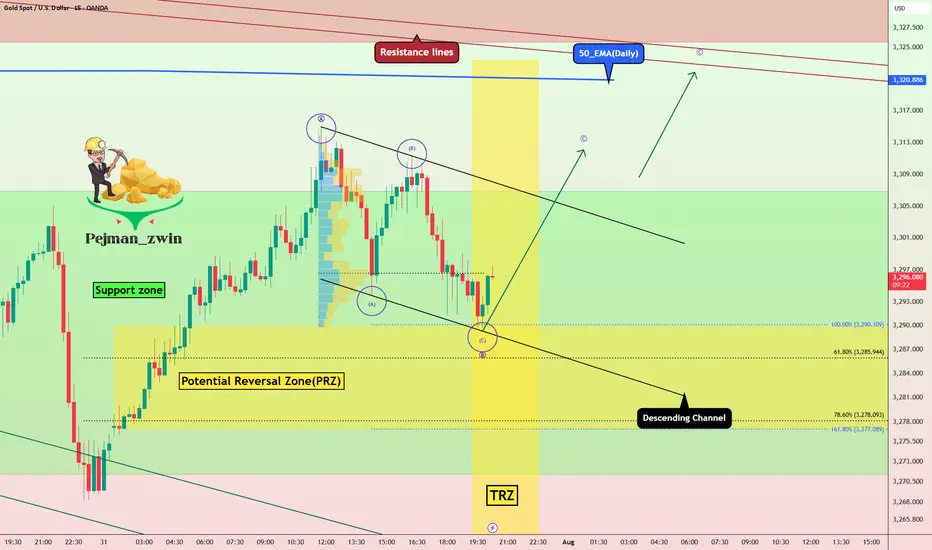
Gold in PRZ + TRZ: Is a Bullish Reversal Brewing(Short-term)?Gold , as I expected in yesterday's idea , fell to the Potential Reversal Zone(PRZ) and started to rise again .
Today's Gold analysis is on the 15-minute time frame and is considered short-term , so please pay attention .
Gold is currently trading in the Support zone($3,307-$3,275)
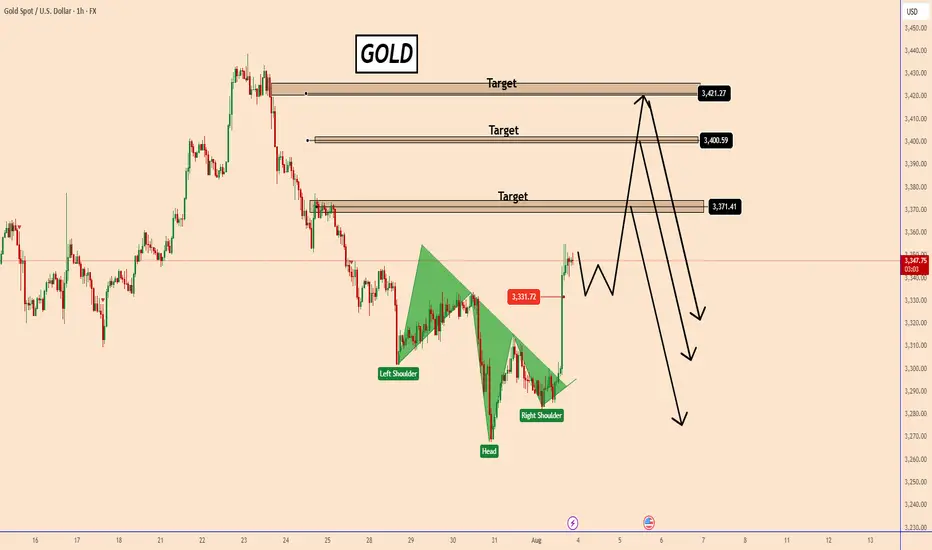
GOLD: Be careful, It's More Complex Than it SeemsGOLD: Be careful, It's More Complex Than it Seems
After the NFP data came in at 73k vs. the expected 110k, the market reacted aggressively to the US dollar. Today, the US dollar was affected on two fronts.
One was the NFP data and the other was the mess that President Trump is creating with his
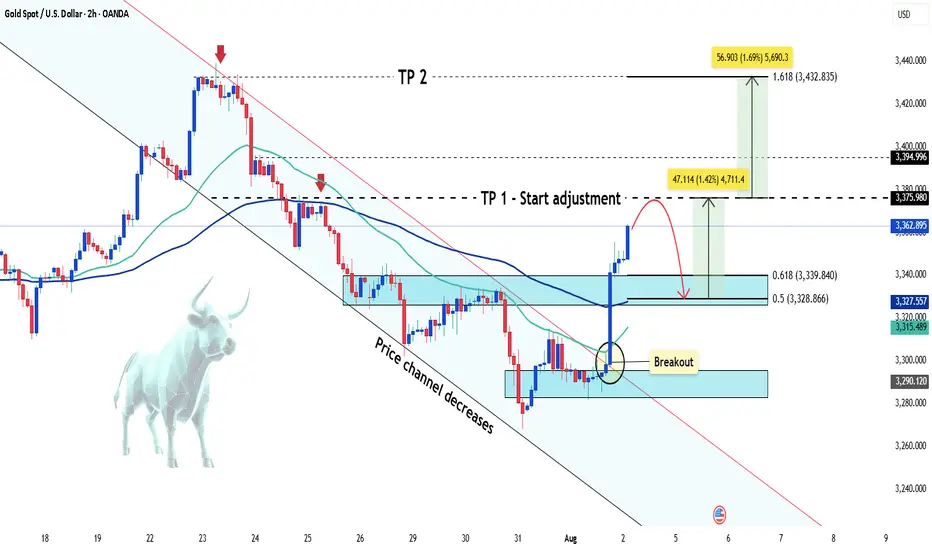
Gold suddenly increased sharply Hey everyone, let’s dive into what’s happening with XAUUSD!
Gold is experiencing a remarkable rally this weekend, skyrocketing from the $3,285 zone to around $3,362 — gaining over 700 pips. This sharp move comes amid weakening U.S. labor market data, which has fueled speculation that the Federal R
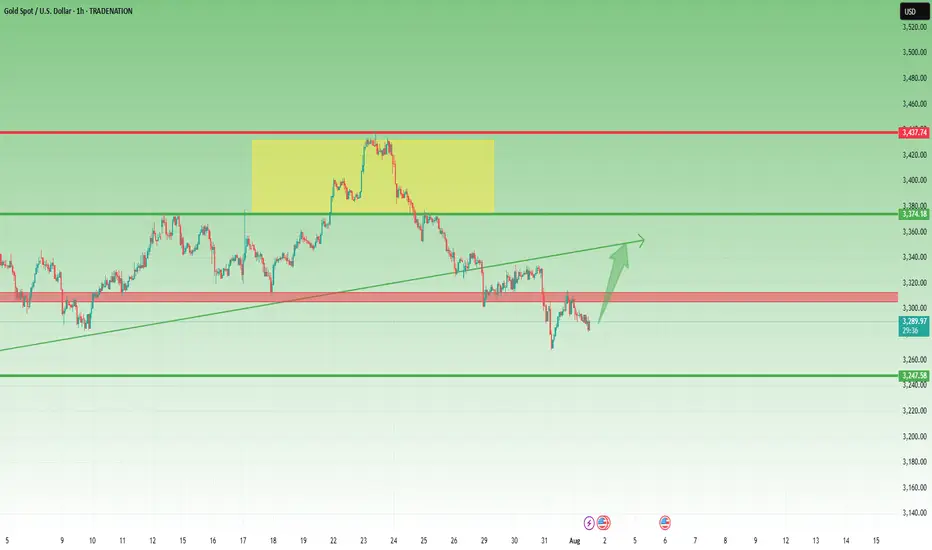
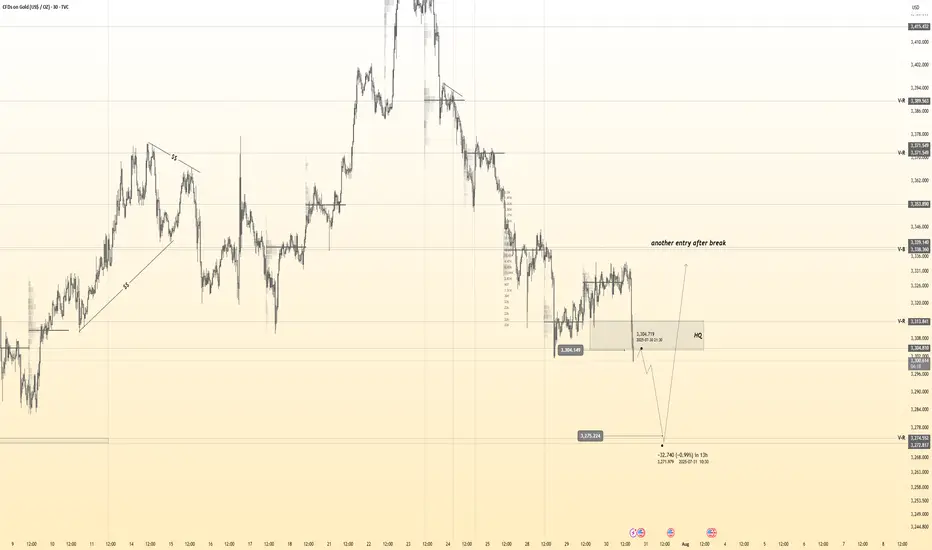
Gold Rejected at 3315 – But Bulls Might Not Be Done Yet📌 What happened yesterday?
During the Asian session, Gold printed a fresh local low at 3268, continuing the downtrend that already dropped over 1700 pips in just one week. However, that move quickly reversed, and we saw a natural corrective bounce.
📈 Resistance holds firm
The correction took pr
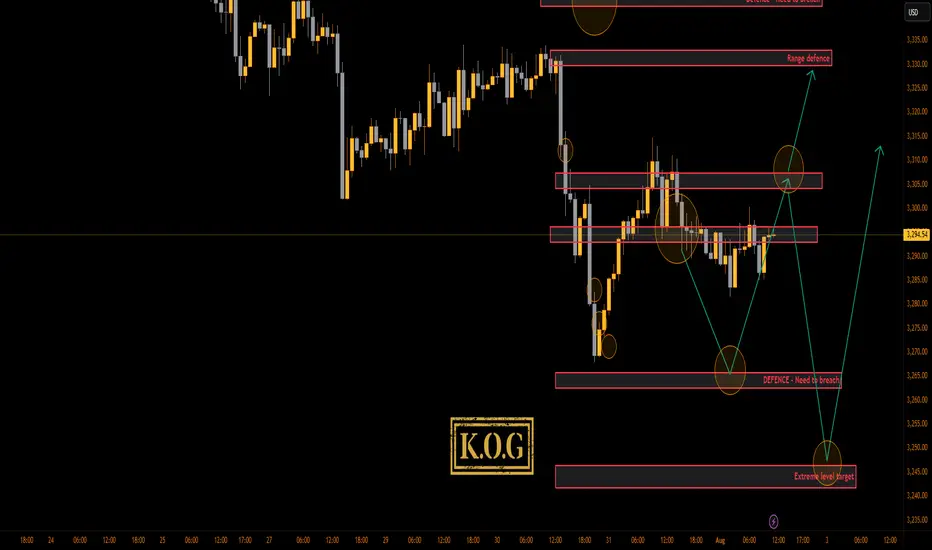
THE KOG REPORT - NFPTHE KOG REPORT – NFP
This is our view for NFP, please do your own research and analysis to make an informed decision on the markets. It is not recommended you try to trade the event if you have less than 6 months trading experience and have a trusted risk strategy in place. The markets are extrem
The trend is clear, why do I choose to be firmly bullish on goldGold Trend Analysis: Yesterday, the gold market demonstrated strong upward momentum, opening near 3290 before falling slightly to a low of 3281 before fluctuating upward. Boosted by the non-farm payroll data, the gold market surged during the US trading session, reaching a single-day gain of 2.02%,

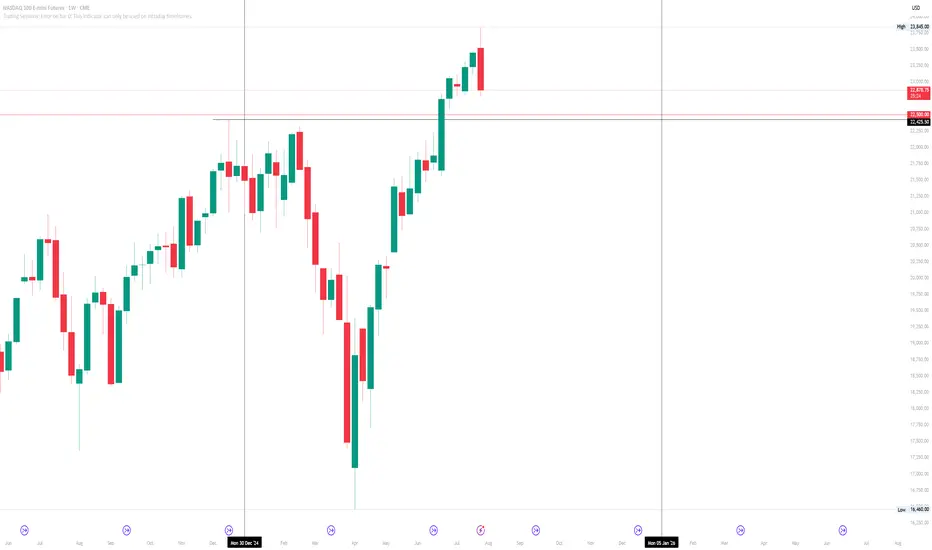
Nasdaq outlook on the weekly.... Where will price go next?Market cycle outlook on the year :
We have now reached a new month.
August 1st, which a new market cycle for the month to form, along beginning the backend of the year 2025 and the front end of a new week coming.
Closed bearish this week along with hitting all time highs once again for the Nasda
Gold 30Min Engaged ( Buy & Sell Reversal Entry Detected )Time Frame: 30-Minute Warfare
Entry Protocol: Only after volume-verified breakout
🩸Bearish Reversal - 3304
🩸Bullish Reversal - 3275
➗ Hanzo Protocol: Volume-Tiered Entry Authority
➕ Zone Activated: Dynamic market pressure detected.
The level isn’t just price — it’s a memory of where they moved s
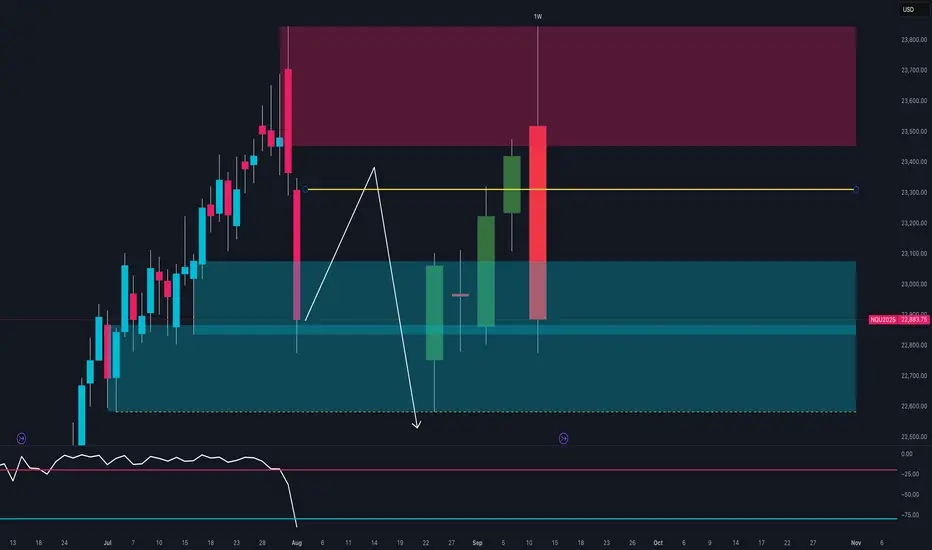
NASDAQ at Key Turning Point 🔍Technical Context
After testing the 23,600–23,800 supply zone, price printed a strong bearish rejection with a weekly engulfing candle.
The RSI broke decisively below the midline, signaling a clear loss of momentum.
Price is now trading back within the weekly demand zone between 22,800 and 22,950
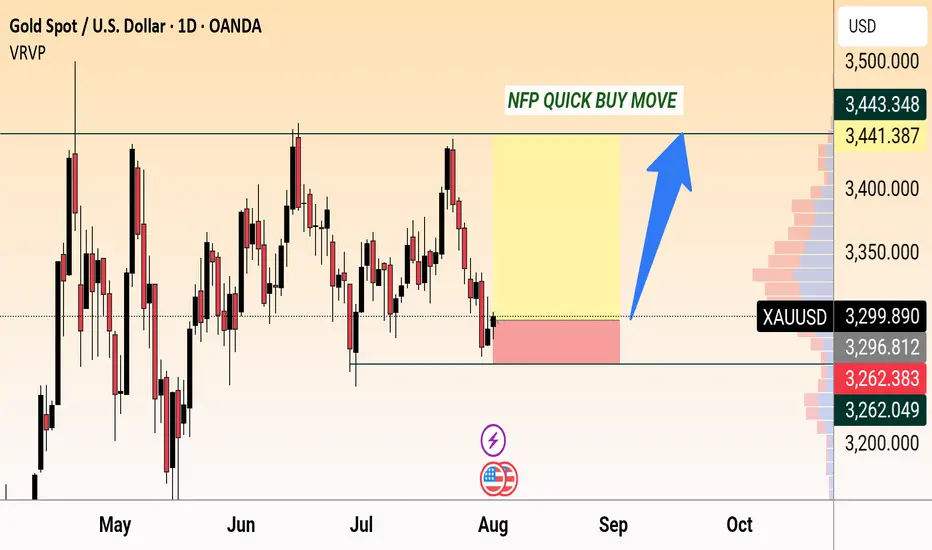
NFP quick buy moveGold (XAUUSD) forms support near 3,262 with a potential bullish move expected on NFP news. Targeting 3,443 resistance zone for a quick buy opportunity.
See all futures ideas
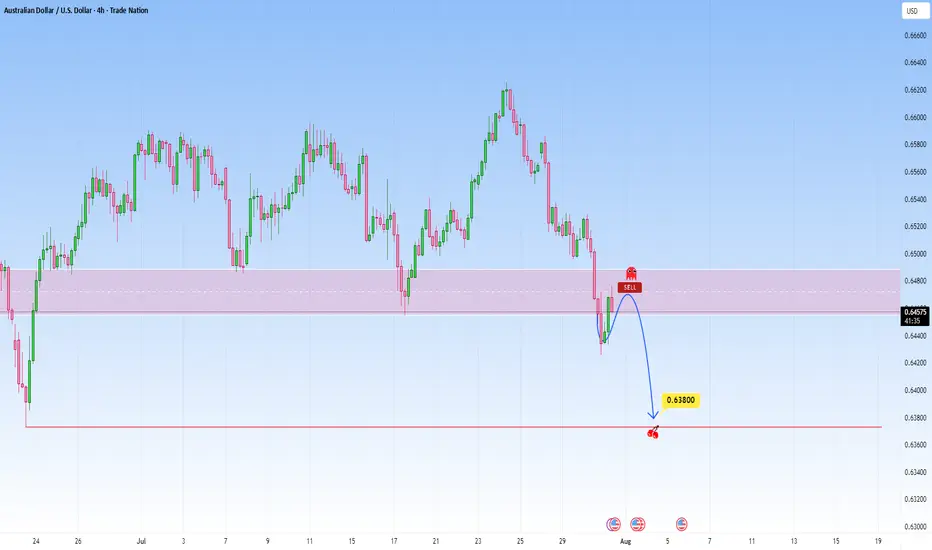
AUDUSD: Bearish Continuation from broken supportThe current setup is a clean example of a trend continuation play. Price recently broke decisively below a structure zone, this break and retest now flips the narrative, what once was a buy zone is now an opportunity for short entries.
Following the aggressive move down, price now began pulling bac
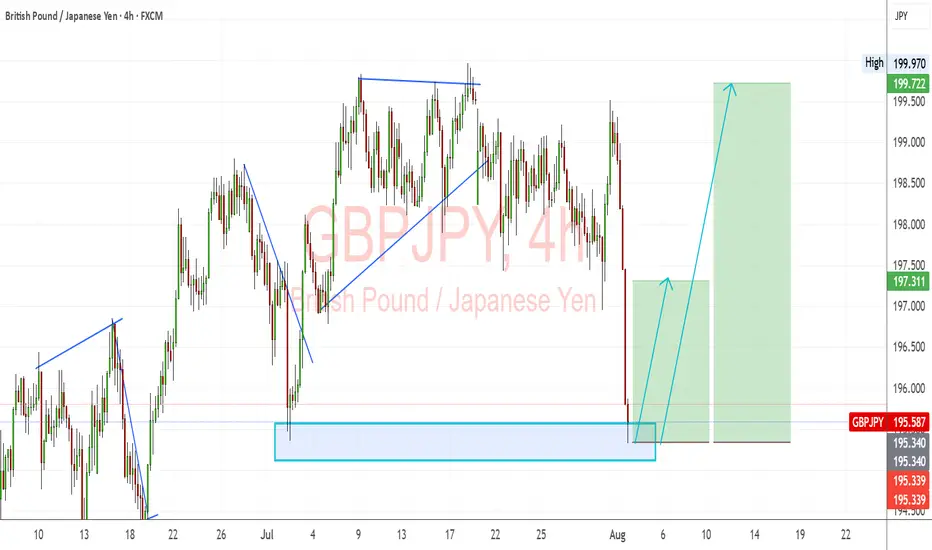
GBPJPY: Strong Bullish Reversal from Demand ZoneGBPJPY has bounced sharply from a key demand zone, indicating renewed bullish momentum. The pair continues to follow the broader bullish bias in GBP crosses, with JPY weakness driven by the Bank of Japan's dovish policy stance.
Technical Analysis (4H Chart)
Pattern: Bullish rejection from the 195.3
USDJPY 30Min Engaged (Bullish Reversal Entry Detected )➕ Objective: Precision Volume Execution
Time Frame: 30-Minute Warfare
Entry Protocol: Only after volume-verified breakout
🩸 Bullish Reversal : 147.450
➗ Hanzo Protocol: Volume-Tiered Entry Authority
➕ Zone Activated: Dynamic market pressure detected.
The level isn’t just price — it’s a memory of
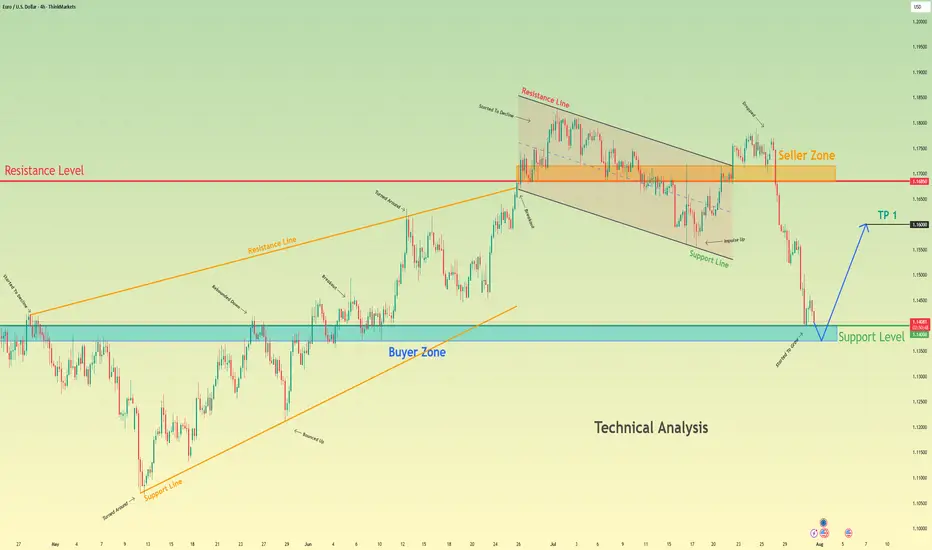
Euro bounce from buyer zone and start to move upHello traders, I want share with you my opinion about Euro. After a prolonged upward trend which formed a large rising wedge, the EURUSD faced a significant rejection from the seller zone near the 1.1685 resistance level. This failure to continue higher marked a key turning point, exhausting the bul
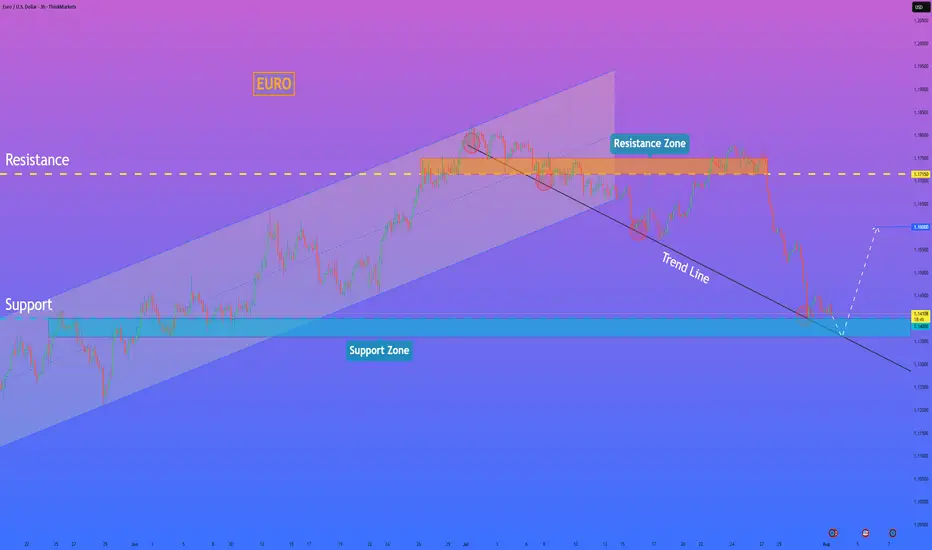
HelenP. I Euro will rebound from trend line to $1.1600 pointsHi folks today I'm prepared for you Euro analytics. A structural review of the chart shows a clear change in market character. The previous long-term upward channel has been broken, and the price has since entered a corrective phase, currently guided by a descending trend line. This decline has brou
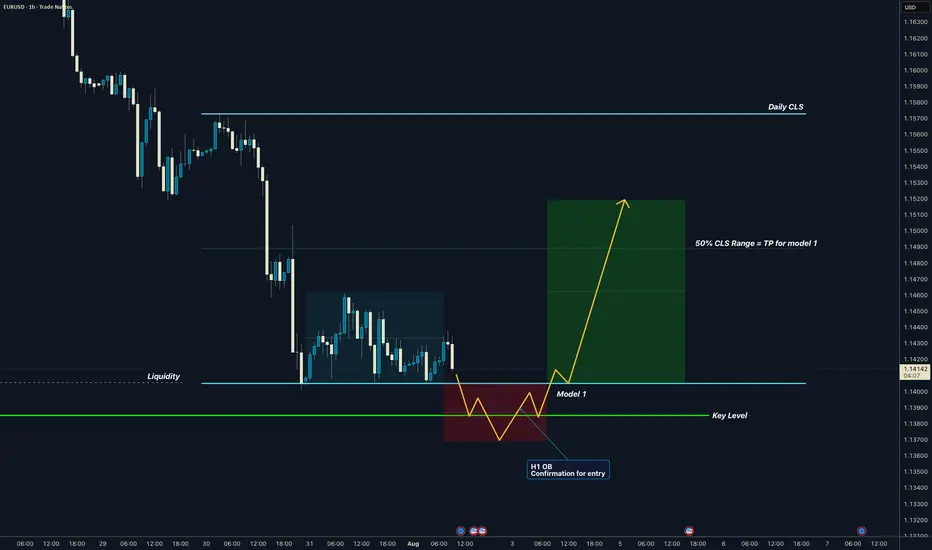
EURUSD I Daily CLS I Model 1 I KL - OB I TP 50% CLSYo Market Warriors ⚔️
Fresh outlook drop — if you’ve been riding with me, you already know:
🎯My system is 100% mechanical. No emotions. No trend lines. No subjective guessing. Just precision, structure, and sniper entries.
🧠 What’s CLS?
It’s the real smart money. The invisible hand behind $7T/d
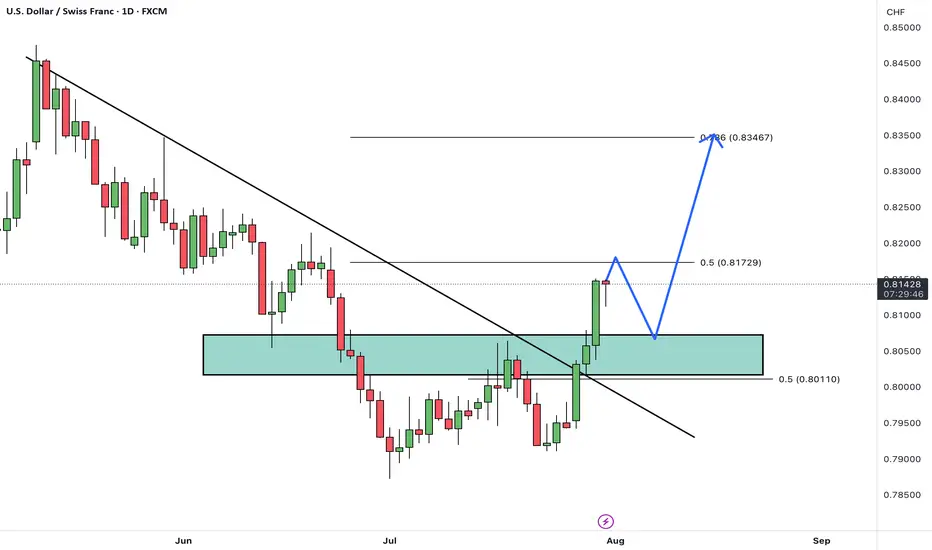
USDCHFHello Traders! 👋
What are your thoughts on USDCHF?
USD/CHF has broken above its descending trendline and cleared a resistance zone, signaling a potential trend reversal and growing bullish momentum.
After some minor consolidation and a pullback to the breakout zone, we expect the pair to continue i
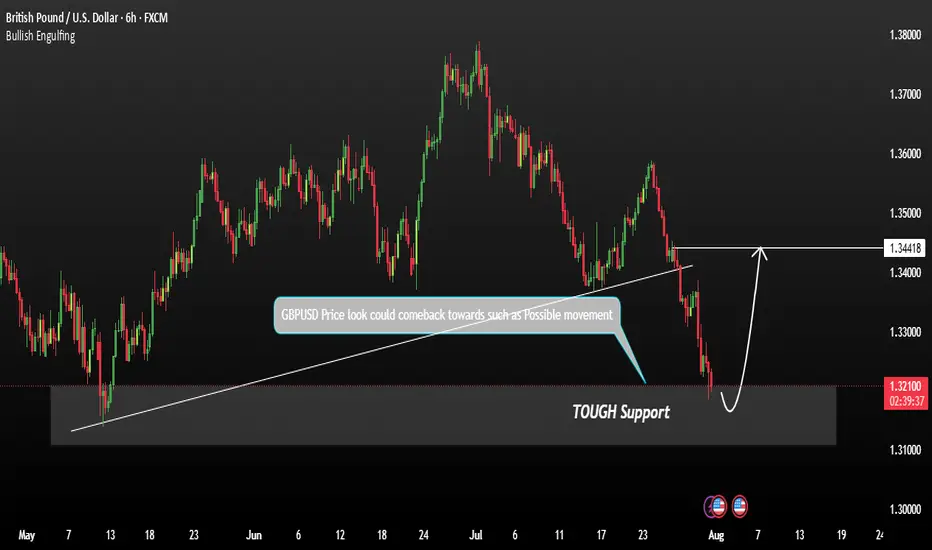
GBPUSD shows signs of a potential recoveryGBPUSD shows signs of a potential recovery towards the resistance zone. This price action indicates a possible short-term reversal or consolidation phase. We are currently observing for confirmation signals such as:
These could signal a build-up for a move back toward the key resistance at 1.34400.
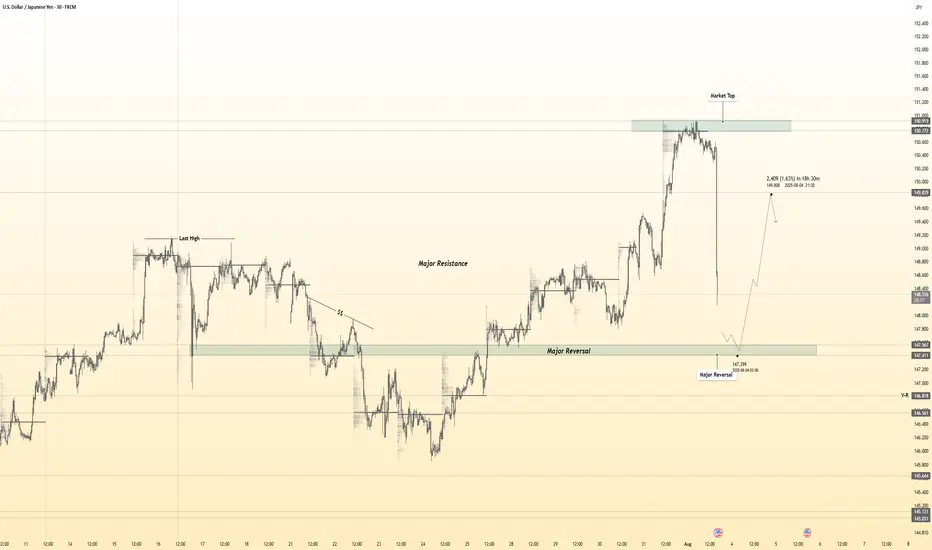
USD/JPY Wyckhoff Accumulation on weekly Chart Looks like a fairly textbook Wyckhoff accumulation on the USD/JPY Pair and looking ready to move up and to the right soon.

See all forex ideas
| - | - | - | - | - | - | - | ||
| - | - | - | - | - | - | - | ||
| - | - | - | - | - | - | - | ||
| - | - | - | - | - | - | - | ||
| - | - | - | - | - | - | - | ||
| - | - | - | - | - | - | - | ||
| - | - | - | - | - | - | - | ||
| - | - | - | - | - | - | - |
Trade directly on the supercharts through our supported, fully-verified and user-reviewed brokers.


