Beating the S&P 500 with TradingView's Stock ScreenerThis is Mo from MWRIGHT TRADING. The date is Friday, June 27th, 2025.
This video is about selecting stocks that collectively have the potential to consistently beat the S&P 500
I look for smooth and consistent long-, mid-, and short-term performance. For that we need
Building a Screener
What I

The best trades require research, then commitment.
Get started for free$0 forever, no credit card needed

Scott "Kidd" PoteetThe unlikely astronaut

Where the world does markets
Join 100 million traders and investors taking the future into their own hands.

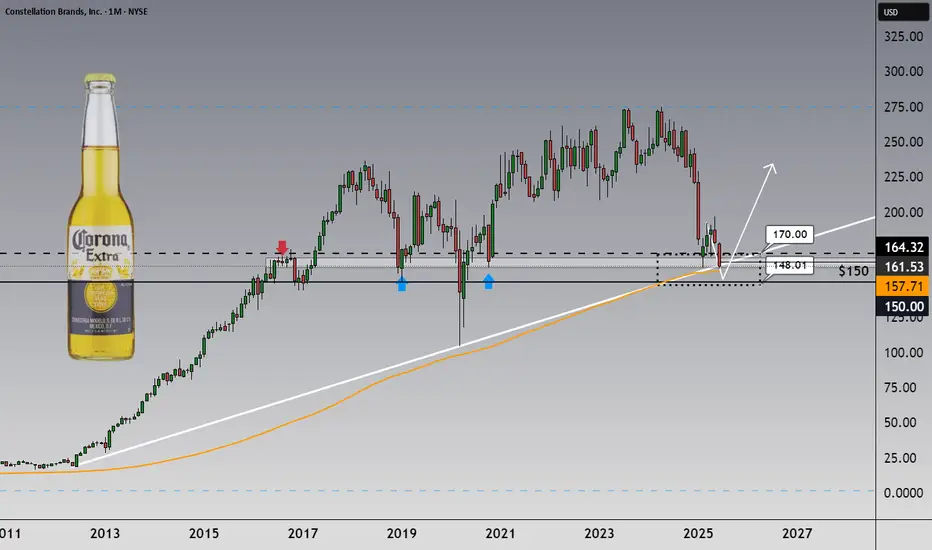
27% Cheaper Than Buffett’s Buy – And Sitting on a Key ZoneHi,
One of the most recent and notable additions to Berkshire Hathaway’s portfolio is Constellation Brands NYSE:STZ — and if that’s not a fundamental vote of confidence, I don’t know what is.
And hey, while Midsummer Day is behind us, warm and sunny summer evenings still lie ahead. So why not ma
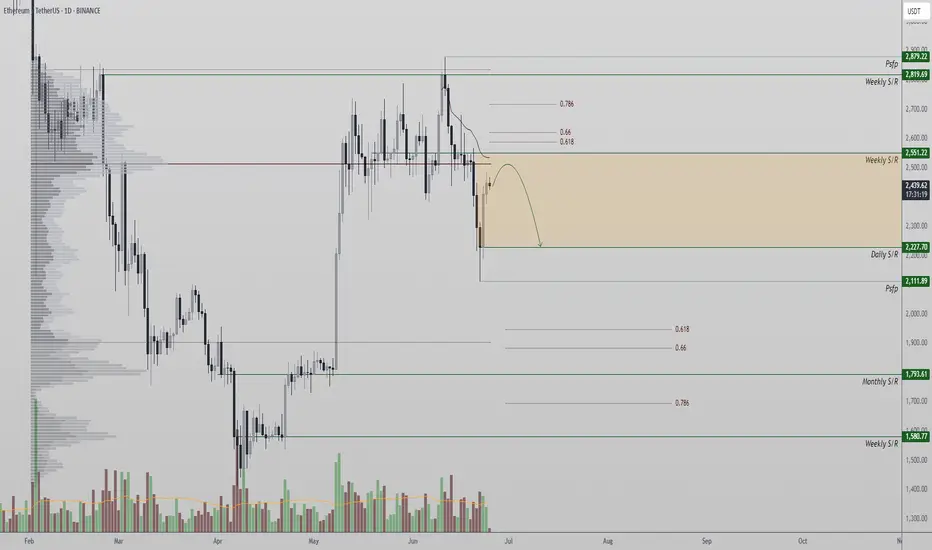
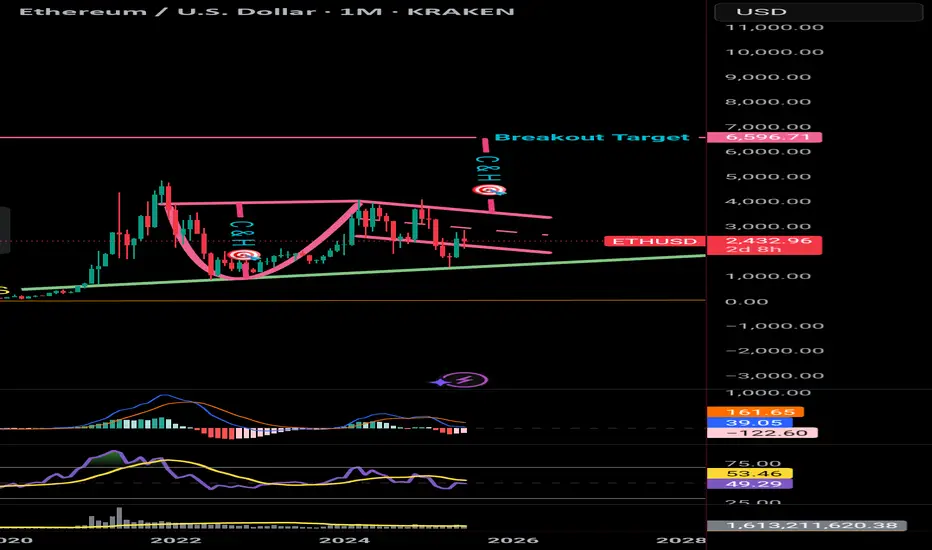
Ethereum at Key Resistance After Short Squeeze BounceEthereum recently found a local bottom at $2,111, triggering a sharp bounce that resembles a short squeeze. However, the rally has met a significant resistance zone—a former support level now flipped into resistance. This zone is technically loaded with multiple confluences: the point of control, th
Nasdaq All-Time Highs, S&P Close, Blast Off or Breakdown?What an incredible melt-up since April 7 lows in the US markets.
Trump vs Musk - ignored
Iran vs Israel - ignored
High Valuations - ignored
FED Pausing - ignored
The US economy is resilient and it's a good thing because the world is performing really well (EX-US). Europe/China/India/Emerging Marke

AUD/USD, AUD/JPY: Soft CPI A Gift For RBA Doves?I have long said that the RBA could cut in July, and today's CPI figures all but confirm one is on tap. But with AUD/USD and AUD/JPY are rising, will bears get their say?
Matt Simpson, Market Analyst at City Index and Forex.com

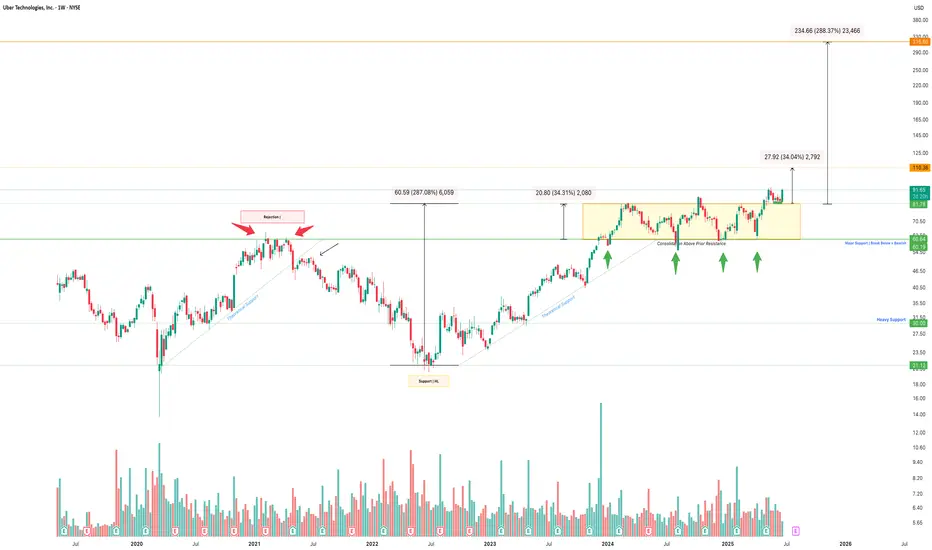
Ride UBER to $300.00 The chart of Uber Technologies Inc. (UBER) showcases a multi-year bullish setup following a prolonged accumulation phase and key breakout signals:
Consolidation: The stock entered a horizontal consolidation phase above previous resistance, now acting as strong support ($60–$80), confirmed by multip
Bitcoin Analysis 23-Jun-25Bitcoin price in the weekend retested around 98,500$, this drop was mainly supported by the fear in the markets due to the escalations in the Middle East, & the US taking part in the War.
In this short analysis video, we will be discussing the Areas of interest and possible price movement we coul

Coffee just gave a two-bar reversal to go long6 23 25 oil just went higher presumably from what happened with Tehran... and I heard several people say that oils going a lot higher. I really don't believe that but more importantly we can use some of the tools on the chart to decide when to take trades as a buyer and a seller. there's a cl

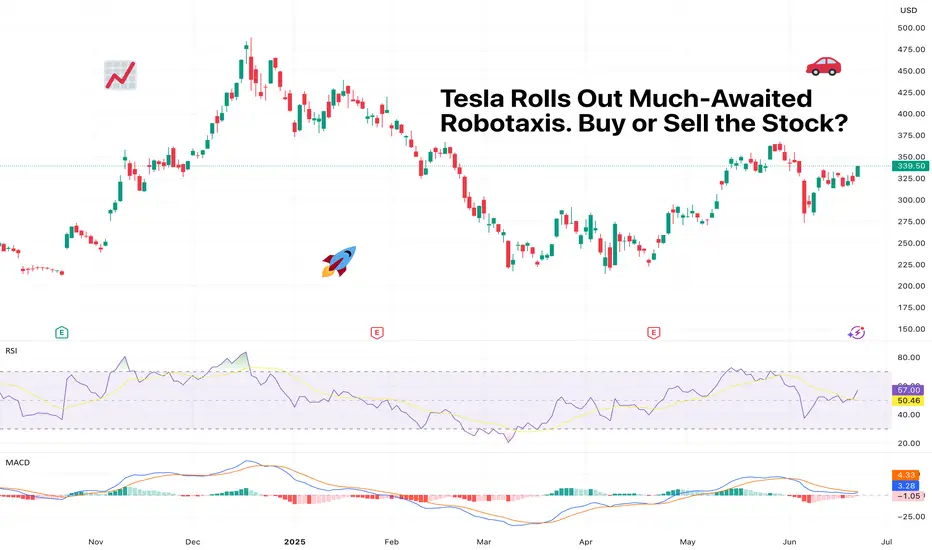
Tesla Rolls Out Much-Awaited Robotaxis. Buy or Sell the Stock?They’re here. After years of tweets, teasers, and timelines that aged like unrefrigerated dairy, Tesla NASDAQ:TSLA officially launched its long-awaited robotaxi service in Austin, Texas.
The self-driving revolution, we were told, would arrive like a lightning bolt. Instead, it quietly rolled up
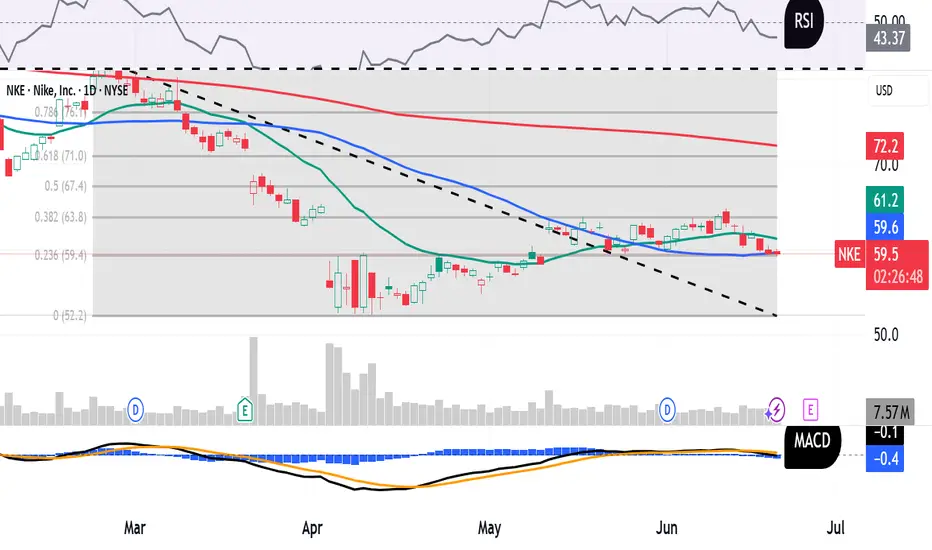
Will Nike’s Upcoming Earnings ‘Just Do It’ for Investors?This hasn’t been the greatest year for Nike NYSE:NKE , which will report earnings next Thursday at a time when the stock is down more than 20% year to date. What does technical and fundamental analysis say might happen to the stock from here?
Let’s take a look:
Nike’s Fundamental Analysis
NKE
See all editors' picks ideas
Color█ OVERVIEW
This library is a Pine Script® programming tool for advanced color processing. It provides a comprehensive set of functions for specifying and analyzing colors in various color spaces, mixing and manipulating colors, calculating custom gradients and schemes, detecting contrast, and con

Tensor Market Analysis Engine (TMAE)# Tensor Market Analysis Engine (TMAE)
## Advanced Multi-Dimensional Mathematical Analysis System
*Where Quantum Mathematics Meets Market Structure*
---
## 🎓 THEORETICAL FOUNDATION
The Tensor Market Analysis Engine represents a revolutionary synthesis of three cutting-edge mathematical framework

SIP Evaluator and Screener [Trendoscope®]The SIP Evaluator and Screener is a Pine Script indicator designed for TradingView to calculate and visualize Systematic Investment Plan (SIP) returns across multiple investment instruments. It is tailored for use in TradingView's screener, enabling users to evaluate SIP performance for various as

Wavelet-Trend ML Integration [Alpha Extract]Alpha-Extract Volatility Quality Indicator
The Alpha-Extract Volatility Quality (AVQ) Indicator provides traders with deep insights into market volatility by measuring the directional strength of price movements. This sophisticated momentum-based tool helps identify overbought and oversold conditio

Bitcoin Power Law Clock [LuxAlgo]The Bitcoin Power Law Clock is a unique representation of Bitcoin prices proposed by famous Bitcoin analyst and modeler Giovanni Santostasi.
It displays a clock-like figure with the Bitcoin price and average lines as spirals, as well as the 12, 3, 6, and 9 hour marks as key points in the cycle.
🔶

Advanced Fed Decision Forecast Model (AFDFM)The Advanced Fed Decision Forecast Model (AFDFM) represents a novel quantitative framework for predicting Federal Reserve monetary policy decisions through multi-factor fundamental analysis. This model synthesizes established monetary policy rules with real-time economic indicators to generate proba

Timeframe LoopThe Timeframe Loop publication aims to visualize intrabar price progression in a new, different way.
🔶 CONCEPTS and USAGE
I got inspiration from the Pressure/Volume loop, which is used in Mechanical Ventilation with Critical Care patients to visualize pressure/volume evolution during inhal

Deviation Trend Profile [BigBeluga]🔵 OVERVIEW
A statistical trend analysis tool that combines moving average dynamics with standard deviation zones and trend-specific price distribution.
This is an experimental indicator designed for educational and learning purposes only.
🔵 CONCEPTS
Trend Detection via SMA Slope: Detect

Rolling Z-Score Trend [QuantAlgo]🟢 Overview
The Rolling Z-Score Trend measures how far the current price deviates from its rolling mean in terms of standard deviations. It transforms price data into standardized scores to identify overbought and oversold conditions while tracking momentum shifts.
The indicator displays a Z-S

Yelober - Sector Rotation Detector# Yelober - Sector Rotation Detector: User Guide
## Overview
The Yelober - Sector Rotation Detector is a TradingView indicator designed to track sector performance and identify market rotations in real-time. It monitors key sector ETFs, calculates performance metrics, and provides actionable stock

See all indicators and strategies
Community trends
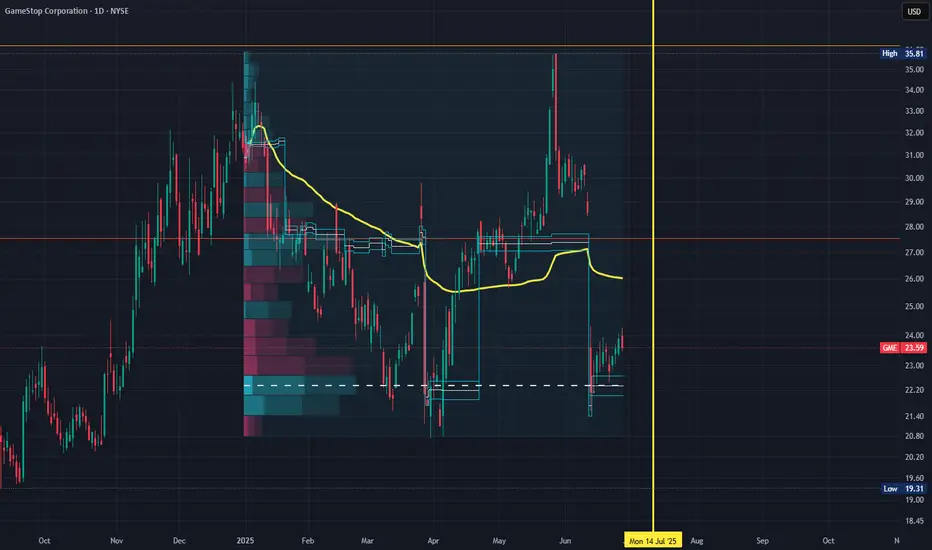
WC: 23.59 Target: 1800-2400 MOASS: 47k-100K: Waves of MomentumYes I still believe the 20 week cycle theory is still valid...lets get that out the way
Volatile stocks like GME are driven by two things mainly: SENTIMENT and the OPTIONS CHAIN
So what I plan to focus on from here on out is MOMENTUM
What I have been focused on behind the scenes is a better way t
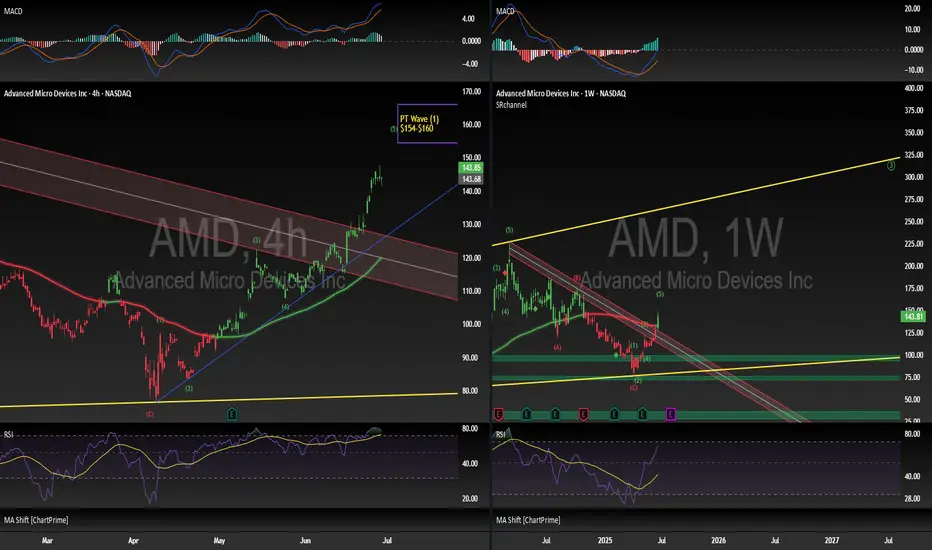
Long 4HR AND Weekly ( Finishing Wave 1)
4HR
NASDAQ:AMD is close to potentially finishing Wave 5 of a larger degree wave 1.
$154 is the calculate Fib extension of Wave 1+3 for a wave 5 however, there is plenty room for the stock to run with multiple $160+ Analyst upgrades.
From the Close Price on 6/27 to $160 there is a potential 11
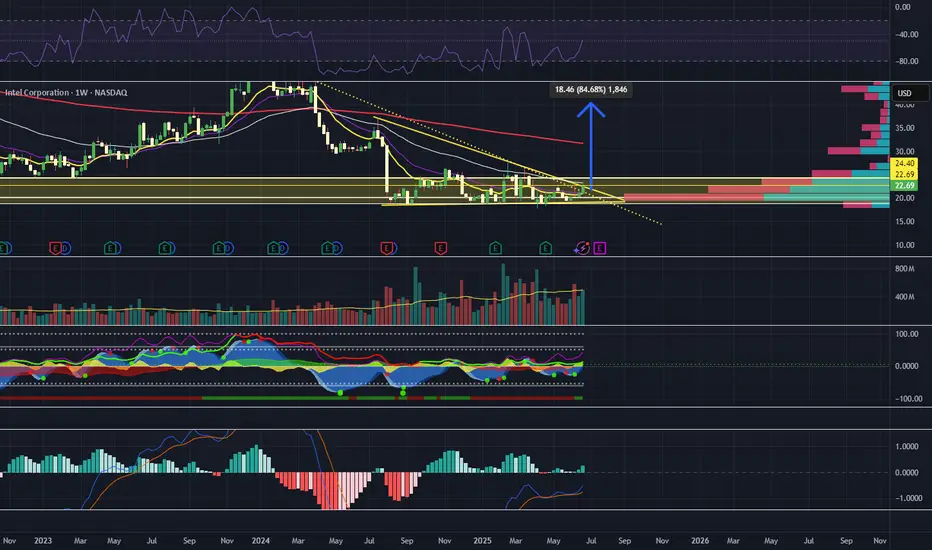
INTC getting ready to start it's upward trajectoryINTC has been ranging and coiling since July of 2024. It finally, is starting to look like bullish movement is about to break upwards.
As you can see, INTC has just broken the downward trend line as well as the triangle pattern. A break and hold above $24.40 would indicate the start of a new uptren
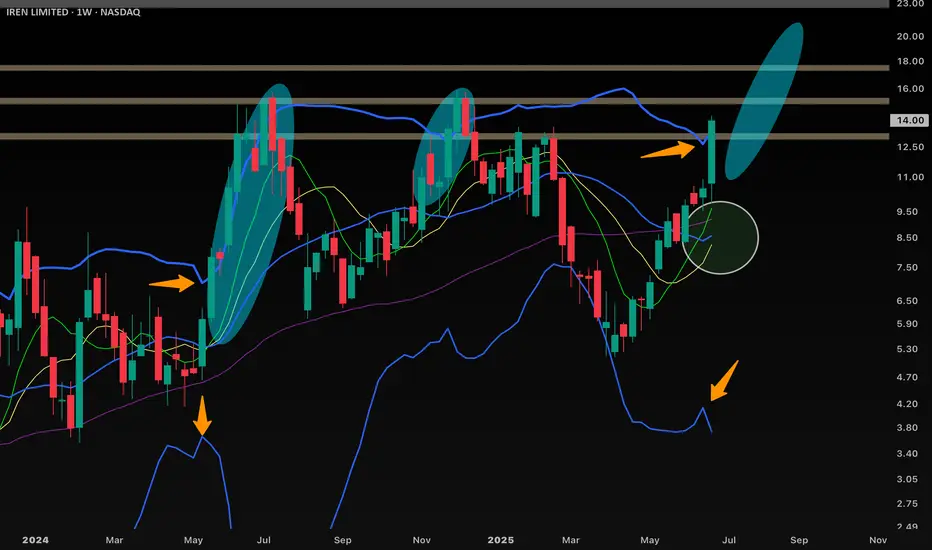
$IREN Weekly Bb expansion + SMA bullish alignmentNASDAQ:IREN Weekly bollingers have only looked this sharply expansionary a couple times in history.
Weekly SMA total bullish alignment has likewise also happened a couple times in its history.
But this time the bullish cross confluence will happen from much higher levels with a much stronger fu
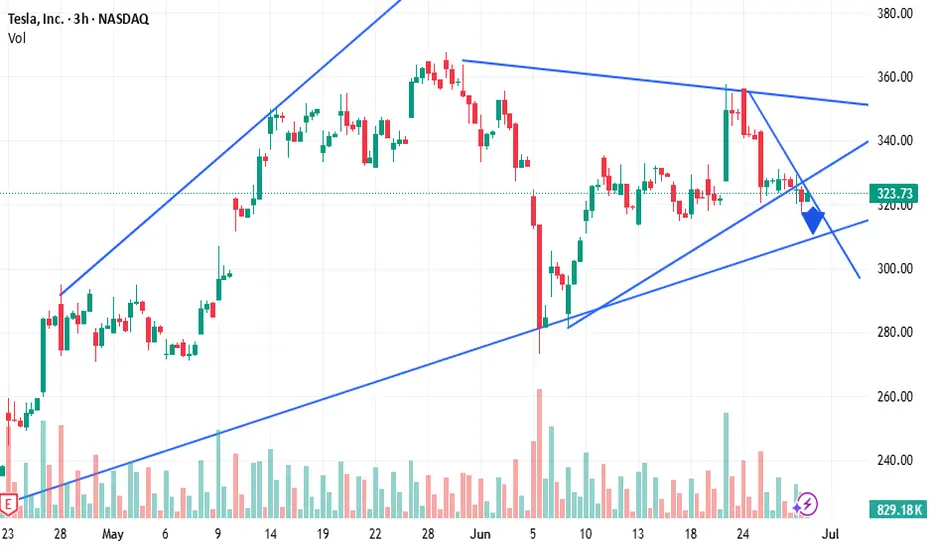
super sell on the run for TSLAwe looking for sells on this pair as you can see there is a trend moving up but there is likly to have a short sells going on now
Like this set up on GM using the 3 touch point TL StrategyLike this set up on GM using the 3 touch point trendline strategy

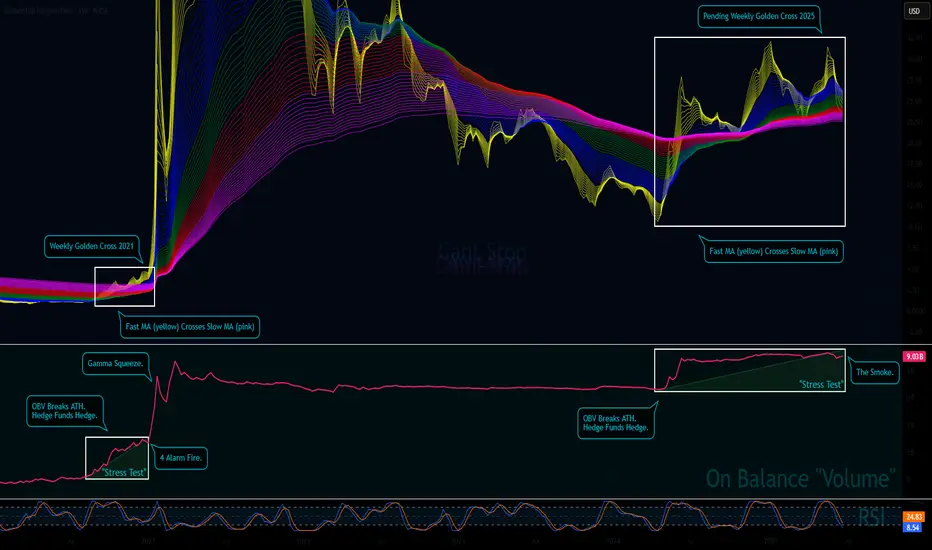
Cant Stop Wont Stop GameStopLast Weekly Golden Cross was January 25th, 2021.
We are now coming very close to our next Weekly Golden Cross 4 years later.
Fast MA on the Rainbow Ribbon has crossed over the Slow MA.
OBV has spiked and been building up in the same manner.
Stochastic-RSI is almost at ultra oversold & is general
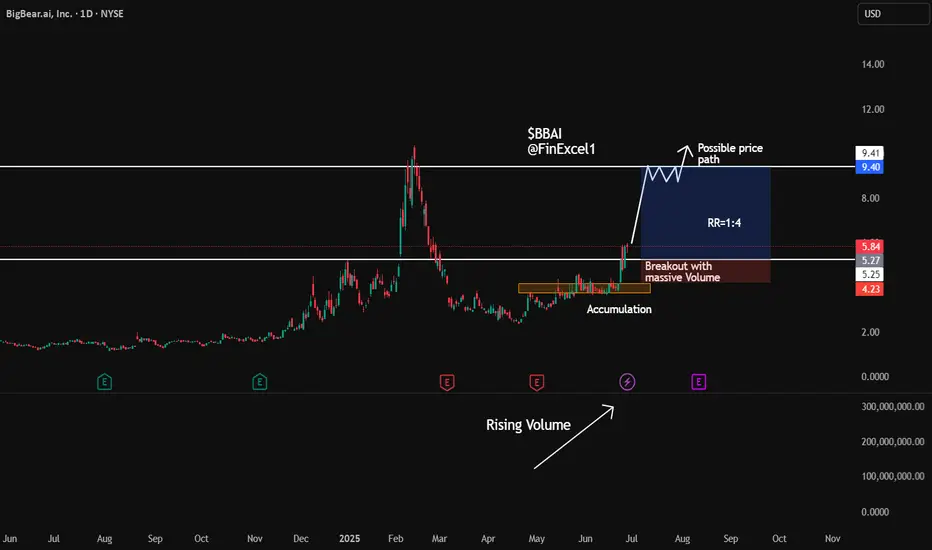
Potential BBAI setupI do not like companies with negative net income, however for growth potential stocks it might be natural.
The TA is bullish in the volume as we as the price. Massive volume has entered this stock.
This goes to risky portfolio segment.
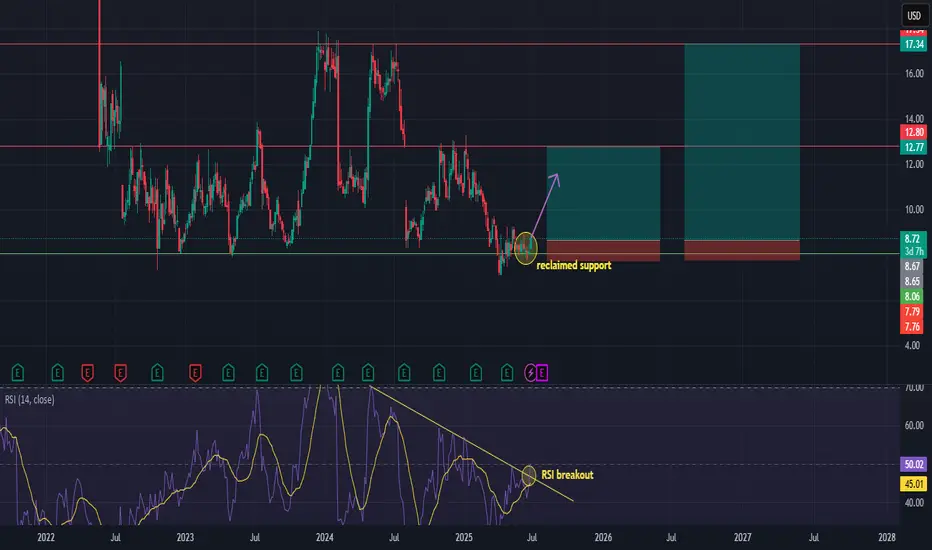
SNAP - Bullish Reversal in Playhi traders,
* Reclaimed Support Zone
Price has successfully reclaimed a key historical support around the $8.06–$8.72 range, which previously acted as a base before major rallies. This suggests growing buyer interest at this level.
* RSI Breakout
On the RSI, we’ve seen a clean breakout from a long
Beating the S&P 500 with TradingView's Stock ScreenerThis is Mo from MWRIGHT TRADING. The date is Friday, June 27th, 2025.
This video is about selecting stocks that collectively have the potential to consistently beat the S&P 500
I look for smooth and consistent long-, mid-, and short-term performance. For that we need
Building a Screener
What I
See all stocks ideas
Tomorrow
FIZZNational Beverage Corp.
Actual
—
Estimate
0.48
USD
Tomorrow
MEIMethode Electronics, Inc.
Actual
—
Estimate
0.00
USD
Tomorrow
FNGRFingerMotion, Inc.
Actual
—
Estimate
—
Tomorrow
QMCOQuantum Corporation
Actual
—
Estimate
−1.17
USD
Tomorrow
RDUSRadius Recycling, Inc.
Actual
—
Estimate
−0.40
USD
Tomorrow
PRGSProgress Software Corporation
Actual
—
Estimate
1.30
USD
Jul 1
MSMMSC Industrial Direct Company, Inc.
Actual
—
Estimate
1.03
USD
Jul 1
BNEDBarnes & Noble Education, Inc
Actual
—
Estimate
−0.81
USD
See more events
Community trends
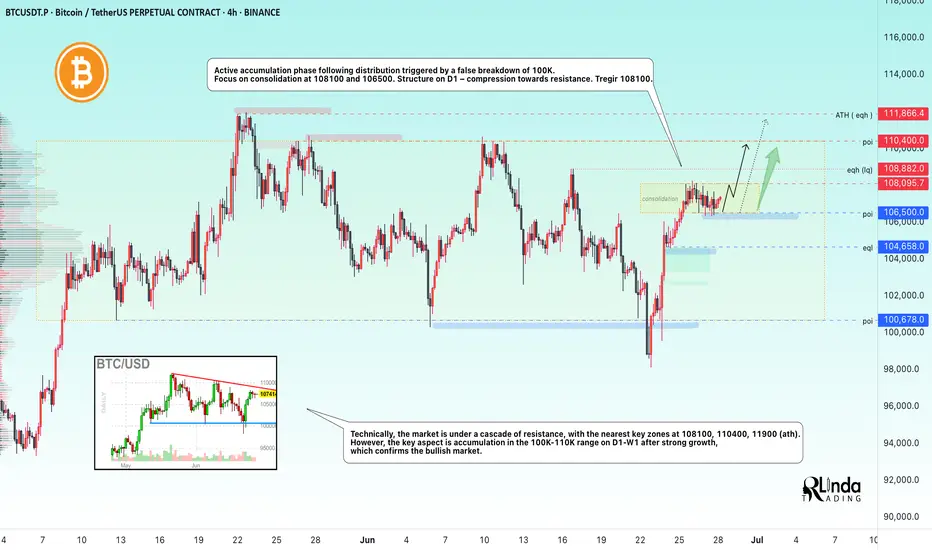
BITCOIN → Pause for consolidation before growth. 115K?BINANCE:BTCUSDT focus on the structure on D1. The market is forming local resistance and consolidation after growth. The fundamental background is positive. BTC is following the SP500
The market is recovering in line with the stock market (SP500, NQ) after the de-escalation of the situation in
BTC - Will the Bears finally get their chance?Buy Side Liquidity Sweep in Progress
Price is currently climbing toward a region densely packed with resting buy side liquidity, marked by multiple previous highs. The area around 108,900 to 111,000 is especially significant, with two clear liquidity pools stacked above recent swing highs. These le

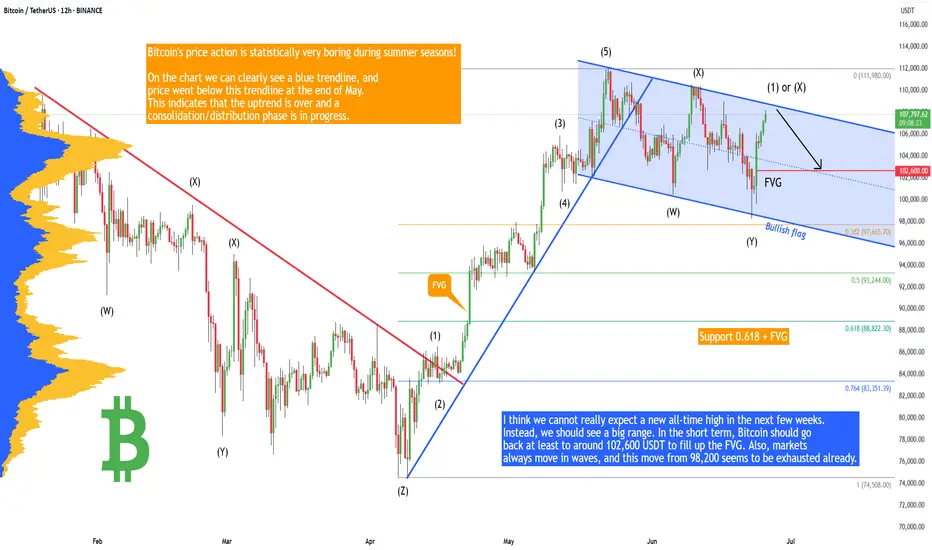
Bitcoin - Time to sell, huge drop will follow (must see!)Bitcoin is currently approaching a very strong resistance of this major bullish flag! We definitely want to sell resistances and buy supports, not the other way around, until we have confirmations. Bitcoin's price action is statistically very boring during summer seasons! Usually high volatility kic
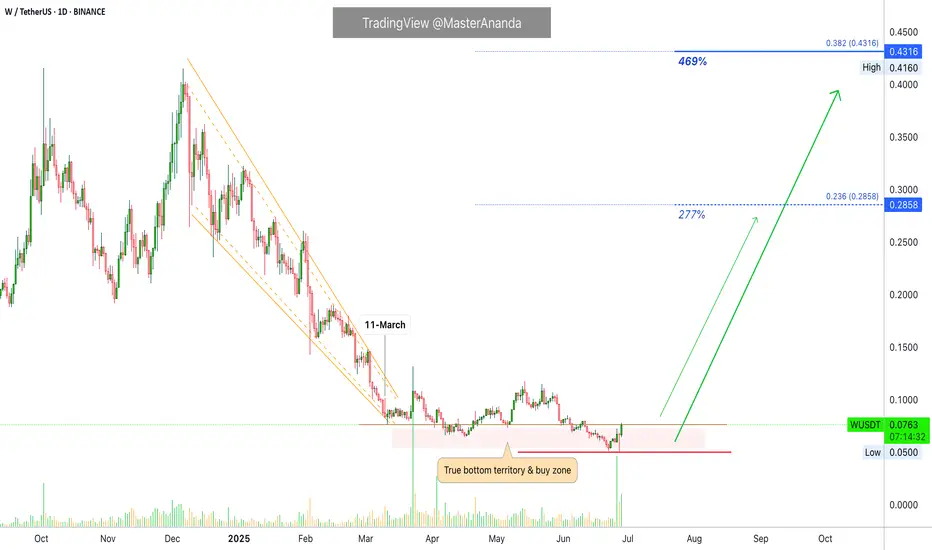
Wormhole Token Recovers From Bottom & Activates 2,400% PotentialTrue bottom and true recovery. We have a great situation here, this is a pair that has more than 2,400% potential for growth. The chart looks great right now, the signals are strong and confirmed.
Good afternoon my fellow Cryptocurrency trader, I hope you are having a nice Saturday. Let's consider
21D $BTC pattern to watchWanted to show a pattern I was looking at and analyzing the 21D (a fib number) and see the fib extensions match up on each breakout.
A tad confusing I know, but hope the visual helps.
Fibo

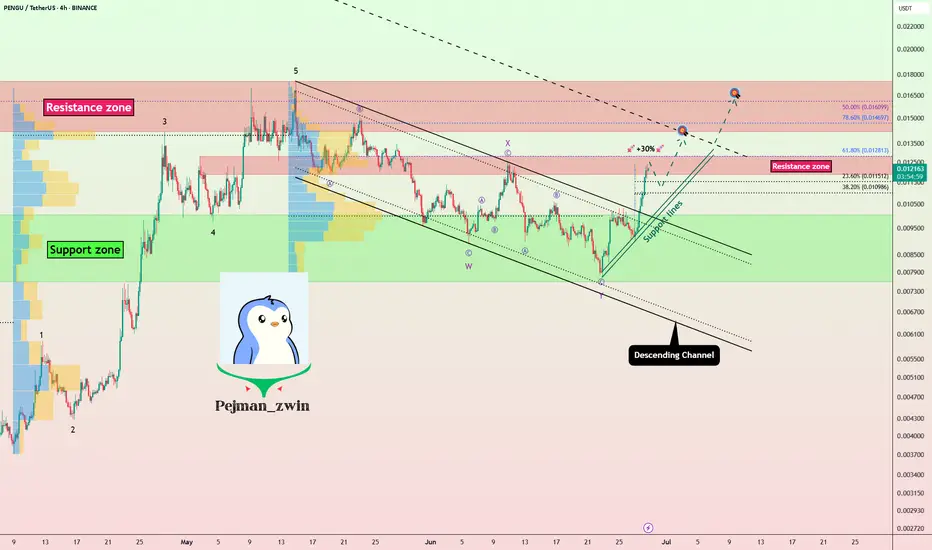
PENGU = ETF Catalyst + Whale Accumulation = +30% More Upside?Today, on the weekend, I want to analyze the Pudgy Penguins project with the PENGU ( BINANCE:PENGUUSDT ) token from a fundamental and technical perspective .
Please stay with me.
Why did PENGU surge nearly 40% in just 48 hours? Here’s what’s driving it:
------------------------------------
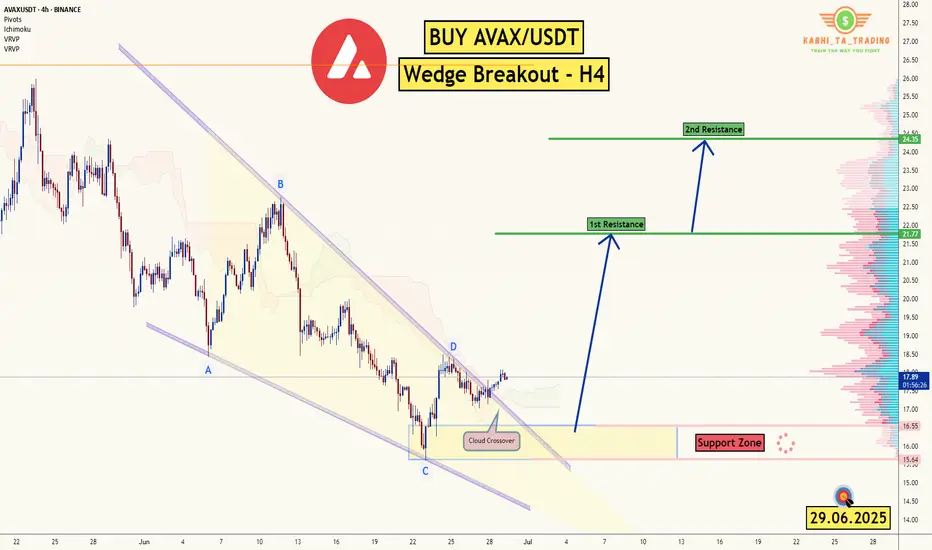
AVAX/USDT - H4 - Wedge Breakout (29.06.2025)The AVAX/USDT pair on the H4 timeframe presents a Potential Buying Opportunity due to a recent Formation of a Wedge Breakout Pattern. This suggests a shift in momentum towards the upside and a higher likelihood of further advances in the coming Days.
Possible Long Trade:
Entry: Consider Entering
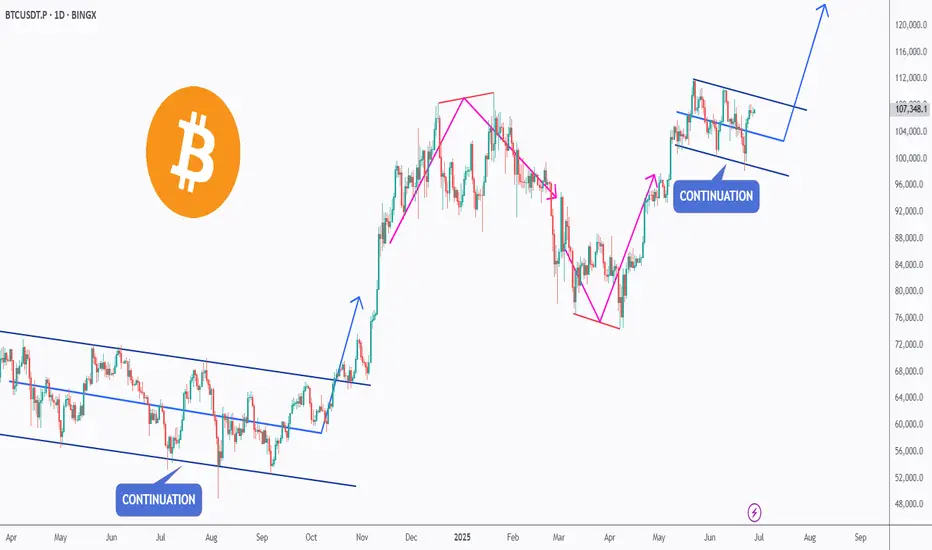
BTC - Falling Correction = Continuation?BTC has been playing by the rules lately!
Every time Bitcoin forms a falling correction, it turns out to be a bullish continuation pattern — and history might be repeating itself 👀
As shown on the chart:
Previous falling channels (flag/wedge structures) have consistently led to strong bullish imp
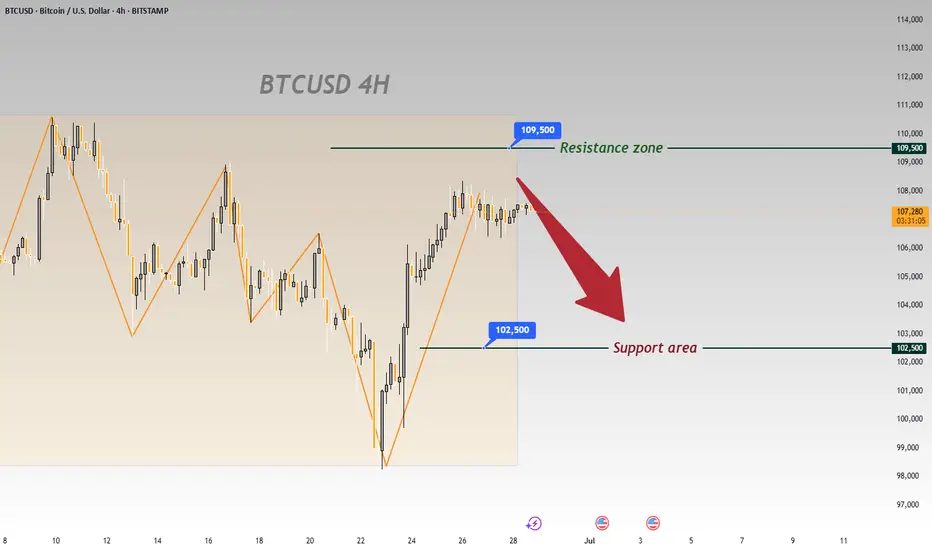
BTC Slumps Below 100000, Rebounds to Test 109500 Short Zone💎 BTC Rebounds After 100000 Drop, Eyes Short at 109500 Resistance 📊
BTC dipped below the 100000 threshold 🔻 before rebounding near 98000 🔺—a move tied to DXY weakness and easing geopolitical tensions. Now challenging the 110000 mark 🔼, it faces stiff resistance at 109500. First-time 110000 tests of
Ethereum monthly cup and handleSoooo, this is my first post, and I'm not really too sure if I'm seeing this correctly, can somebody please explain to me why I'm wrong or if I'm right. Cuzzzzz this seems extremely bullish to me.
This is on the monthly timeframe, so this projection is for closer to November - February, IMO...
A
See all crypto ideas
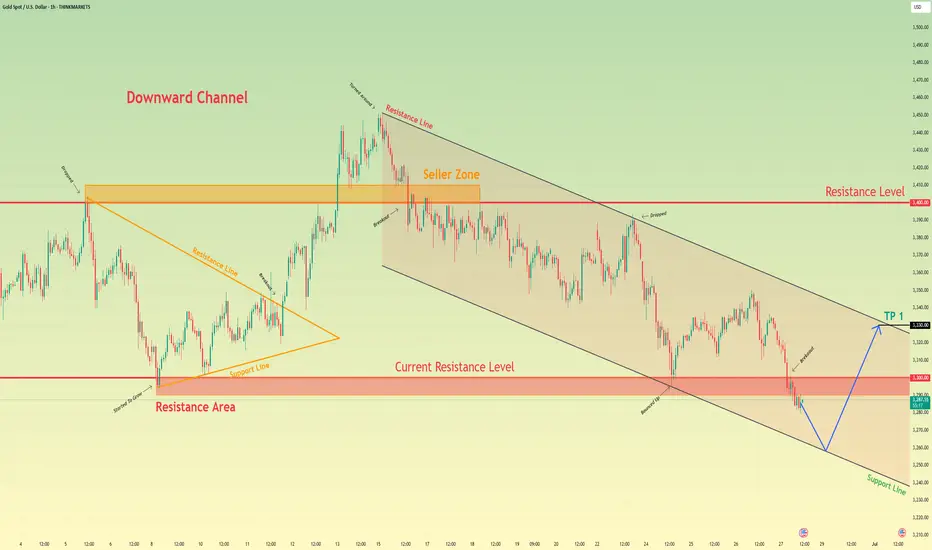
Gold may bounce up from support line of channel to 3330 pointsHello traders, I want share with you my opinion about Gold. Previously, the price broke out of a symmetrical triangle and moved confidently toward the seller zone. However, it failed to consolidate there and formed a downward channel, where price action has remained since. The movement inside this c
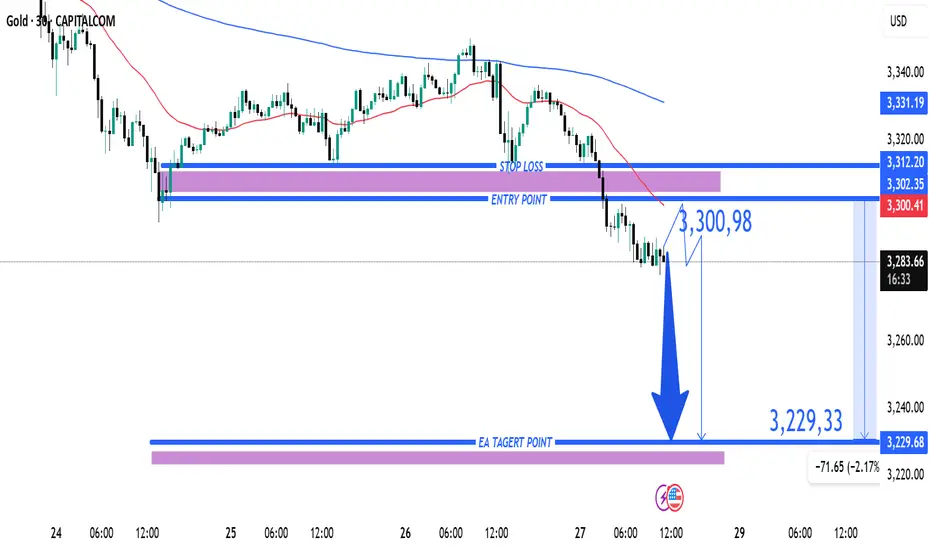
Gold (XAU/USD) Bearish Trade Setup – June 27, 2025Entry Point: Around 3,300.98 USD
Stop Loss (SL): ~3,312.20 USD
Take Profit (TP): 3,229.33 USD
Current Price: 3,286.15 USD
Risk-Reward Ratio: ~1:6.3
(Potential reward ≈ 71.65 pts; risk ≈ 11.22 pts)
Technical Breakdown:
Trend:
The price is in a short-term downtrend, supported by:
Lower highs a
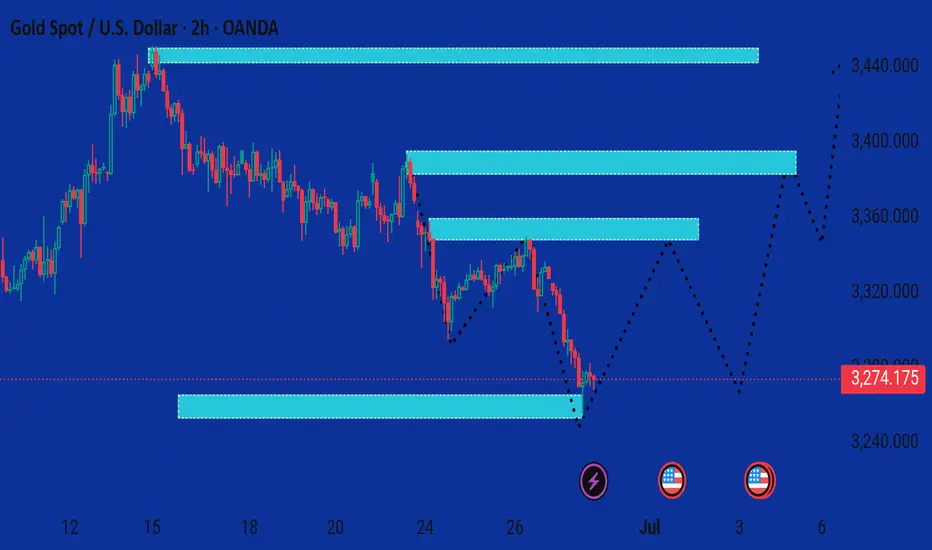
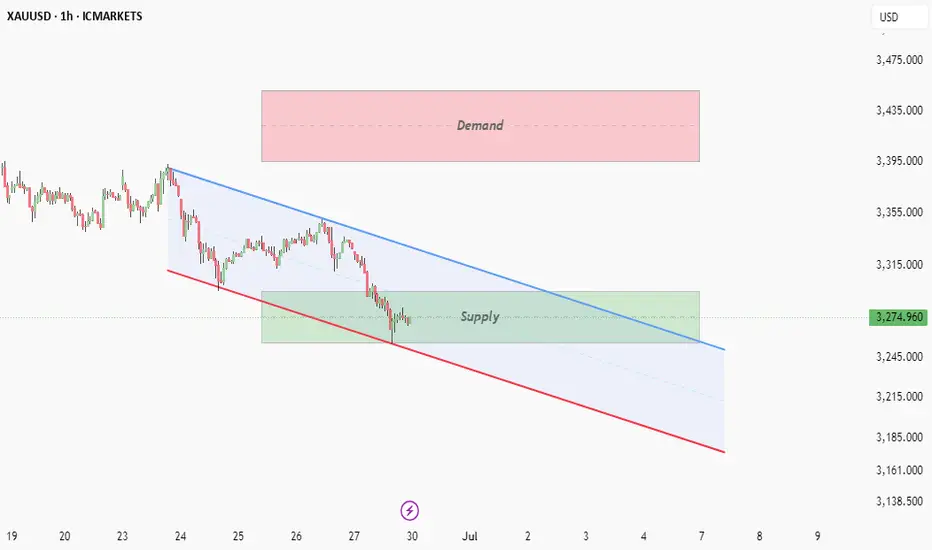
Xauusd market This chart illustrates a potential bullish reversal setup for Gold Spot (XAU/USD) on the 2-hour timeframe. Here’s a breakdown of the analysis:
---
🟦 Key Observations:
1. Current Price: $3,274.175 — down by 1.61%, indicating a recent bearish move.
2. Support Zone: Price has entered and reacted
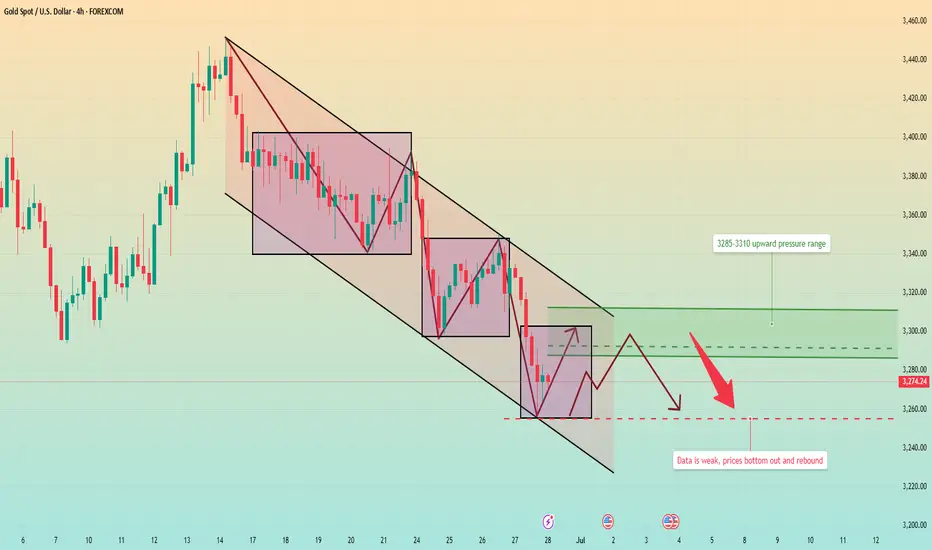
Gold has been falling continuously. Will it continue next week?Market review:
The conflict between Israel and Iran intensified, and gold surged in the early stage, and then continued to fluctuate downward. Affected by the situation in the Middle East and weak data from the United States, it fell severely in three trading days, and most of the other time period
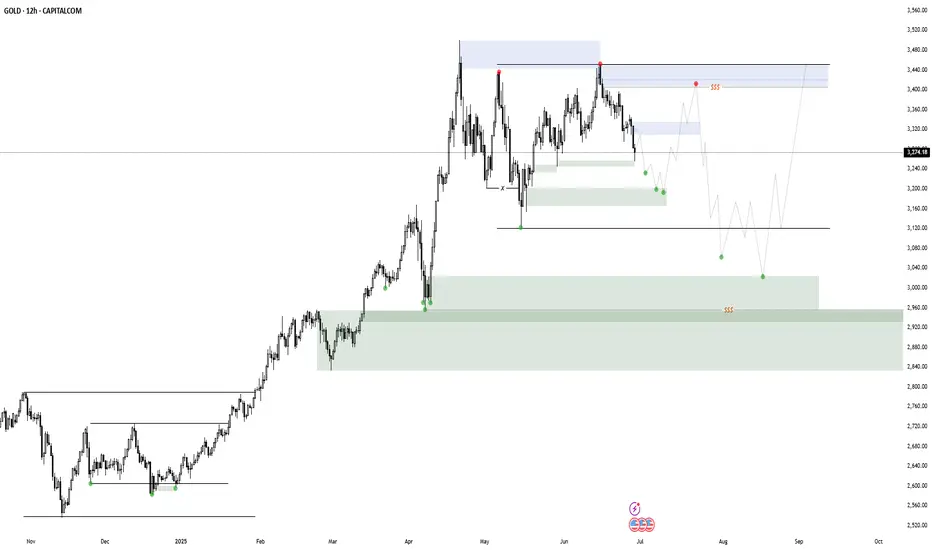
Gold RangeThis reaccumulation model for gold just popped into my head, so I wanted to post it on my profile to see how wrong I was later. My main focus right now is this potential internal distribution, which will likely take some time to confirm/invalidate. I'll take a closer look if there are more signs tha
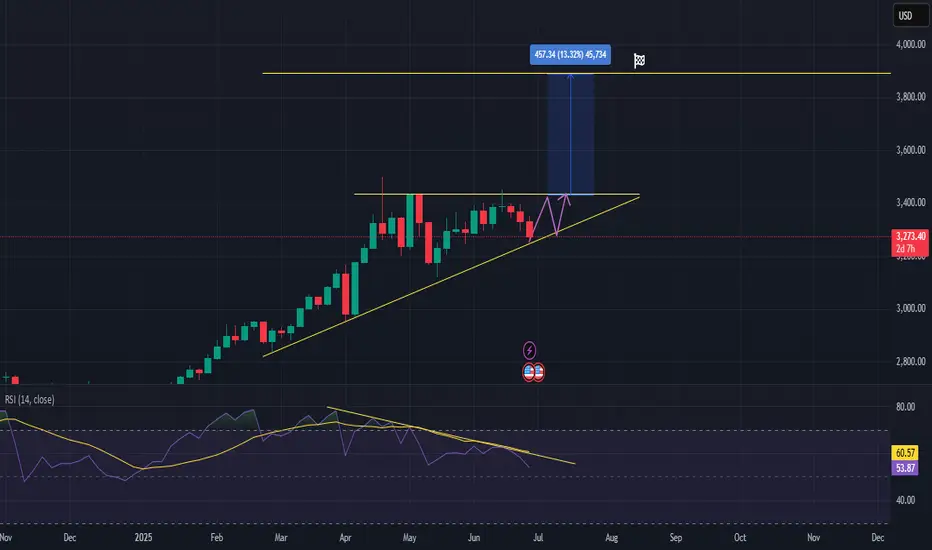
XAUUSD Forming Bullish Continuation Patternhi traders,
let's have a look at Gold on 3D time frame.
✅ Technical Outlook:
Uptrend Still Intact
Price action remains firmly within a higher high, higher low structure, confirming that Gold is still in an active uptrend.
* We can observe the Ascending Triangle Formation.
An ascending triangle h
Gold prediction
XAUUSD in a downtrend since the last week as managed to break and close bellow the the past low at 3295 level.
tested the support and seem to be respected at 3254 level.
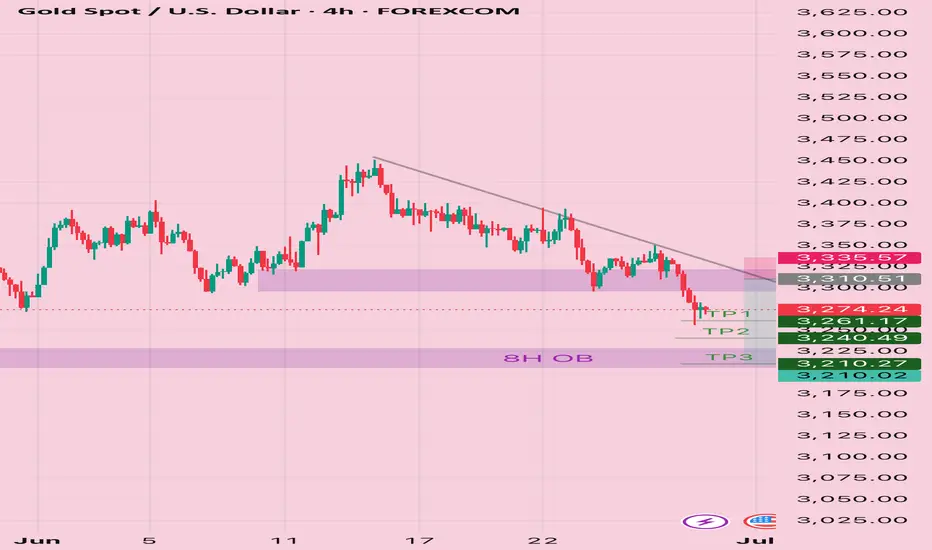
GOLD Setup- Bearish Bias!FOREXCOM:XAUUSD Price is forming a series of lower highs and lower lows on the 4‑hour timeframe, indicating a downtrend bias. Recent resistance at the 70 EMA / descending trendline is holding strong,hard to break above.
Based on recent candle pattern with long lower wicks at current price, it’s m
Overall Trajectory BullishEntering long positions on XAU/USD based on a confirmed 3-Drive pattern on the H4 timeframe, aligning with confluence from the 61.8% Fibonacci retracement zone.
As long as price stays and holds above 3200 I will remain bullish, if there is a close below 3200 then my analysis will be subject to chang
Gold in weekly and Jun Month ending analysis (Buy and forget)3250 to 3200 is key support are, look at Top trandline breakout, also take the benefit of every dip
See all futures ideas
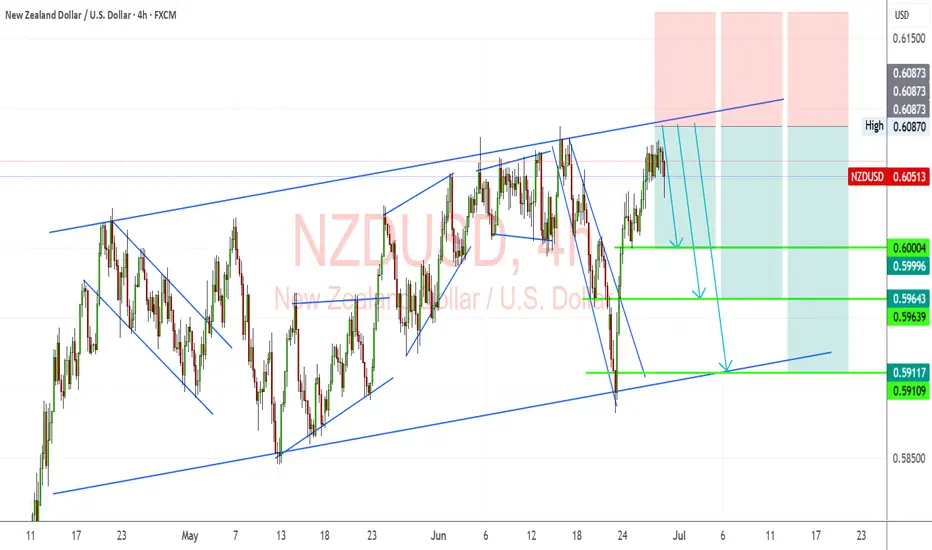
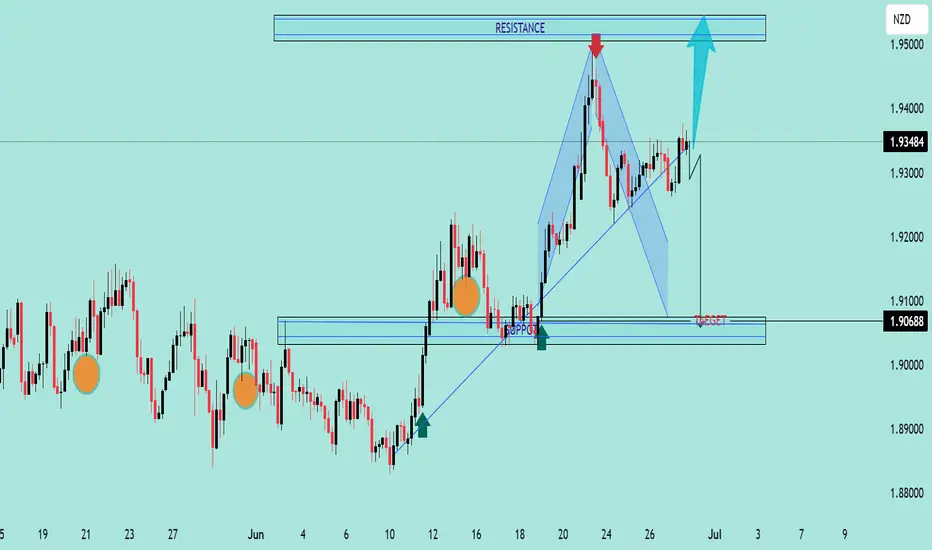
NZDUSD Hits Channel Top Bearish Momentum BuildingNZDUSD pair has touched a key resistance zone near the top of its rising channel and is showing early signs of rejection. This technical inflection point aligns with weakening New Zealand economic sentiment and renewed strength in the US dollar. The stage is set for a bearish rotation, with several
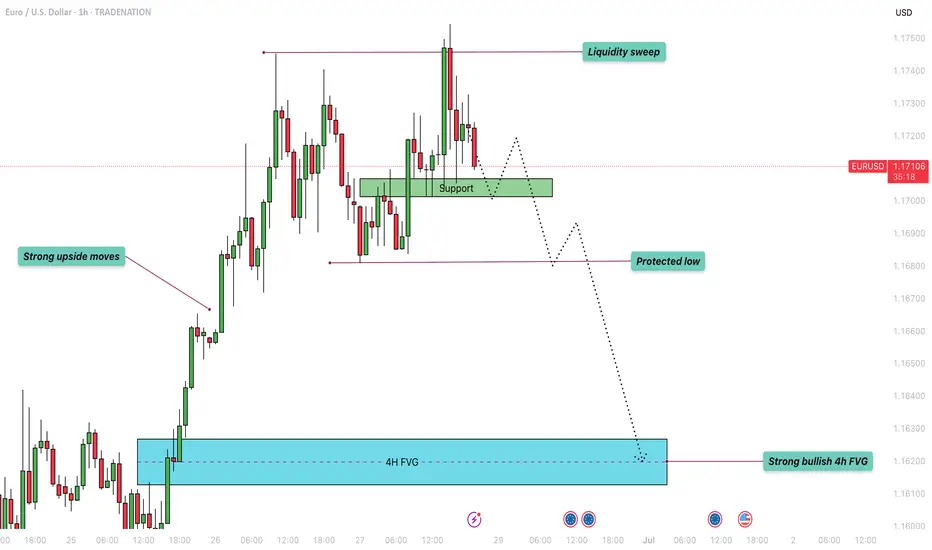
EUR/USD - Liquidity grabbed! Move towards the 4H FVG next?This chart illustrates a short-term bearish outlook on the EUR/USD currency pair, using smart money concepts like liquidity grabs, fair value gaps (FVGs), and structural levels such as support and protected lows. It is based on the 1-hour timeframe and references a higher timeframe (4H) for added co
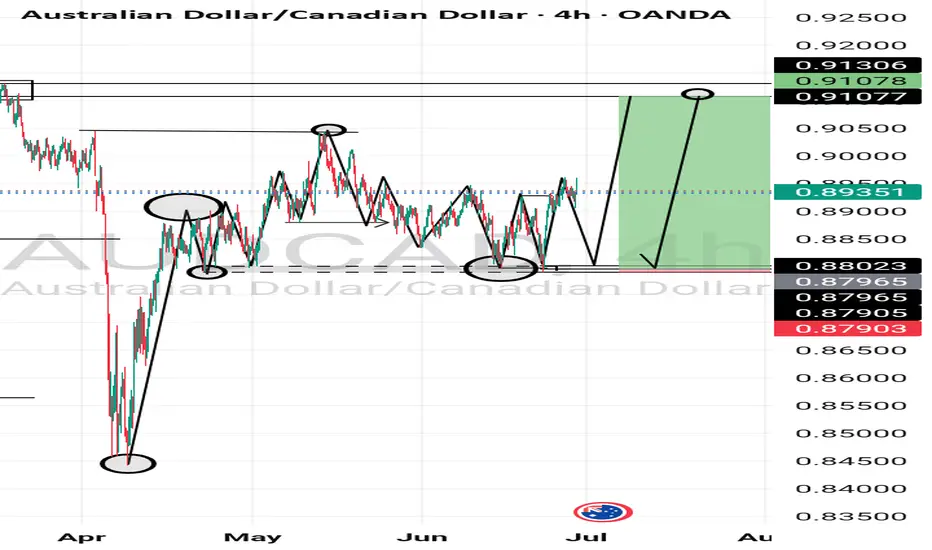
AUD/CAD IS VERY BULLISHI see a possible continuous upward movement to complete the 3rd leg / 3rd phase or whatever you wanna call. So i will see how it goes.
Happy Trading
Back tested My Support and Resistance Strategy as a Beginner – AI’ve been back testing my support and resistance strategy on the AUD/JPY currency pair as a beginner, and I’m starting to see some encouraging results. By focusing on key levels where price reacts, I’ve noticed that my win rate is currently higher than my losses.
This simple approach is helping me

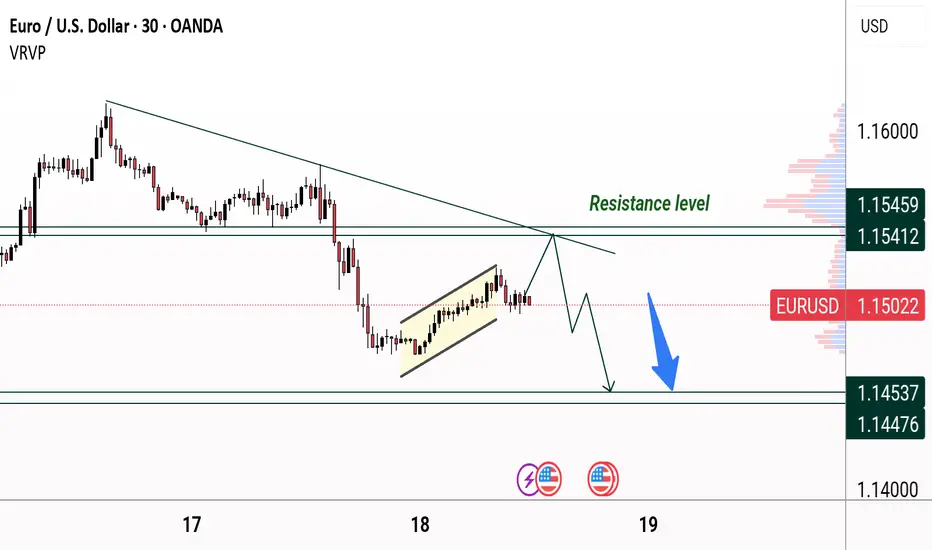
Eurusd Short-term bearish EUR/USD is showing bearish momentum, breaking below key support with lower highs forming. Selling pressure is increasing amid a stronger USD outlook, favoring a short position.
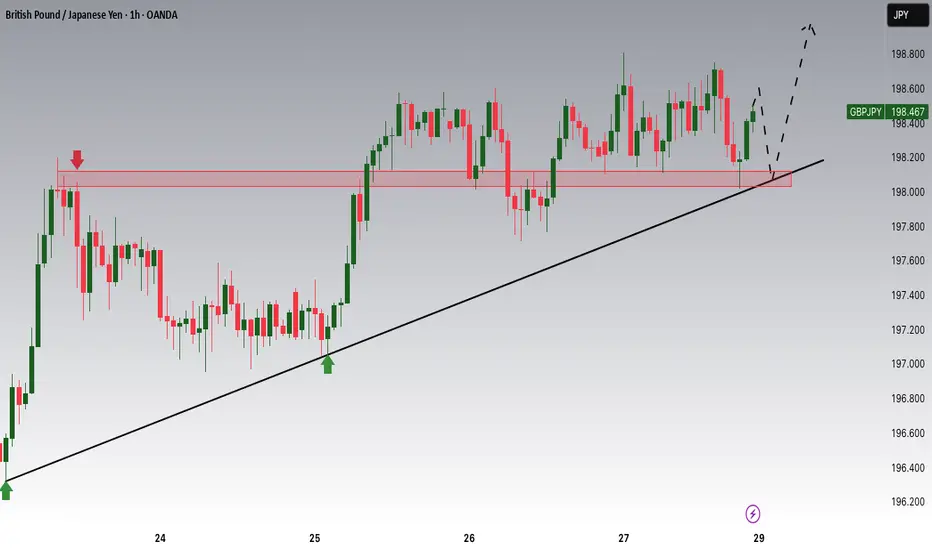
GBPJPY Potential UpsidesHey Traders, in the coming week we are monitoring GBPJPY for a buying opportunity around 198.100 zone, GBPJPY is trading in an uptrend and currently is in a correction phase in which it is approaching the trend at 198.100 support and resistance area.
Trade safe, Joe.
EURNZD Potential Breakout or Reversal? | Technical Analysis EURNZD Potential Breakout or Reversal? | Technical Analysis 🚀🔄
The chart illustrates a key technical setup on the EURNZD pair with both bullish and bearish possibilities depending on price action near critical zones.
🔍 Technical Highlights:
Bearish Harmonic Pattern Completed 📉
A harmonic structur
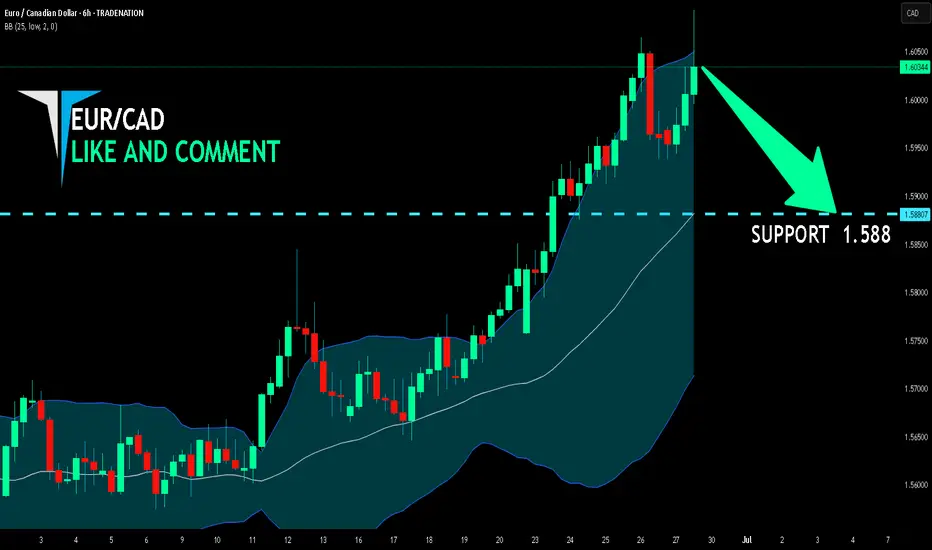
EUR/CAD BEARS ARE STRONG HERE|SHORT
Hello, Friends!
We are now examining the EUR/CAD pair and we can see that the pair is going up locally while also being in a uptrend on the 1W TF. But there is also a powerful signal from the BB upper band being nearby, indicating that the pair is overbought so we can go short from the resistanc
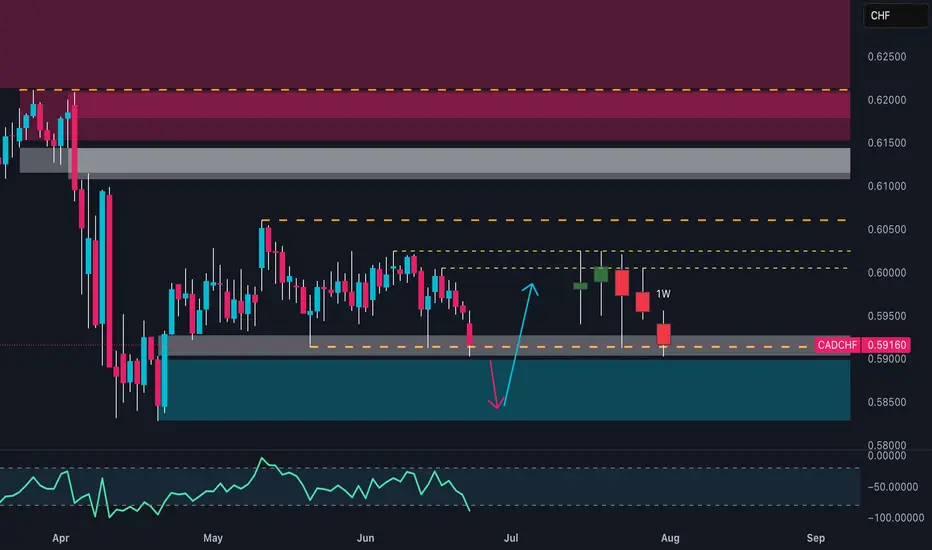
CADCHF at the Cliff's Edge – Is a Breakdown Imminent? 🧭 Technical Context
Price is currently sitting at the key support area of 0.5890–0.5900, tested multiple times since April.
This week’s candlestick shows a clear close below the intermediate micro-structure (two consecutive closes under recent lows), confirming bearish pressure.
The weekly RSI remai
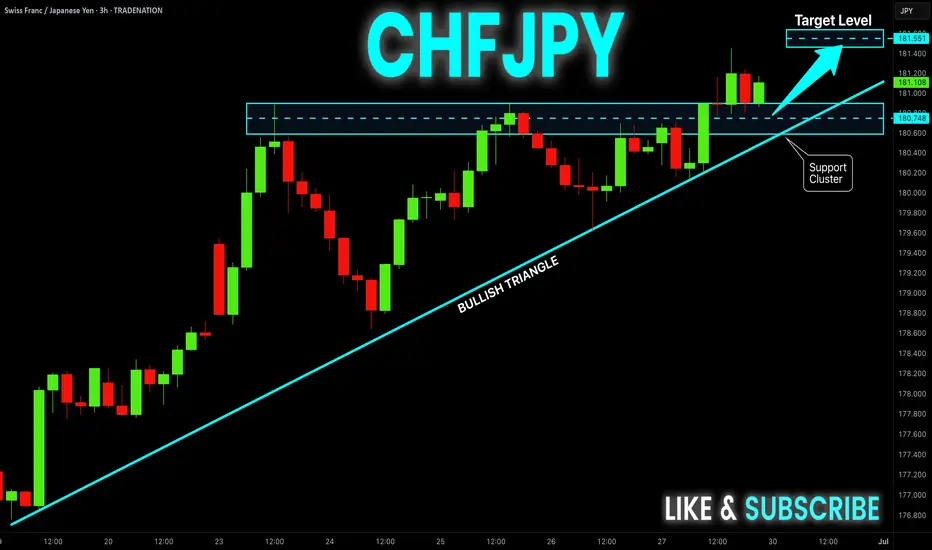
CHF-JPY Local Long! Buy!
Hello,Traders!
CHF-JPY is trading in a strong
Uptrend and the pair made a
Bullish breakout from the bullish
Triangle pattern and is now seems
To be consolidating above the
Support cluster around 180.740
So we are bullish biased and
We will be expecting a further
Bullish move up on Monday
Buy!
C
See all forex ideas
| - | - | - | - | - | - | - | ||
| - | - | - | - | - | - | - | ||
| - | - | - | - | - | - | - | ||
| - | - | - | - | - | - | - | ||
| - | - | - | - | - | - | - | ||
| - | - | - | - | - | - | - | ||
| - | - | - | - | - | - | - | ||
| - | - | - | - | - | - | - |
Trade directly on the supercharts through our supported, fully-verified and user-reviewed brokers.


