Aptos Bullish, Altcoins BullishThe best is yet to come. Do not despair my dear friend, patience is key.
Aptos is breaking bullish right now after a final low with the highest volume since February. This confirms the latest double-bottom as the market bottom.
The high bullish momentum developing on today's candle, full green, co
APT around a historical support DO or DIEAPT / USDT
Price dropped hard to retest the massive historical support again
This multi years support ( 3$-4$) zone always shows great buying pressures thats why it catch our attention!
This support also can play as DO or DIE borderline between bulls and bears
The buyers must defend this area o
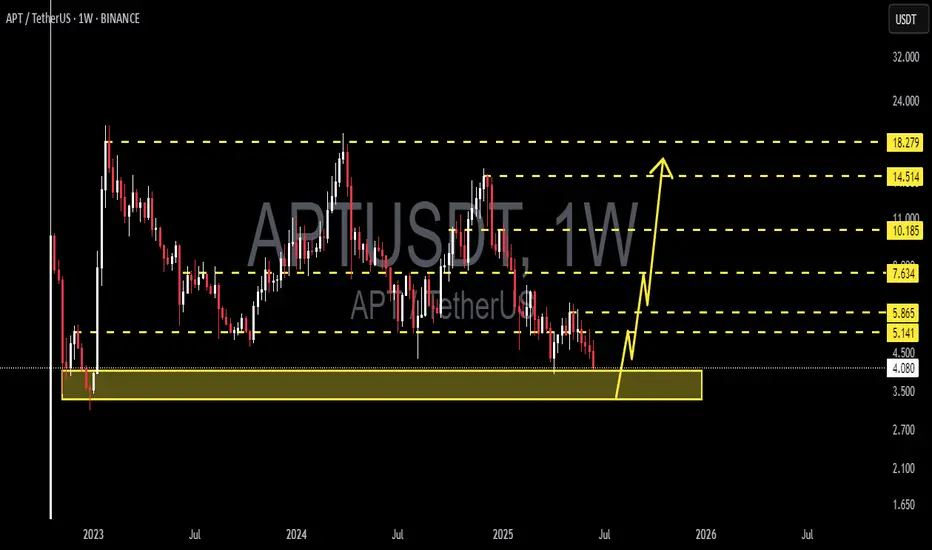
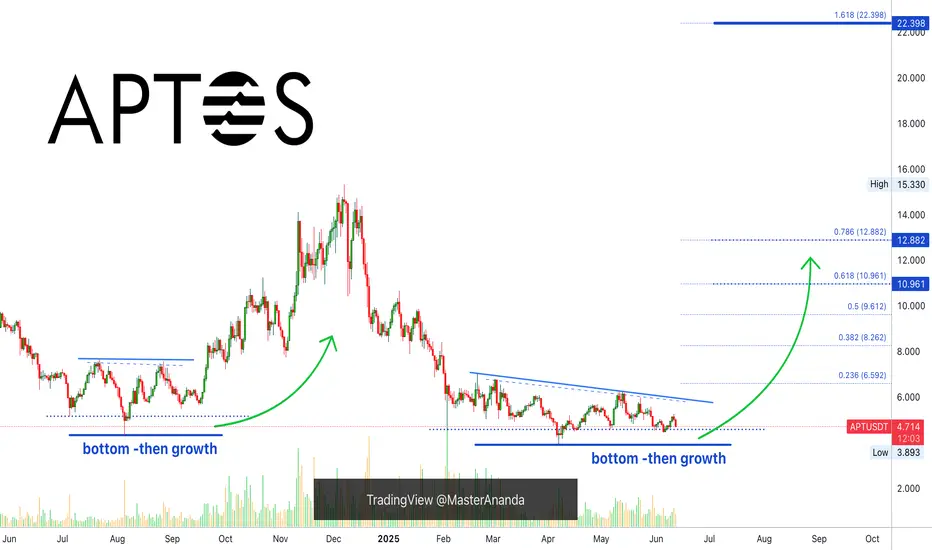
Aptos IdeaThe whole aptos chart is composed of corrective patterns and I do think we are now at the end of wave a and it might be a running flat where wave b is explosive towards upside exceeding start of wave a i have marked the level where we might end the wave b @ 1.618 targeting ATH around 22$ the wave B

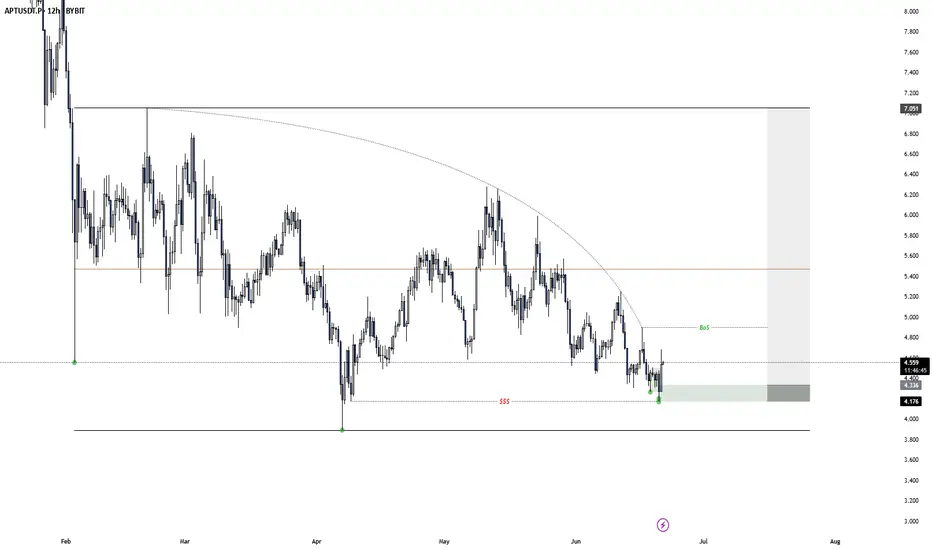
APT Accumulation pt.2After APT yesterday finally grabbed the extreme liquidity while creating a model 2 inside a model 2, i will now look for a valid entry, after missing the perfect one on the BOS down in the smaller model 2, up to the technical target. (A BOS above 4.9$ would be nice for more confirmation)
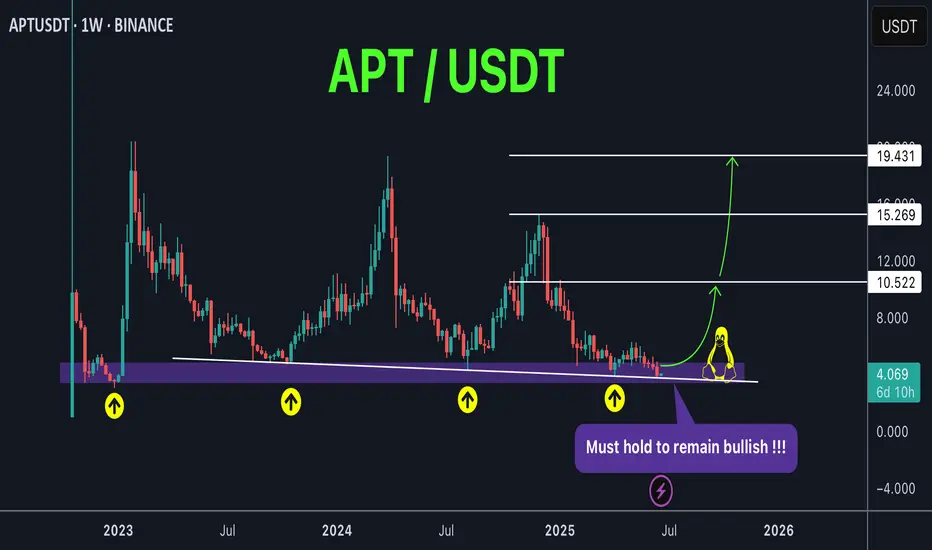
APTUSDT 1W AnalysisAPT ~ 1W Analysis
#APT If you still have faith in this coin. This support can be considered to start buying back with a short-term target of at least 15%++
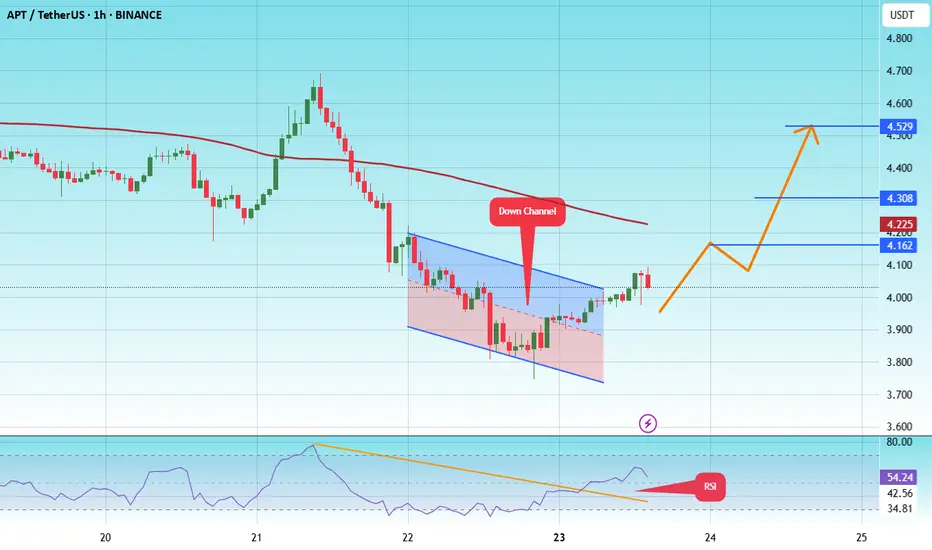
#APT/USDT#APT
The price is moving within a descending channel on the 1-hour frame and is expected to break and continue upward.
We have a trend to stabilize above the 100 moving average once again.
We have a downtrend on the RSI indicator that supports the upward move with a breakout.
We have a support a
Aptos (APT): Buyers Need To Establish Support ZoneAPT is near a local support area where we will be looking now for some sort of upward bounce from here. We might see a smaller move to lower zones (towards the liquidity line below).
Now, as long as we are between those zones, we wait but overall, what we want to see is break of structure and prop

Aptos, Good & Bad (Leveraged Trading vs Spot)This is both good and bad at the same time.
The bad part, or rather sad part, is the fact that there hasn't been any decent bullish action recently. This pair did not grow by any significant amount after its 7-April low.
Ok, what about the good part?
The good part is that prices are low. This pai
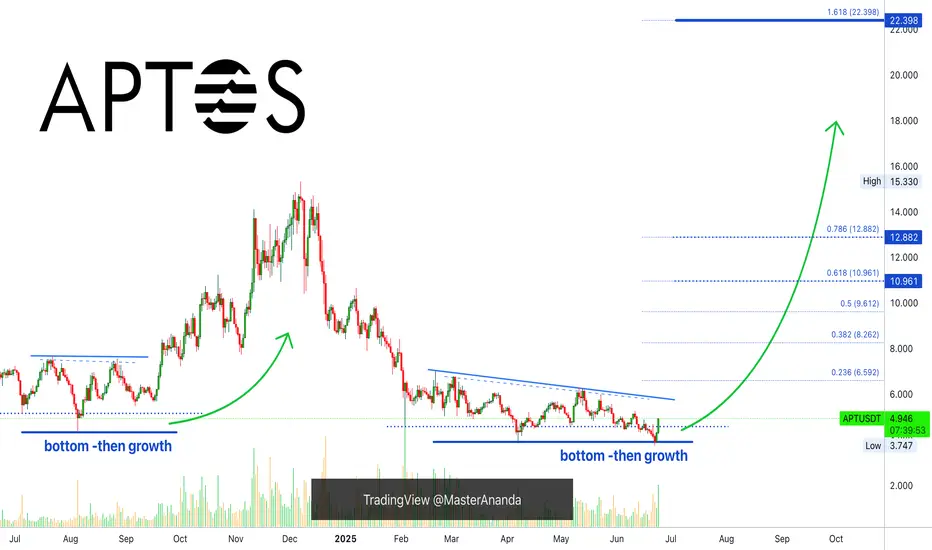
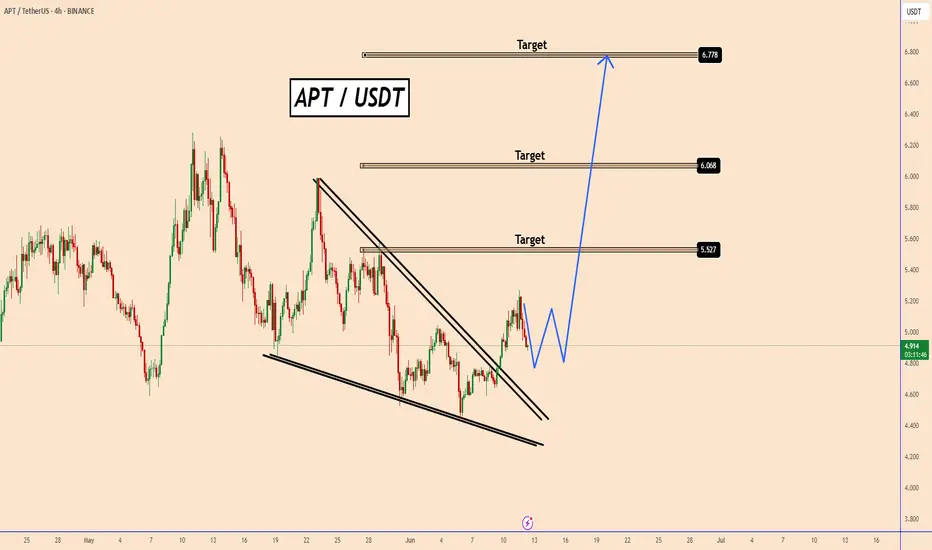
APT/USDT: Bullish Technical OutlookAPT/USDT: Bullish Technical Outlook
APT has completed a broader and well-defined bullish pattern, suggesting an upward trajectory in the coming days and possibly weeks. The continuation of this move will largely depend on market volume.
Under normal conditions, I'm anticipating a price move towar
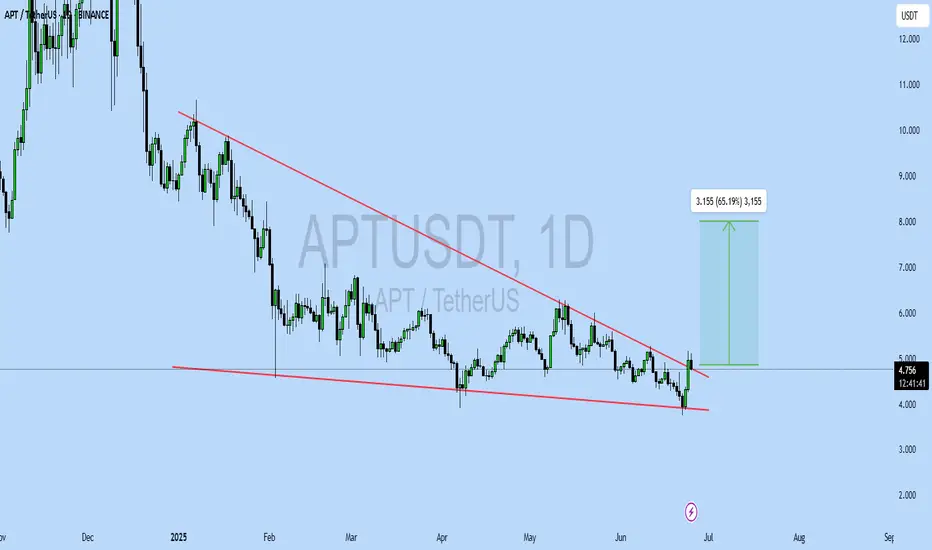
APTUSDT UPDATE
Pattern: Falling Wedge Breakout
Current Price: \$4.755
Target Price: \$8.00
Target % Gain: 65.19%
Technical Analysis: APT has broken out of a falling wedge pattern on the 1D chart, showing bullish momentum. Breakout is confirmed with a strong green candle and minor volume uptick. Close above resi
See all ideas
Summarizing what the indicators are suggesting.
Oscillators
Neutral
SellBuy
Strong sellStrong buy
Strong sellSellNeutralBuyStrong buy
Oscillators
Neutral
SellBuy
Strong sellStrong buy
Strong sellSellNeutralBuyStrong buy
Summary
Neutral
SellBuy
Strong sellStrong buy
Strong sellSellNeutralBuyStrong buy
Summary
Neutral
SellBuy
Strong sellStrong buy
Strong sellSellNeutralBuyStrong buy
Summary
Neutral
SellBuy
Strong sellStrong buy
Strong sellSellNeutralBuyStrong buy
Moving Averages
Neutral
SellBuy
Strong sellStrong buy
Strong sellSellNeutralBuyStrong buy
Moving Averages
Neutral
SellBuy
Strong sellStrong buy
Strong sellSellNeutralBuyStrong buy
Displays a symbol's price movements over previous years to identify recurring trends.