Aptos Bullish, Altcoins BullishThe best is yet to come. Do not despair my dear friend, patience is key.
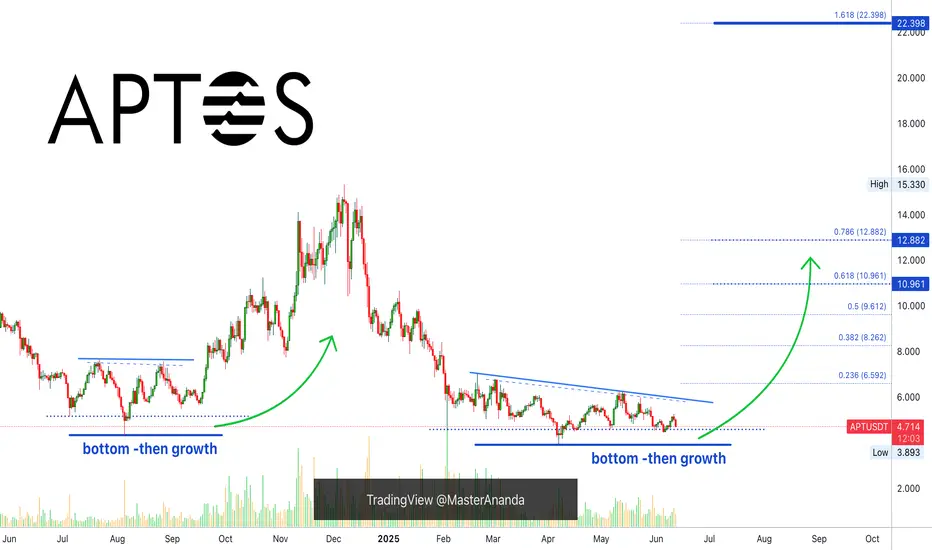
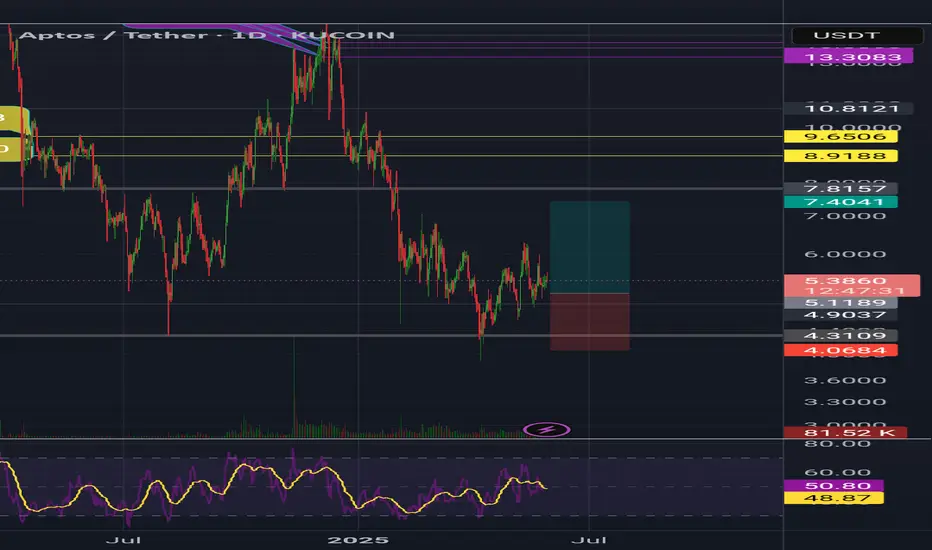
Aptos is breaking bullish right now after a final low with the highest volume since February. This confirms the latest double-bottom as the market bottom.
The high bullish momentum developing on today's candle, full green, coupled with the fact that a major flush is present on the chart reveals really good news. Today, things might seen down and quiet; everything can change in a day.
The bullish wave is on, it is starting now and it will be strong. Bottom prices will be gone within hours but we will experience long-term growth. Keep in mind that 100%-200% can happen within a matter of days. This is because the market is set to grow in excess of 1,000-2,000%, so the first jump is very strong but only signals the start. Getting bottom prices can be life changing.
This is a friendly reminder; the best is yet to come.
Aptos bullish means the altcoins are bullish.
The altcoins going bullish means that Bitcoin will soon resume with new all-time highs and additional growth.
Trust crypto, trust the market, trust your plan. You will be rewarded long-term.
The time to buy is now. Profits are on their way. To you!
Namaste.
APTUSDT.P trade ideas
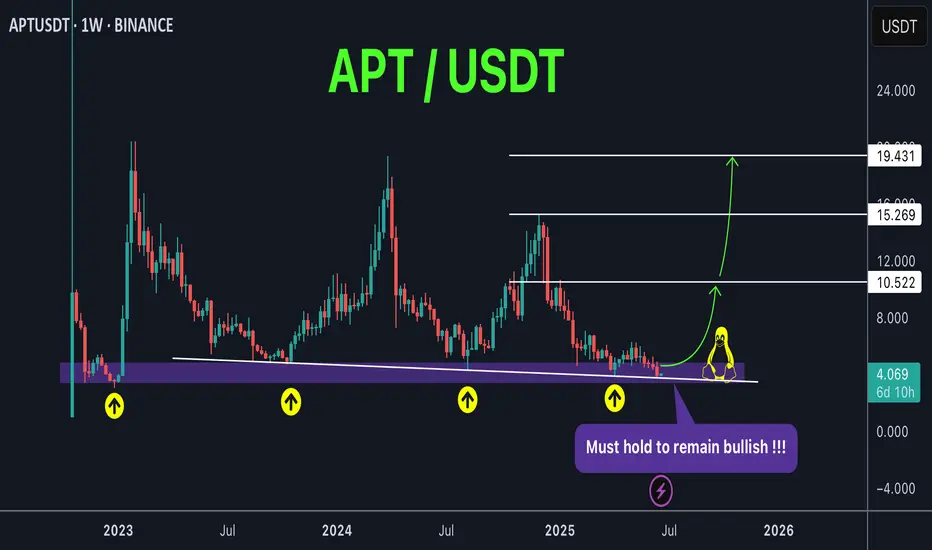
APT around a historical support DO or DIEAPT / USDT
Price dropped hard to retest the massive historical support again
This multi years support ( 3$-4$) zone always shows great buying pressures thats why it catch our attention!
This support also can play as DO or DIE borderline between bulls and bears
The buyers must defend this area otherwise it will die and make new lows
Keep an eye on it
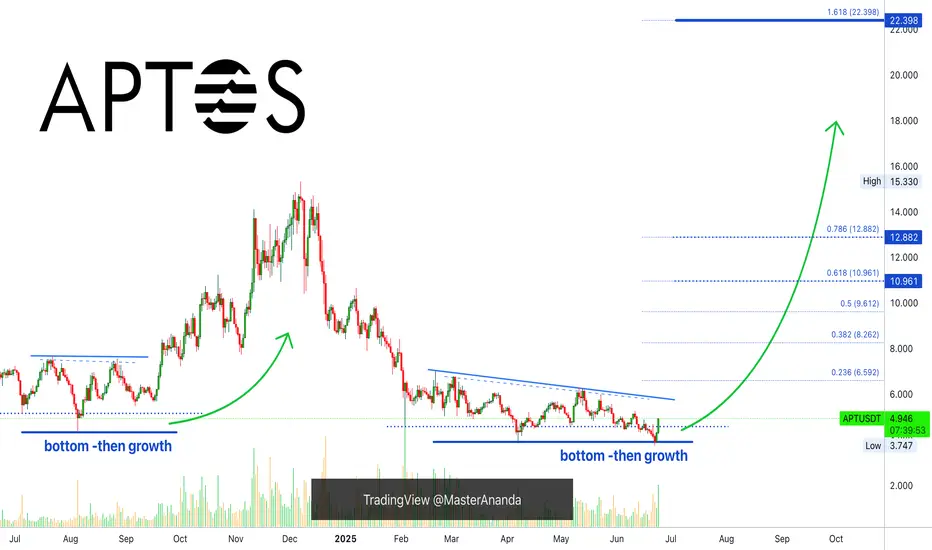
Aptos IdeaThe whole aptos chart is composed of corrective patterns and I do think we are now at the end of wave a and it might be a running flat where wave b is explosive towards upside exceeding start of wave a i have marked the level where we might end the wave b @ 1.618 targeting ATH around 22$ the wave B tends to be very fast so be positioned before
tp ATH Sl can be the 3.89$ very good setup 23RR

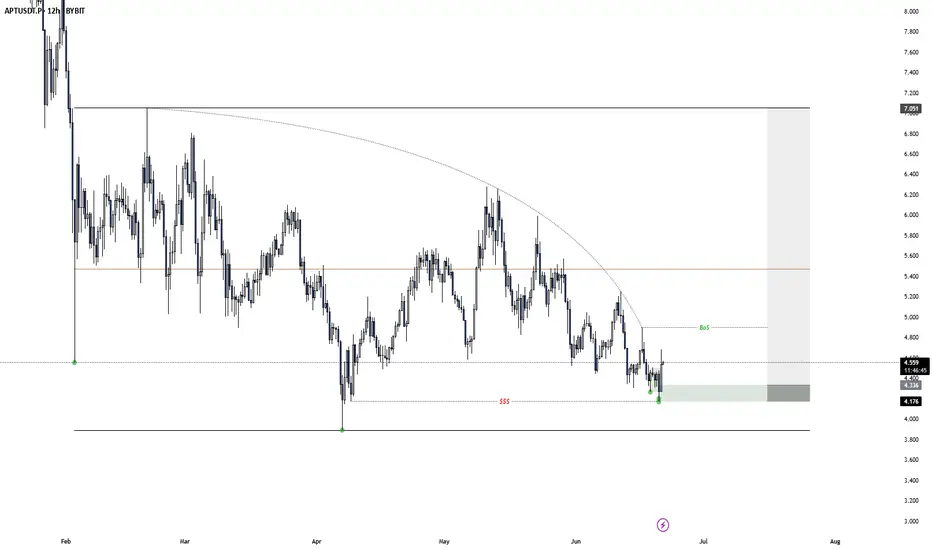
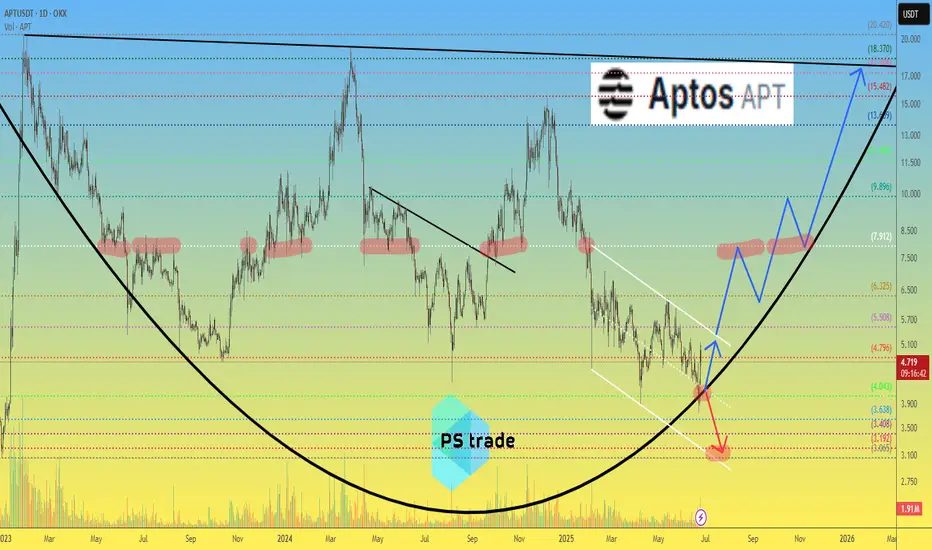
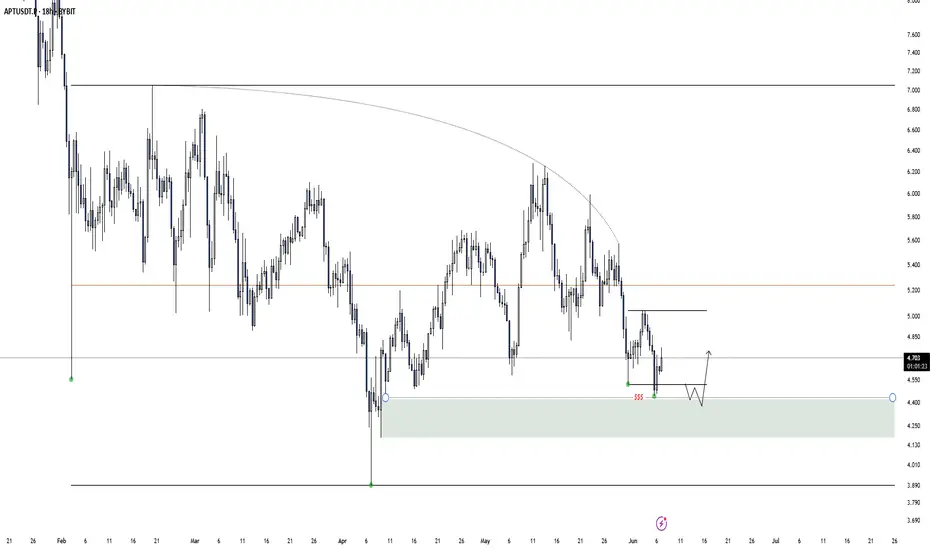
APT Accumulation pt.2After APT yesterday finally grabbed the extreme liquidity while creating a model 2 inside a model 2, i will now look for a valid entry, after missing the perfect one on the BOS down in the smaller model 2, up to the technical target. (A BOS above 4.9$ would be nice for more confirmation)
APTUSDT 1W AnalysisAPT ~ 1W Analysis
#APT If you still have faith in this coin. This support can be considered to start buying back with a short-term target of at least 15%++
#APT/USDT#APT
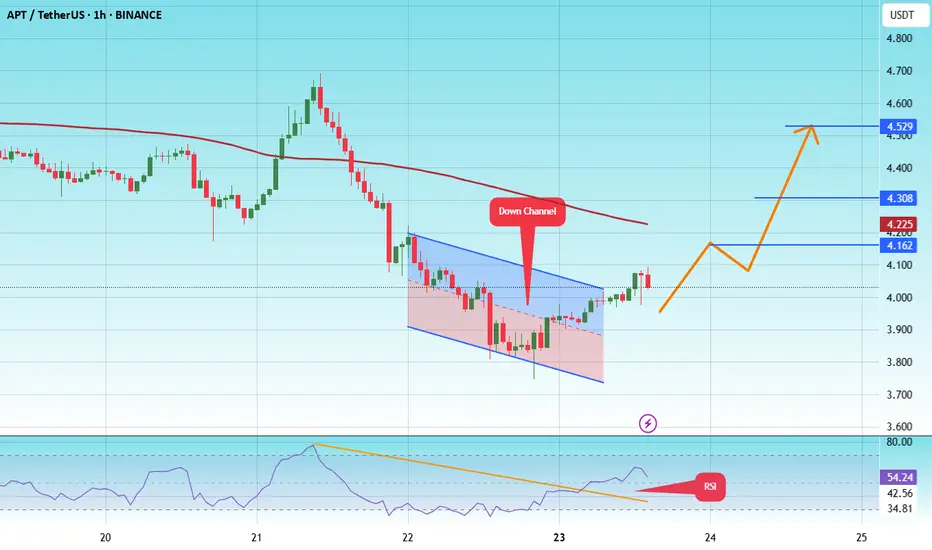
The price is moving within a descending channel on the 1-hour frame and is expected to break and continue upward.
We have a trend to stabilize above the 100 moving average once again.
We have a downtrend on the RSI indicator that supports the upward move with a breakout.
We have a support area at the lower boundary of the channel at 3.81, acting as strong support from which the price can rebound.
Entry price: 4.03
First target: 4.16
Second target: 4.30
Third target: 4.59
Aptos (APT): Buyers Need To Establish Support ZoneAPT is near a local support area where we will be looking now for some sort of upward bounce from here. We might see a smaller move to lower zones (towards the liquidity line below).
Now, as long as we are between those zones, we wait but overall, what we want to see is break of structure and proper upward movement towards 100 EMA.
Swallow Academy

Aptos APT price analysis💰 We will soon find out whether the price of #APT has finally begun to recover, or whether this is just a rebound before a further decline.
📈 For growth to continue, it is important that buyers manage to keep the price of OKX:APTUSDT above $4
◆ Next, the price will exit the falling channel and move towards the strong mirror level of $8
◆ And only after the #APTOS price consolidates above this level will it be possible to talk about an ambitious uptrend.
🐻 Well, the negative scenario is a lackluster fall from $4 to $3, or maybe even lower...
_____________________
Did you like our analysis? Leave a comment, like, and follow to get more
Aptos, Good & Bad (Leveraged Trading vs Spot)This is both good and bad at the same time.
The bad part, or rather sad part, is the fact that there hasn't been any decent bullish action recently. This pair did not grow by any significant amount after its 7-April low.
Ok, what about the good part?
The good part is that prices are low. This pair is "yet to move."
Low prices means a great buy opportunity for what we know comes next.
I know, I know... You might not believe me or your morale might be done but we already had a preview with many pairs growing between 100 and 300%. In less than two months. That's the preview. But the market is big and not the entire market can advance in a single wave. That's why I keep on harping "choose wisely," because sometimes we can end up with the pairs that are not moving in the current wave. They will move, trust, but some will move now and others later down the road.
Ok, good and bad.
The bad part is not that bad but it can be said that it is bad that prices are low. But this is actually good. If prices were high, there would be no buying opportunity, we would have to ignore, dismiss this pair. Since prices are trading low-near support, we can accumulate; buy and hold focused on the long-term.
I mentioned tons of times leveraged trading but all these chart setup can be traded spot. In fact, any setup that is good for leverage is even better for spot because the risk is none.
With spot trading we simply hold. What's the problem? You expected 1,000% growth in 2 months? If that's the case, it simply takes longer and we wait. See? No loss, the worst case scenario is a long-term wait. That's spot trading, buy and hold and you will win in the end.
Leveraged trading is more complex but you know, risk vs reward. You put on lots of risk, huge risk but wow, the rewards potential is awesome. We only approach this tool when we learn the market, when we know what we are doing and we have no need for money; only when money is already plentiful and available.
If you have a need to earn now, "make money fast," and so on; avoid leveraged trading at all costs because it is very likely that you will lose everything rather than achieve success. But, on the other hand, if you are living the good life, you communicate with your wife and you have heart, you are grateful for the food you eat, for the simple stuff, for your house, your friends, your bed; then you can use leveraged trading. Because you will be able to know when to close a position and say "thank you!" rather than double-down on a losing trade.
In short, we need a stable life and mind to use this tool with any success. If our lives and minds are not stable, it is better to start slow. If you cannot make money slow, you will not be able to make money fast. If you cannot appreciate $100, you won't be able to accept $1,000 for a single trade.
So, thanks a lot for your continued support.
I hope you are enjoying the content. It is always my pleasure to write for you, day after day after day.
Remember, it is not about getting it right or getting it wrong, it is all about a mental, emotional and spiritual connection. I am sharing what I learn just so that you can avoid the pain of a major loss, something that I know just too well because I've been there before. I've lost everything countless times and yet, I continue to fight, prosper and grow.
Namaste.
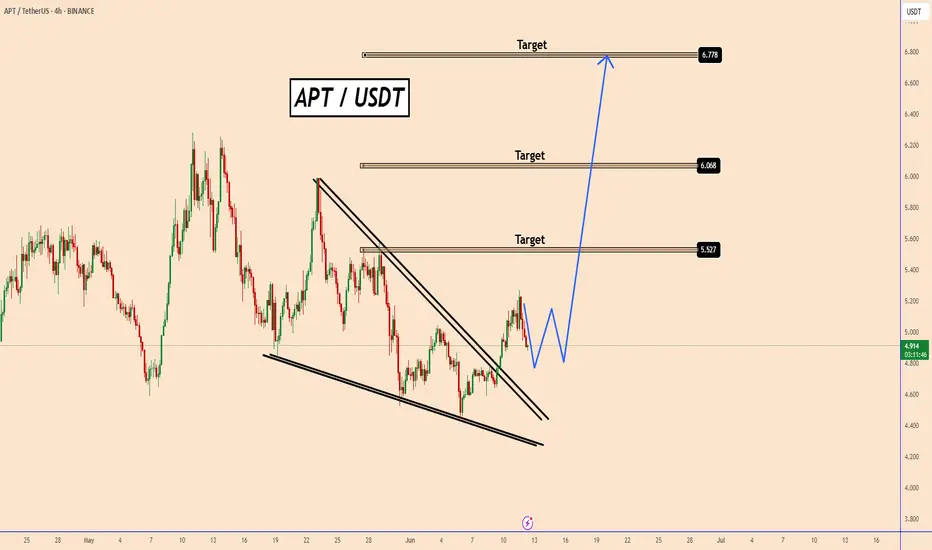
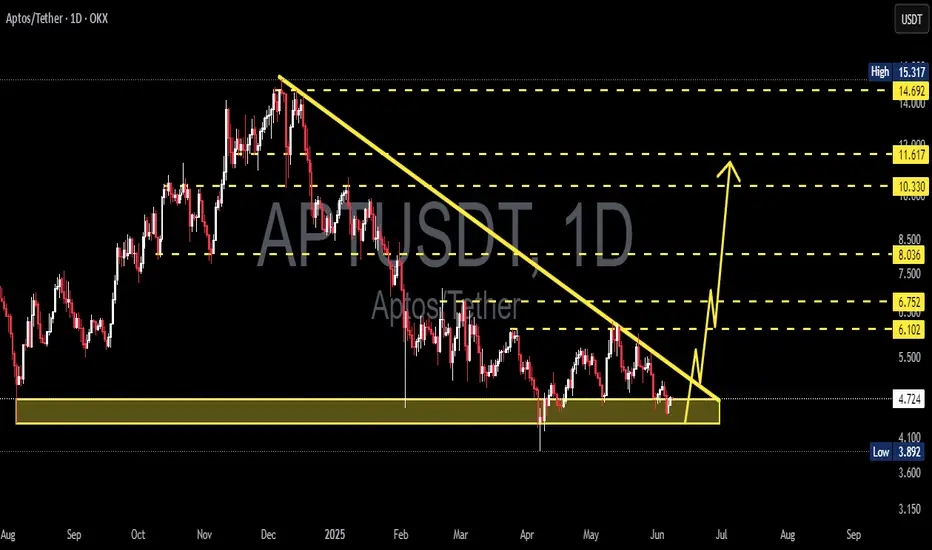
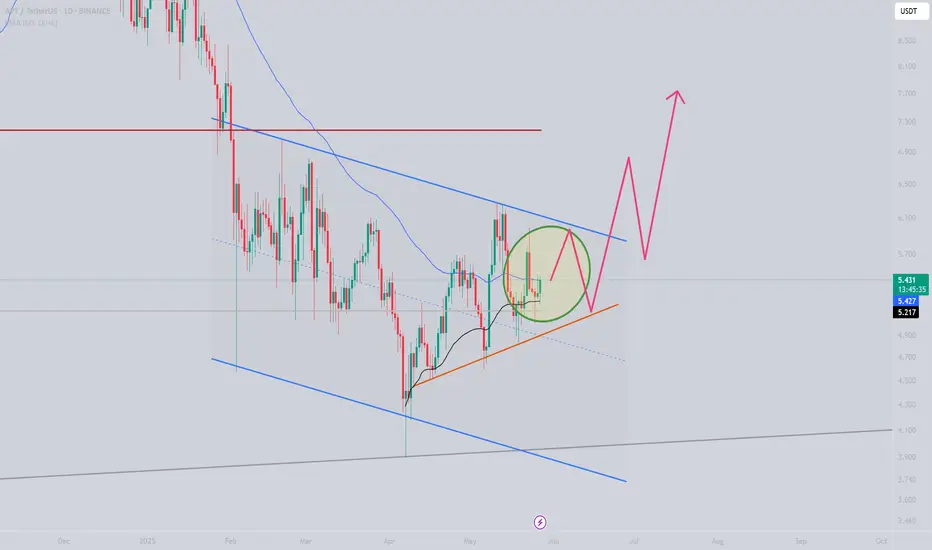
APT/USDT: Bullish Technical OutlookAPT/USDT: Bullish Technical Outlook
APT has completed a broader and well-defined bullish pattern, suggesting an upward trajectory in the coming days and possibly weeks. The continuation of this move will largely depend on market volume.
Under normal conditions, I'm anticipating a price move toward the $5.50–$6.00 range. If momentum remains strong and sentiment aligns, an extended push toward $6.80 could also be in play.
However, the current geopolitical tensions in the Middle East—particularly involving Trump—introduce an element of uncertainty. It remains unclear how these developments might ripple through the crypto market, but such instability could influence sentiment and short-term volatility.
You may find more details in the chart!
Thank you and Good Luck!
❤️PS: Please support with a like or comment if you find this analysis useful for your trading day❤️
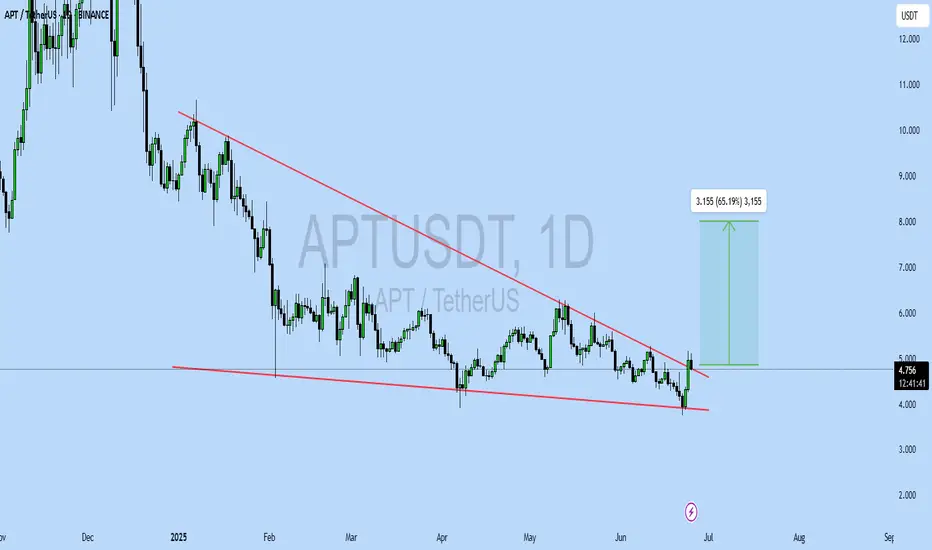
APTUSDT UPDATE
Pattern: Falling Wedge Breakout
Current Price: \$4.755
Target Price: \$8.00
Target % Gain: 65.19%
Technical Analysis: APT has broken out of a falling wedge pattern on the 1D chart, showing bullish momentum. Breakout is confirmed with a strong green candle and minor volume uptick. Close above resistance line indicates potential upside.
Time Frame: 1D
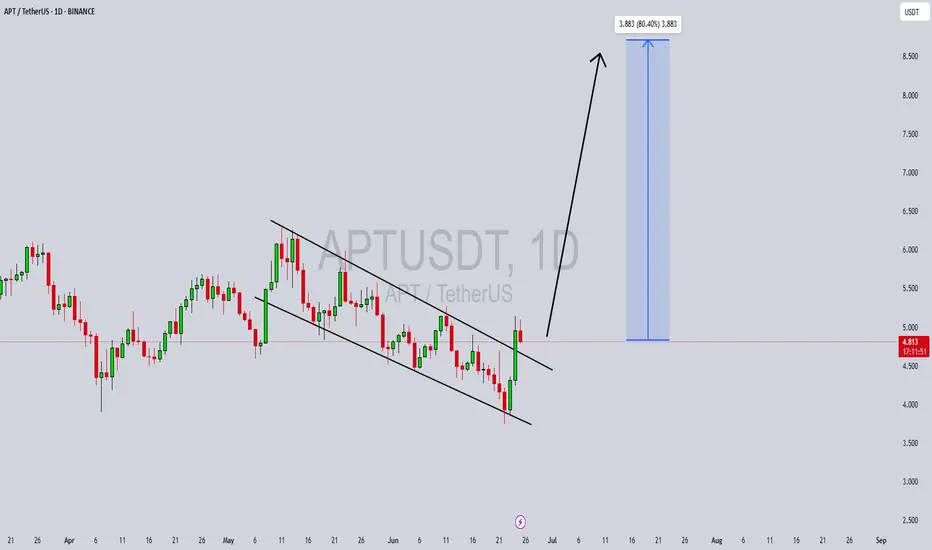
APTUSDT Forming Bullish Falling ChannelAPTUSDT is currently forming a bullish falling channel breakout, which is a classic reversal pattern indicating that the downtrend may be ending. The price action shows clear signs of compression within a downward-sloping channel, with the recent breakout suggesting a strong shift in momentum from bearish to bullish. With volume confirmation accompanying the breakout, this could signal the beginning of a powerful upside rally.
The breakout target projects a potential gain of 70% to 80%+, based on the measured move from the channel’s width. Such bullish setups are especially powerful when paired with increasing investor interest, which APT is currently experiencing. The broader crypto market sentiment is also tilting bullish, giving additional fuel to this breakout scenario. Traders and investors alike are watching APT closely as it reclaims key resistance zones and sets up for potential continuation moves.
Technical indicators such as RSI and MACD are aligning with the breakout, suggesting further strength could be ahead. The price structure also shows reduced selling pressure and more aggressive buying on dips, which supports the thesis of a medium-term rally. If APTUSDT continues to close daily candles above the channel resistance, a sustained rally to the $8–9 zone could be achievable in the coming weeks.
APT is also gaining traction within the crypto community and DeFi space, helping reinforce its long-term potential. With solid technicals and growing market engagement, APTUSDT is one of the stronger altcoin setups currently available for traders seeking breakout opportunities.
✅ Show your support by hitting the like button and
✅ Leaving a comment below! (What is You opinion about this Coin)
Your feedback and engagement keep me inspired to share more insightful market analysis with you!
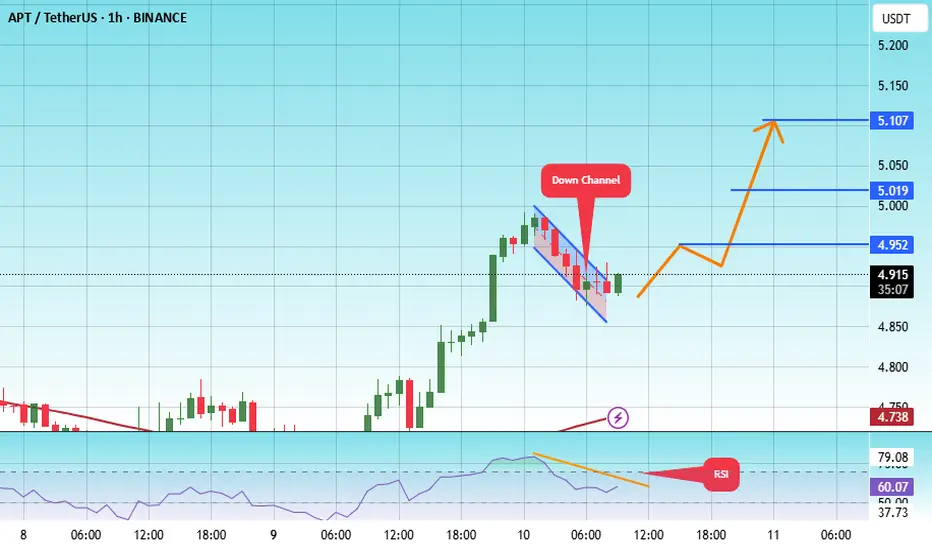
#APT/USDT#APT
The price is moving within a descending channel on the 1-hour frame, adhering well to it, and is heading towards a strong breakout and retest.
We are experiencing a rebound from the lower boundary of the descending channel, which is support at 4.87.
We are experiencing a downtrend on the RSI indicator that is about to be broken and retested, supporting the upward trend.
We are heading towards stability above the 100 Moving Average.
Entry price: 4.92
First target: 4.95
Second target: 5.02
Third target: 5.10
APTUSDT 1D AnalysisAPT ~ 1D Analysis
#APT Buy back gradually from here if you still have confidence in this coin with a short term target of at least 15%+ and a long term target of $15
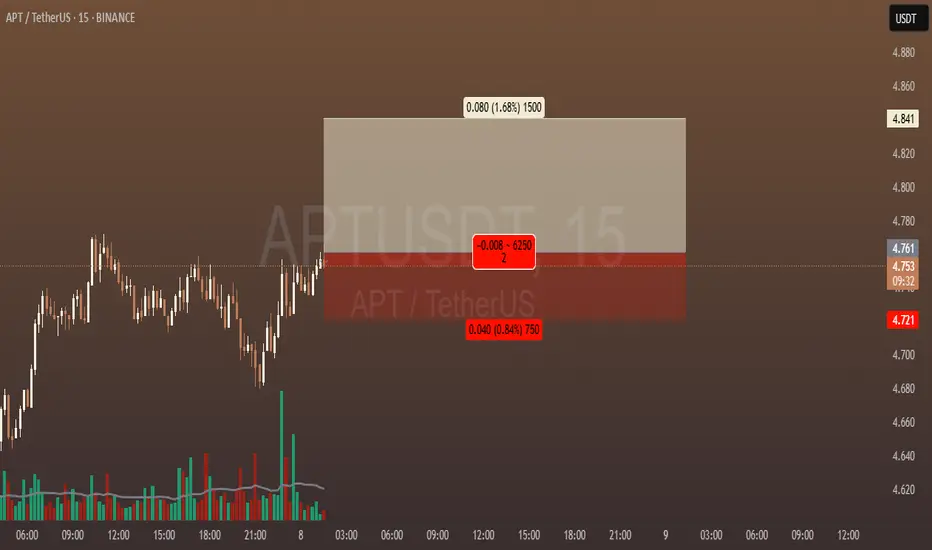
it's time to going up for APTUSDT!!!!!before buying, please check for being sure about your opinion about this CRYPTOCURRENCY!!!
(in every target you want, closed the position but our target is the third one)
*Guy's the entry place is importance things in enter in a position and be careful do not going up your leverage over 7x ,all things it's about risk management*
*************************************************
if you want to enter in this position:
Enter Price: 4.761
Target1: 4.777
Target2: 4.800
Target3(Final Target): 4.841
Stoploss: 4.721
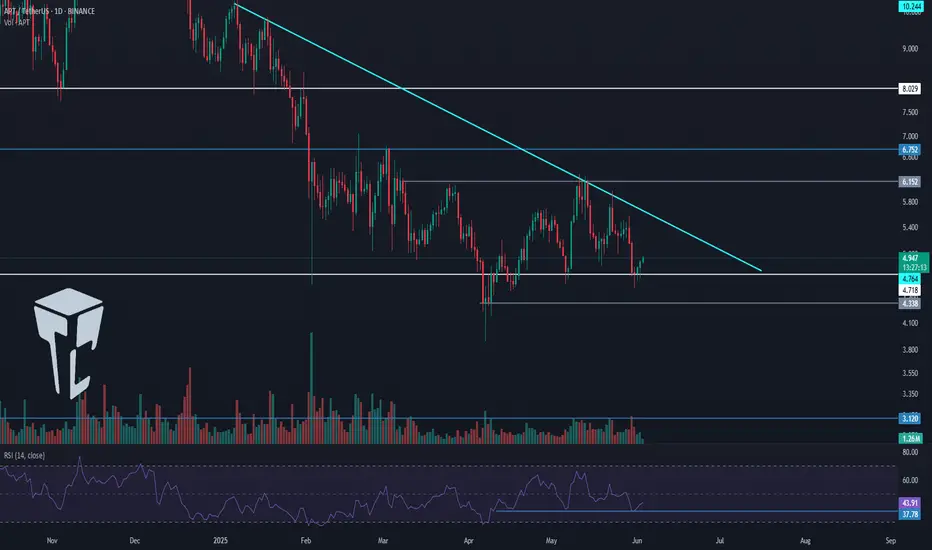
TradeCityPro | APT: Triangle Squeeze Near Crucial Support Zone👋 Welcome to TradeCity Pro!
In this analysis, I’ll be reviewing the APT coin. The Aptos project is one of Ethereum’s Layer 2 solutions.
✔️ This project’s token currently holds a market cap of $3.1 billion and ranks 32nd on CoinMarketCap.
📅 Daily Timeframe
On the daily chart, you can see a very strong support level at 4.718, which has been tested multiple times. The price has once again reached this zone.
💥 A descending trendline can also be drawn, showing clear reactions from the price. The area between this trendline and the 4.718 support forms a triangle pattern.
⭐ If the 4.718 support breaks, a short position could be considered. A breakdown below 37.78 on the RSI would serve as strong confirmation of bearish momentum.
📉 The initial target for the short would be 4.338. However, if a new bearish leg forms and the market heads toward lower lows, a drop toward the 3.12 support level is also possible.
📊 Confirmation of a bullish reversal would come from a breakout above the descending trendline. If this trendline is broken and the 6.152 trigger activates, it would justify opening a long position or even buying in the spot market.
🛒 When it comes to spot purchases, the most important factor is a trend reversal in Bitcoin dominance. Personally, I do not buy any altcoins on spot until Bitcoin dominance shifts downward on the daily chart — I only trade them in futures.
📝 Final Thoughts
This analysis reflects our opinions and is not financial advice.
Share your thoughts in the comments, and don’t forget to share this analysis with your friends! ❤️
APTOS $APTI don't think I need to explain what APTOS is here.
Right now, it's a good point for a swing position, which is why you're seeing this post.
Best regards EXCAVO

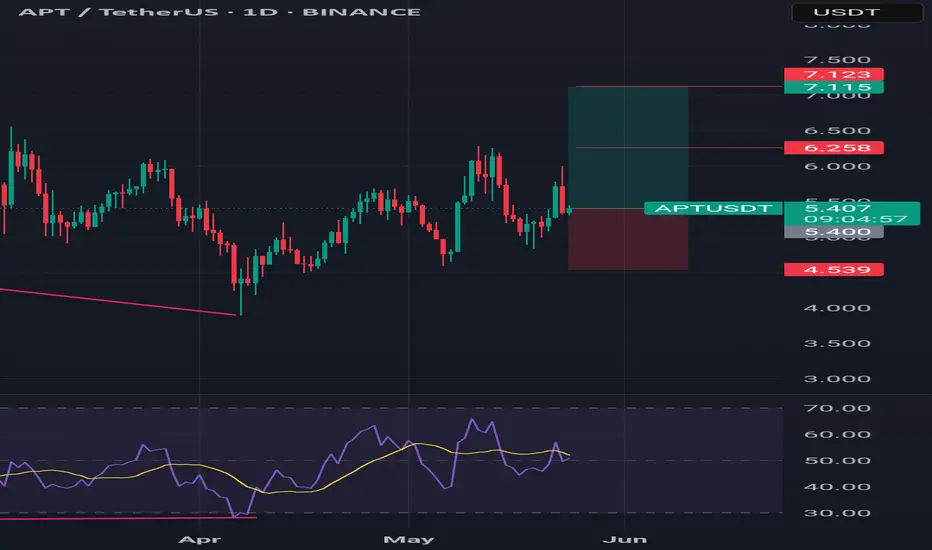
Aptus Apt usdt Daily analysis
Time frame daily
Risk rewards ratio >2 👈👌
Target 7.4$
Pattern = two bottom
APTUSDTThe specified range is important, and if the upward trend is maintained, market sentiment remains positive, liquidity enters, and we see good momentum from this currency in the above timeframe, we can consider the specified scenario probable.
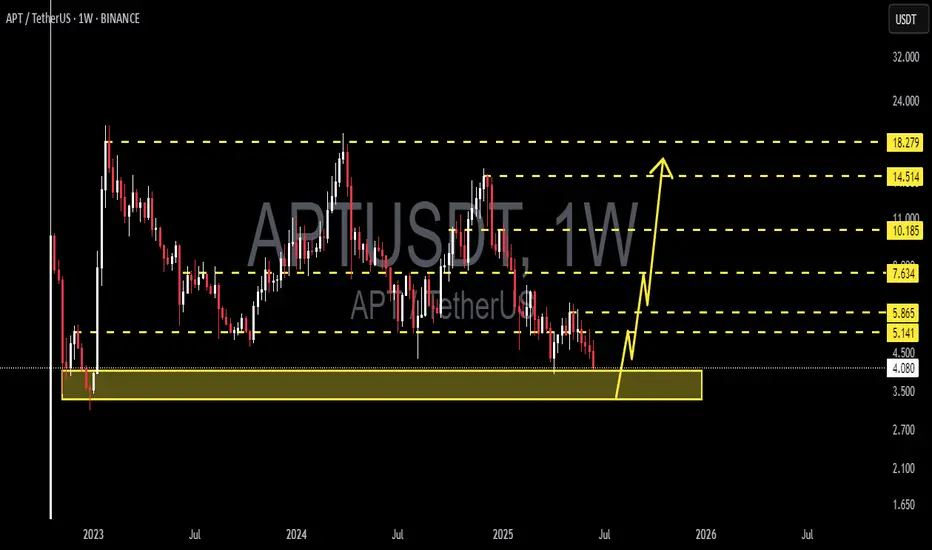
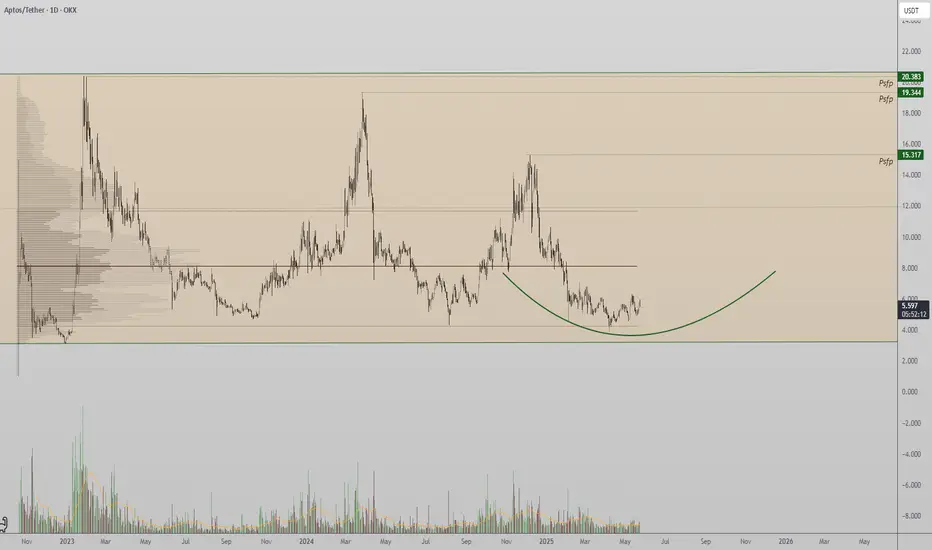
Aptos Positioned at Key Buy Zone — Eyes on POC BreakoutAptos is currently trading at a significant technical support zone — the range low of a major high time frame consolidation that has held since 2022. This range low presents a compelling opportunity for accumulation, especially as price hovers around the value area low, near the $24 level.
The market structure suggests a potential rounding bottom formation, provided price continues to close above this region. This could signal a build-up in demand, reinforcing the idea that Aptos is undergoing an accumulation phase at the lower bounds of its multi-year range.
The most critical level to watch is the point of control (POC) — the area with the highest volume traded within the range. A clean break and sustained close above the POC would mark a significant shift in market dynamics and increase the probability of an expansion move towards the range high.
Historically, once Aptos has managed to reclaim the POC, price has rallied to the $19–$20 zone. This recurring pattern adds more weight to the breakout scenario and gives traders a clear blueprint of what could unfold next.
From a technical standpoint, until the POC breaks, price action is likely to remain in a sideways, accumulation-type structure. However, the confluence of support at the value area low and the extended time spent consolidating at this range increases the odds of a breakout attempt.
A sustained hold above $24, followed by a breakout of the POC, would set the stage for a potential strong upward rotation toward the upper bounds of the range.
Accumulation appears to be underway. A confirmed break of the point of control would shift momentum strongly in favor of bulls and open up targets toward the $19–$20 region.
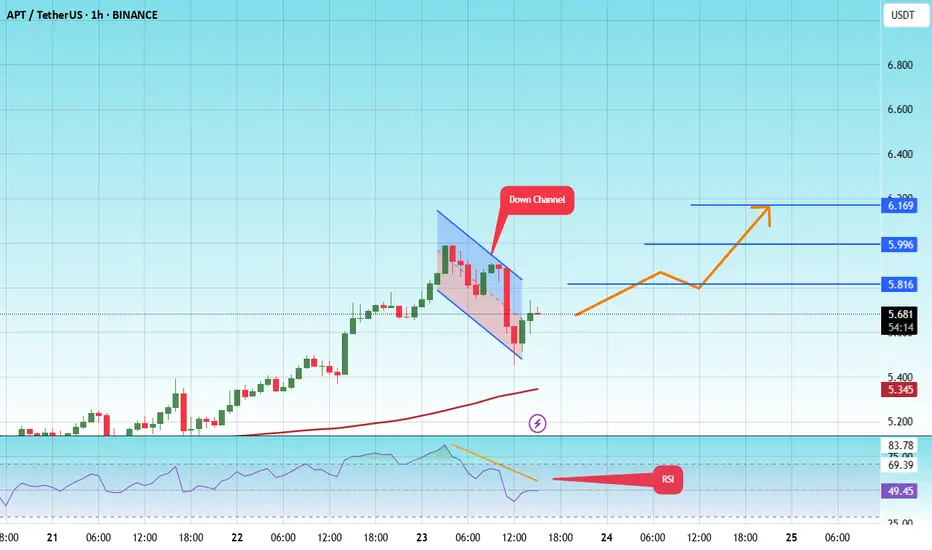
#APT/USDT#APT
The price is moving within a descending channel on the 1-hour frame and is expected to break and continue upward.
We have a trend to stabilize above the 100 moving average once again.
We have a downtrend on the RSI indicator that supports the upward move with a breakout.
We have a support area at the lower limit of the channel at 5.50, acting as strong support from which the price can rebound.
Entry price: 5.70
First target: 5.82
Second target: 6.00
Third target: 6.17