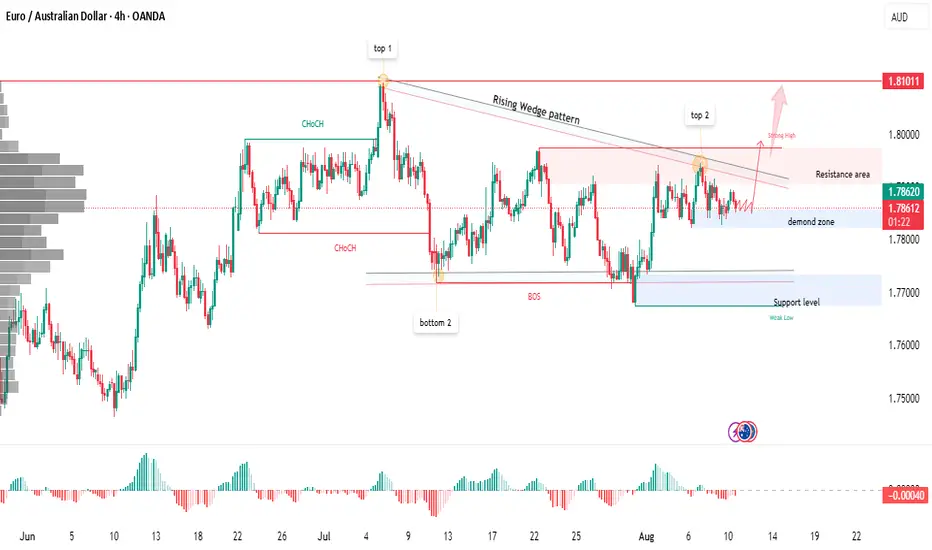
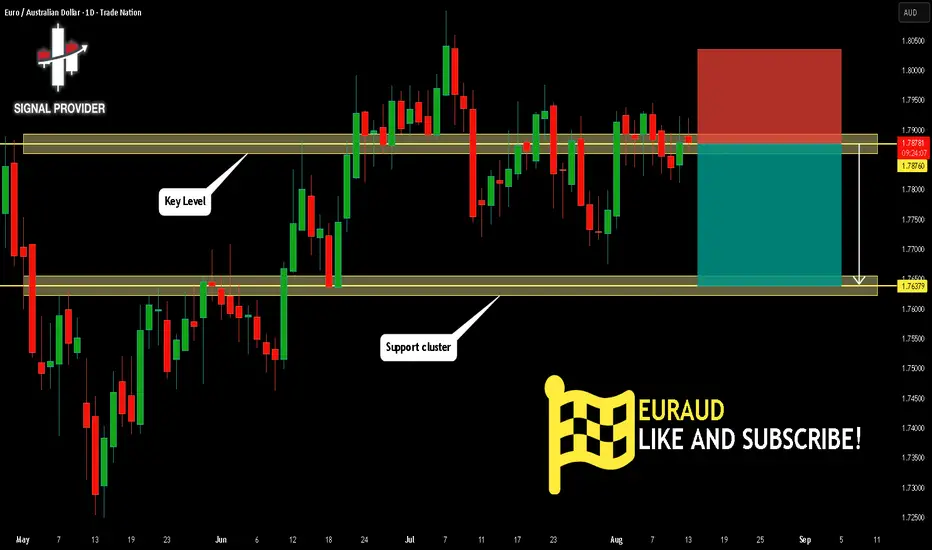
: EUR/AUD | Rising Wedge Pattern Near Key ResistanceEUR/AUD has been consolidating after forming a clear Rising Wedge structure between the first peak (Top 1) and the second peak (Top 2). Price action has recently tested the resistance area around 1.7860–1.7900, while holding above a demand zone near 1.7820.
From a market structure perspective:
CHo
Related currencies
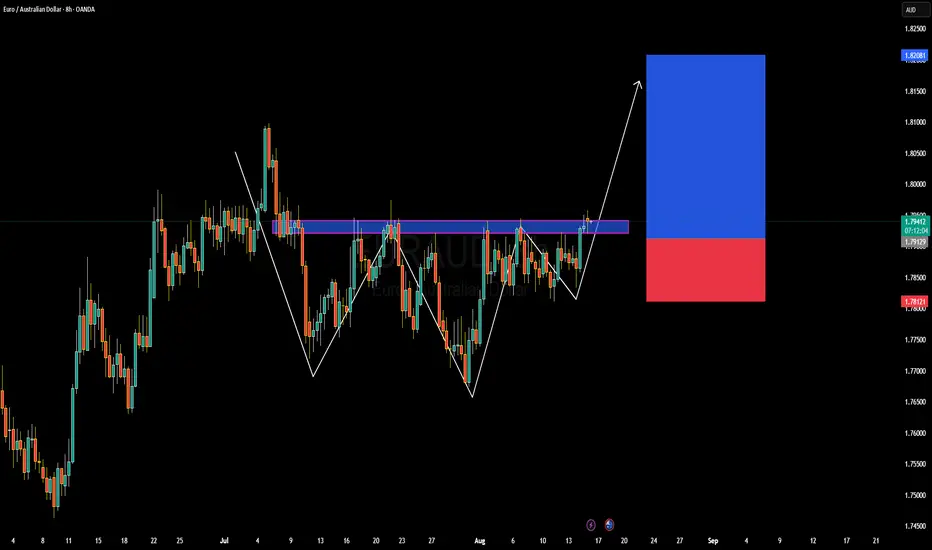
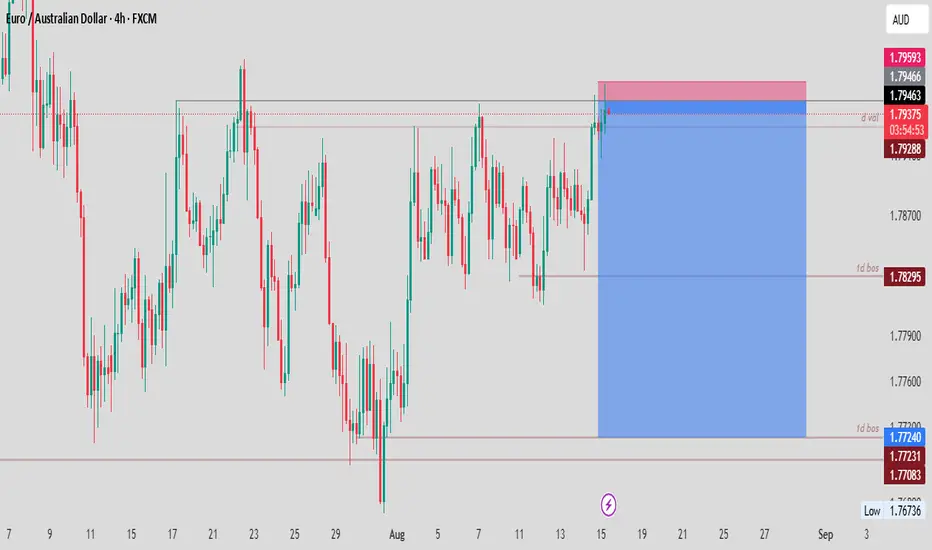
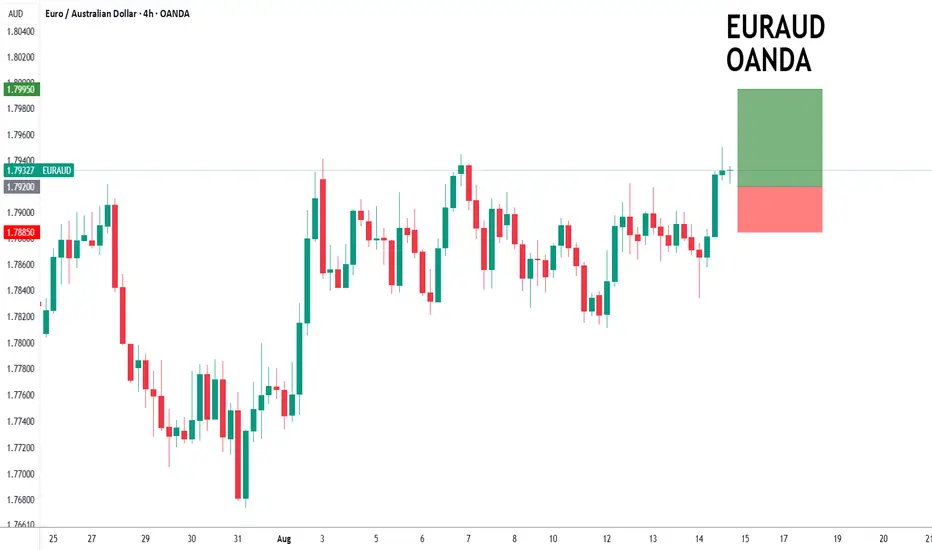
EURAUD Forming Bullish ContinuationEUR/AUD is edging above a persistent resistance zone around 1.7950–1.7970 on the 8-hour chart. The pair has formed a classic two-leg corrective structure, and the recent higher low suggests bullish continuation. A clean break and hold above this resistance could pave the way for a retest of the 1.82
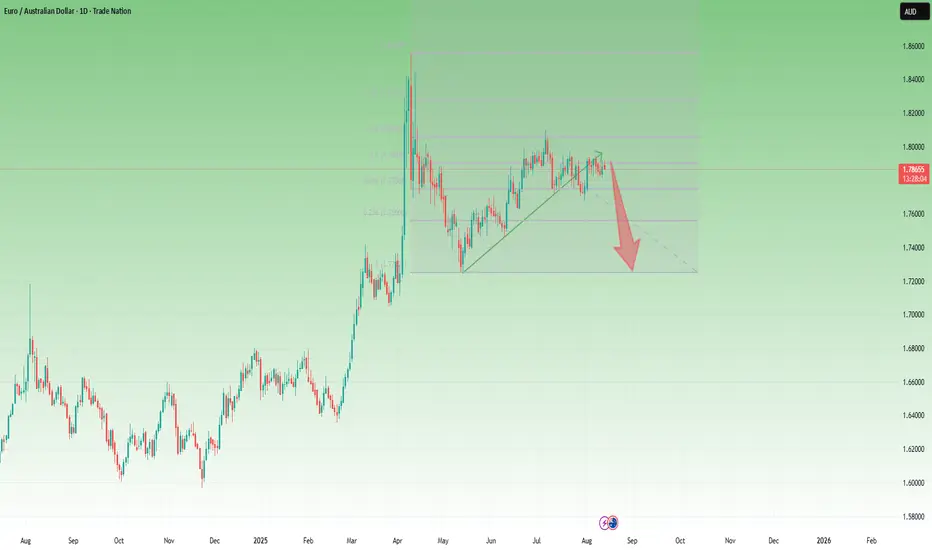
EUR/AUD – Second Chance for Bears?About a month ago, I drew attention to a potential long-term short setup on EUR/AUD, highlighting that the pair had formed a measured move pattern after the sharp drop from 1.85.
Since then, price broke below the rising trendline, but at that moment the drop lacked follow-through, and EUR/AUD bounc
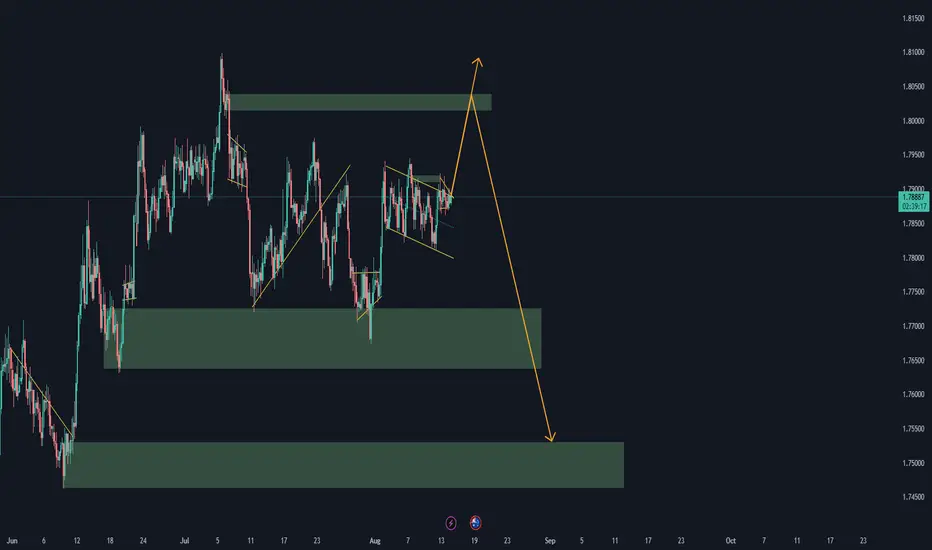
EUR/AUD Technical analysis - 081402025I have a positive view on EUR/AUD at this point! Look like a sell but for me at this time it look like a buyyyyyy
EURAUD, We are still in.In the higher timeframes, the pair is bullish, very, and that's where the problem is, that there aren't recent structures to break to signify a trend shift.
In the weekly timeframe, the pair is still bullish, facing the same monthly situation of lacking recent structures.
In the daily timeframe thou
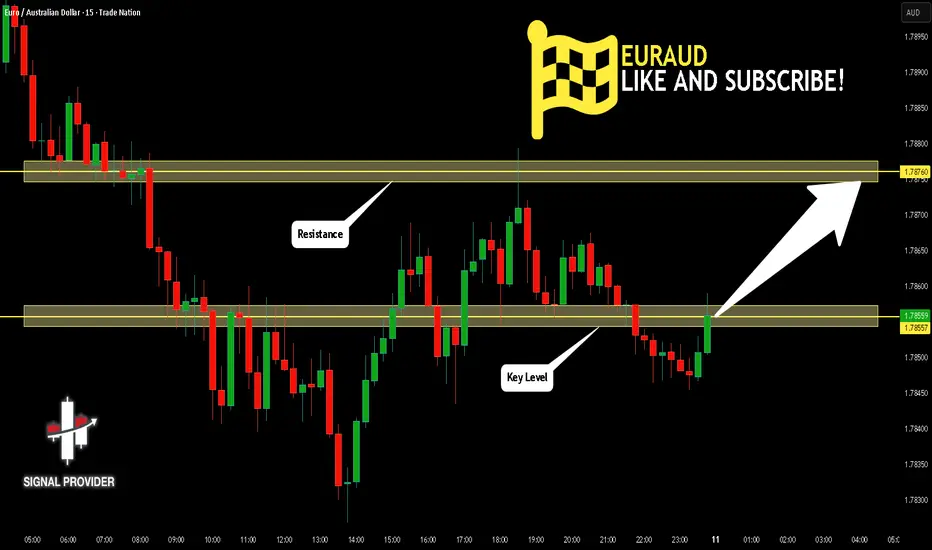
EURAUD Is Bullish! Buy!
Please, check our technical outlook for EURAUD.
Time Frame: 15m
Current Trend: Bullish
Sentiment: Oversold (based on 7-period RSI)
Forecast: Bullish
The market is trading around a solid horizontal structure 1.785.
The above observations make me that the market will inevitably achieve 1.787 leve
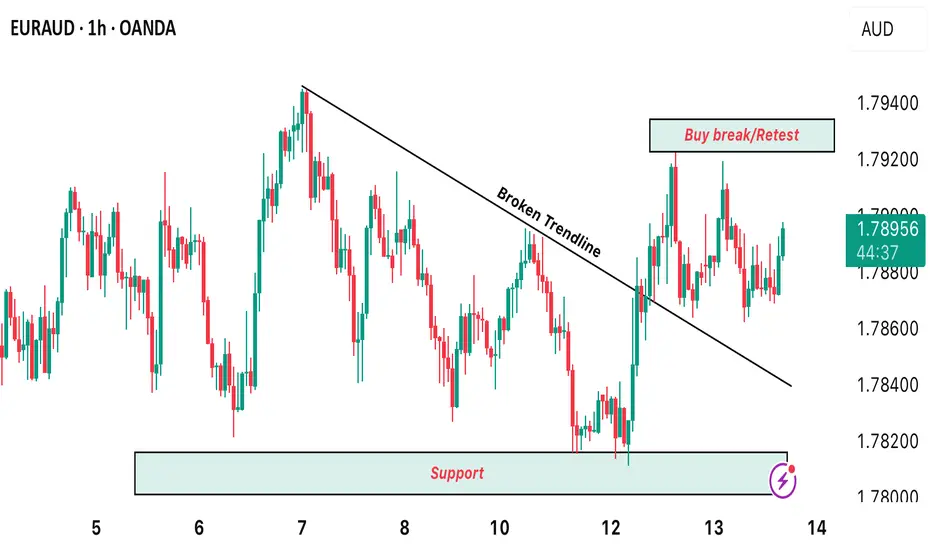
EURUAD LOOKING PROMISING FOR A BUY!!!! WATCHOUT Here’s H1 timeframe on EURUAD and we’re looking forward to buying upon the break/retest of 1.79228 Technical analysis suggest the possible buy opportunity as we see a break of the previous local trendline and a retest to it which signals bullish strength . Therefore, we plan to go long on this pair.
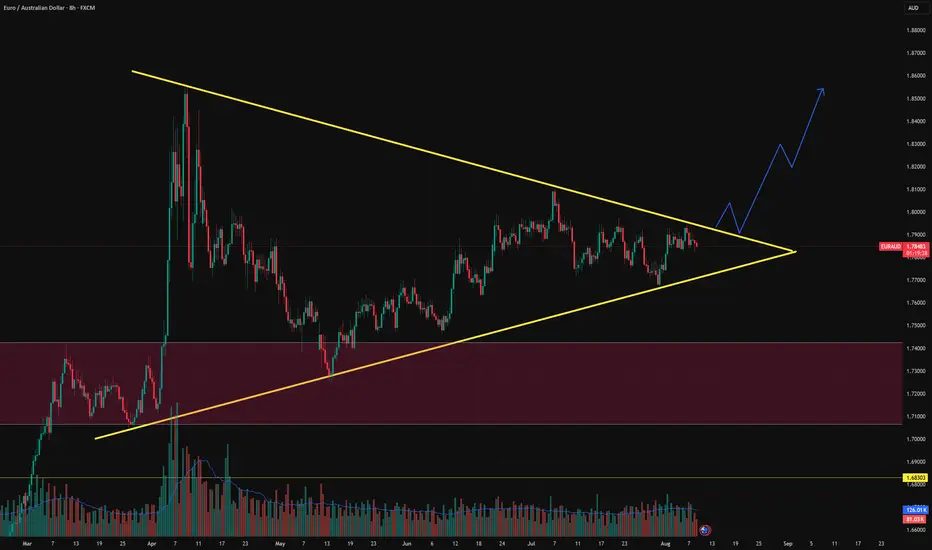
EUR/AUD Analysis – Symmetrical Triangle FormationKey Observations:
Pattern Type: Symmetrical triangle with converging trendlines.
Higher lows show demand stepping in.
Lower highs signal sellers defending resistance.
Volume Profile: Volume is tapering off, aligning with triangle logic → explosive move likely upon breakout.
Liquidity Pool Below
EURAUD Will Fall! Short!
Here is our detailed technical review for EURAUD.
Time Frame: 1D
Current Trend: Bearish
Sentiment: Overbought (based on 7-period RSI)
Forecast: Bearish
The market is on a crucial zone of supply 1.787.
The above-mentioned technicals clearly indicate the dominance of sellers on the market. I recom
EURAUD to find buyers at market price?EURAUD - 24h expiry
Indecisive price action has resulted in sideways congestion on the intraday chart.
RSI (relative strength indicator) is flat and reading close to 50 (mid-point) highlighting the fact that we are non- trending.
Risk/Reward would be poor to call a buy from current levels.
A mo
See all ideas
Summarizing what the indicators are suggesting.
Oscillators
Neutral
SellBuy
Strong sellStrong buy
Strong sellSellNeutralBuyStrong buy
Oscillators
Neutral
SellBuy
Strong sellStrong buy
Strong sellSellNeutralBuyStrong buy
Summary
Neutral
SellBuy
Strong sellStrong buy
Strong sellSellNeutralBuyStrong buy
Summary
Neutral
SellBuy
Strong sellStrong buy
Strong sellSellNeutralBuyStrong buy
Summary
Neutral
SellBuy
Strong sellStrong buy
Strong sellSellNeutralBuyStrong buy
Moving Averages
Neutral
SellBuy
Strong sellStrong buy
Strong sellSellNeutralBuyStrong buy
Moving Averages
Neutral
SellBuy
Strong sellStrong buy
Strong sellSellNeutralBuyStrong buy
Displays a symbol's price movements over previous years to identify recurring trends.
Frequently Asked Questions
The current rate of AUDEUR is 0.55718 EUR — it has increased by 0.18% in the past 24 hours. See more of AUDEUR rate dynamics on the detailed chart.
The value of the AUDEUR pair is quoted as 1 AUD per x EUR. For example, if the pair is trading at 1.50, it means it takes 1.5 EUR to buy 1 AUD.
The term volatility describes the risk related to the changes in an asset's value. AUDEUR has the volatility rating of 0.47%. Track all currencies' changes with our live Forex Heatmap and prepare for markets volatility.
The AUDEUR showed a −0.78% fall over the past week, the month change is a −0.44% fall, and over the last year it has decreased by −7.53%. Track live rate changes on the AUDEUR chart.
Learn how you can make money on rate changes in numerous trading ideas created by our community.
Learn how you can make money on rate changes in numerous trading ideas created by our community.
AUDEUR is a minor currency pair, i.e. a popular pair that is not associated with USD. Such pairs are also called cross currency pairs.
Currencies are usually traded through forex brokers — choose the one that suits your needs and go ahead. You can trade AUDEUR right from TradingView charts — just log in to you broker account. Check out the list of our integrated brokers and find the best one for your needs and strategy.
When deciding to buy or sell currency one should keep in mind many factors including current geopolitical situation, interest rates, and other. But before plunging into a deep research, you can start with AUDEUR technical analysis. The technical rating for the pair is sell today, but don't forget that markets can be very unstable, so don't stop here. According to our 1 week rating the AUDEUR shows the sell signal, and 1 month rating is sell. See more of AUDEUR technicals for a more comprehensive analysis.