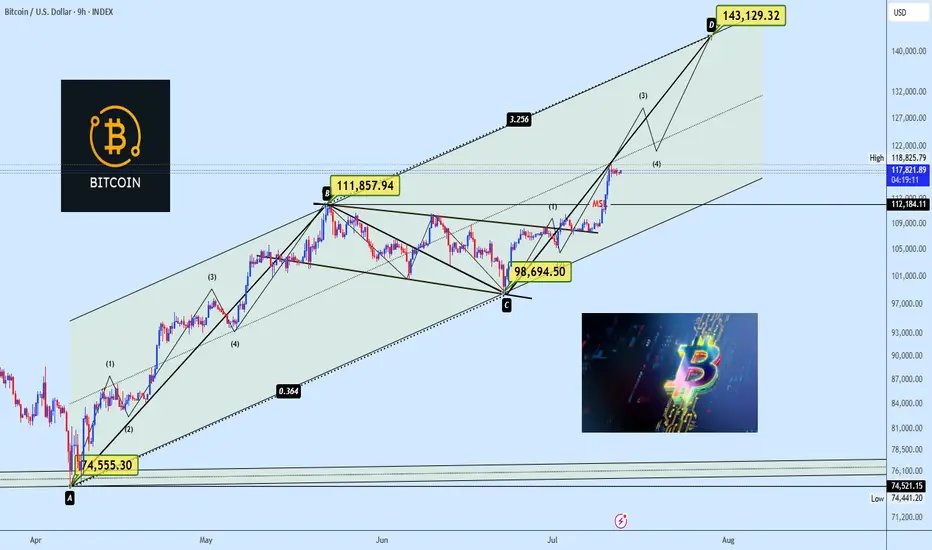
BTC Breakout is Real Flag Playing Out with Wave 3 MomentumBitcoin is looking really clean here. After weeks of sideways grind inside what looked like a consolidation trap, the structure has finally matured into something meaningful, a classic bullish flag breakout layered inside a broader Elliott Wave count.
What really stands out is how the flag structure (B → C) formed a smooth pullback after the strong A → B impulse. That was the pole. Now we’ve broken out of the flag, and momentum is picking up again, likely heading into wave (3) of the new leg pointing towards D.
This isn’t just about a flag the entire move is developing inside a wide ascending channel, and price is following it almost perfectly. The bullish momentum coming off the breakout zone is clean, no choppiness just strong candles and impulsive drive.
We might get a short-term breather (sub-wave 4 of current wave 3), but structure suggests more upside is likely as long as price holds above that $113K–$115K zone.
What I'm Watching Right now:
Support zone: $113K – $115K
Short-term target: $123-$127K
Final projection (if channel holds): $140K–$145K
Measured move from the flag and wave count both point up there, so I’ll be watching for minor pullbacks as entry opportunities.
Personal Take
I like when patterns align naturally not forced. This one’s got that nice blend of momentum, structure, and price behavior. I’m not rushing entries here, but will scale into dips if price holds support and volume confirms.
Have you spotted this setup on your end too? Drop your view in the comments always keen to see how others are reading this.
Follow for clean, no hype market breakdowns.
BTCUSD trade ideas
CRYPTO - Big Guns Deployed (BTC $174K!)13 minutes of video; looking at Bitcoin, TOTAL, altcoins.
HOT breaking out now! - Trade setup in video.
See you @ BTC $174K!
Not advice

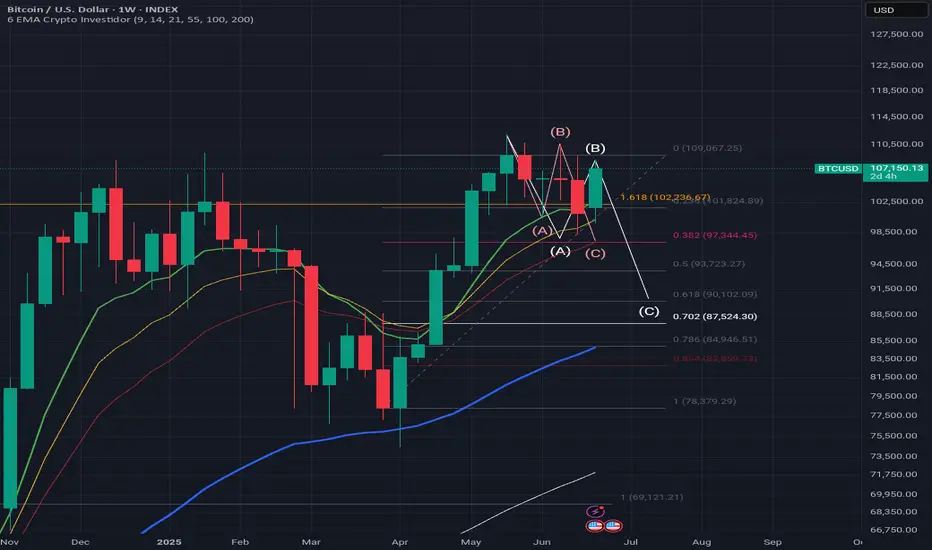
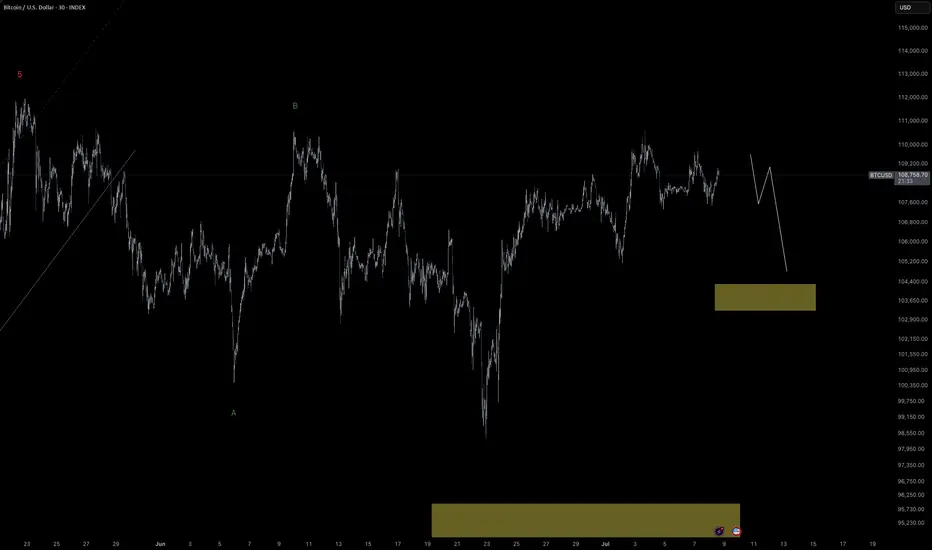
C Leg NOT in.BTC didnt retrace to the 0.382fib and its probably an A leg in a sideways market.
The C Leg need to back test the 0.382fib and could possibly go down to the 0.854fib.
Bitcoin - The ultimate breakdown for 2025/2026Welcome to my channel and this analysis. In this analysis I will dive deep in the current Bitcoin’s bullmarket. I will examine charts from the monthly, weekly, daily and 4H charts, and also on chain data. This will be a complete insight in Bitcoin’s price.
------------------------
Monthly timeframe
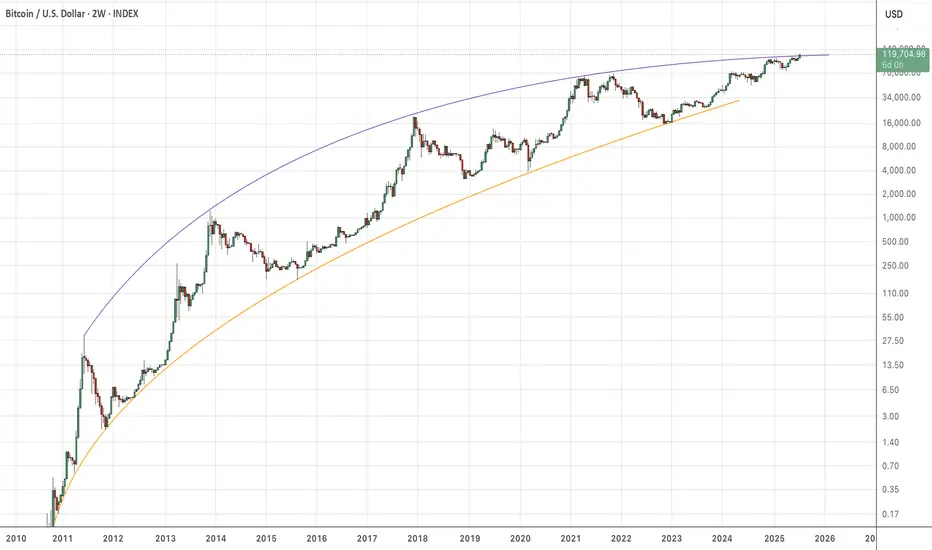
Logarithmic BTC chart
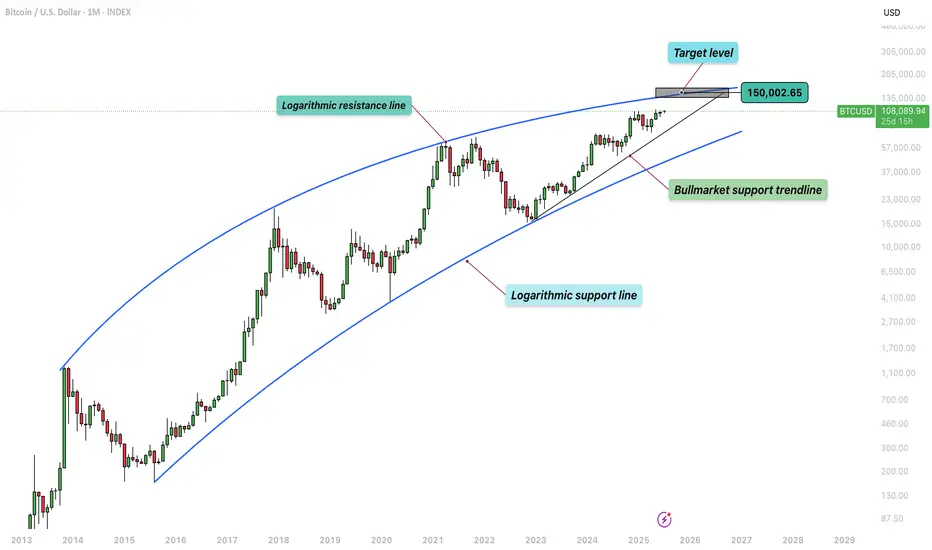
This chart presents a long-term logarithmic analysis of Bitcoin using monthly candles, covering the period from around 2013 to mid-2025. The structure is defined by two major curved lines representing a logarithmic resistance and support channel, which frames Bitcoin's price movement over more than a decade. These lines form a dynamic, upward-sloping price corridor, capturing Bitcoin's historically exponential price behavior and cyclical nature. The vertical axis uses a logarithmic scale to better reflect percentage-based changes, which is critical when analyzing an asset like Bitcoin that has grown from under $100 to over $100,000 in just a few years.
The chart displays clear multi-year cycles. The first notable cycle begins in 2013, followed by a significant correction in 2014–2015. A new bullish phase emerges between 2016 and 2018, peaking near $20,000. This is followed by a crash into 2018. A longer accumulation period precedes the 2020–2021 rally, which reaches a high around $69,000 before another sharp decline. From the bottom in late 2022 or early 2023, Bitcoin begins another uptrend, forming a steep rise along a newly established bullmarket support trendline. This trendline represents a more aggressive, linear support structure within the broader logarithmic curve, showing the strong momentum driving the current bull phase.
By July 2025, Bitcoin is trading around $108,000, advancing steadily toward the upper boundary of the long-term logarithmic resistance. A key element of this chart is the target level marked at approximately $150,000, which aligns closely with the point where the current trajectory intersects the upper logarithmic resistance. This zone has been highlighted as a likely area of interest, possibly signaling a market top or at least significant resistance, based on Bitcoin's past behavior. Historically, Bitcoin has tended to reverse sharply or consolidate after reaching this upper boundary, making the target zone an area of potential distribution or heightened volatility.
The bullmarket support trendline serves as a short- to medium-term structure within the larger logarithmic channel. As long as price holds above this line, the current bullish structure remains intact. A breakdown below this trendline could indicate a loss of momentum and trigger a broader correction.
The use of logarithmic trendlines underscores Bitcoin’s tendency to move in exponential growth cycles, shaped by macroeconomic trends, halving events, and adoption waves. The resistance and support boundaries function as dynamic guides for long-term expectations rather than rigid barriers.
The stoch RSI crosses
This chart provides a technical overview of Bitcoin on a monthly timeframe using candlestick analysis and the Stochastic RSI (Stoch RSI) oscillator to distinguish between bull and bear market phases. The Stochastic RSI, shown at the bottom of the chart, is a momentum oscillator derived from the RSI rather than price directly, making it particularly useful for identifying overbought and oversold conditions in trending markets. The key thresholds are the 80 level at the top and the 20 level at the bottom, which respectively indicate overbought and oversold zones.
The chart spans from 2017 to mid-2025, clearly separating bull and bear markets using vertical red lines and labeled annotations. Each major cycle aligns with movements in the Stoch RSI indicator. Notably, crosses above the 80 line (into overbought territory) are often associated with late-stage bull market tops or strong bullish continuations. Crosses below the 20 line (into oversold territory) typically align with bear market bottoms or the start of new accumulation phases.
Starting with the December 2017 peak, the Stoch RSI crossed above the 80 level, reaching extreme overbought territory. This cross occurred at the height of that bull cycle, signaling a likely exhaustion of momentum. Not long after this peak, the market entered a bear phase, confirmed by the downward cross of the Stoch RSI below the 80 level, and eventually below 20, leading into the 2018–2019 bear market.
By August 2019, the Stoch RSI crossed below the 20 level, signaling oversold conditions. Although this did not immediately launch a new bull market, it did suggest the market was bottoming out. This was followed by a gradual recovery and another decisive upward cross above 80 around April 2021, right in the midst of the strong 2020–2021 bull run. That cross confirmed the continuation of upward momentum and coincided with Bitcoin reaching new all-time highs.
As the price peaked in late 2021 and early 2022, the Stoch RSI again turned downward and dropped below the 20 threshold, marking another prolonged bear market. This downtrend was confirmed as the oscillator remained suppressed in the oversold zone for most of 2022.
The Stoch RSI is now moving again towards the overbought territory. This means that bulls have the control in the market and likely to push higher.
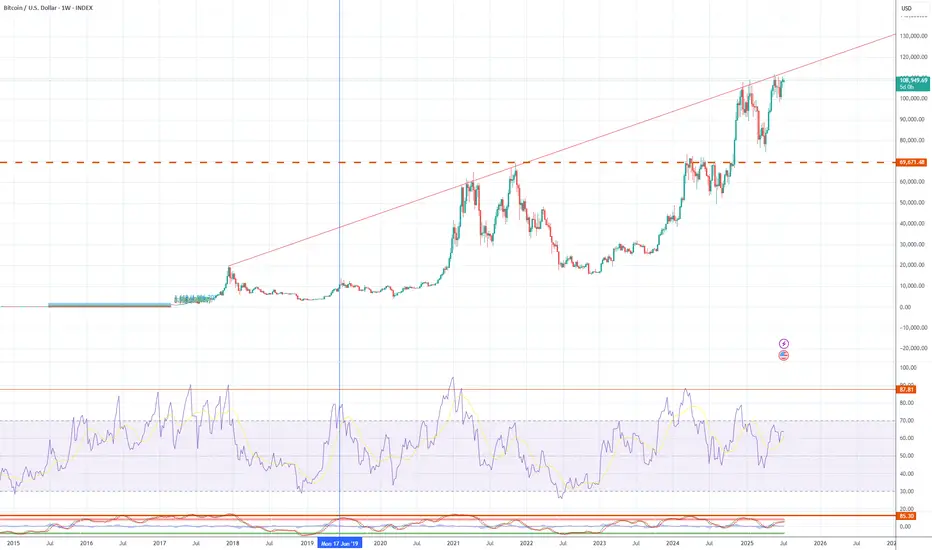
RSI with the consolidation and resistance trendline
This chart presents a broader monthly view of Bitcoin's price action alongside the Relative Strength Index (RSI), revealing a compelling structural alignment between price momentum and long-term resistance dynamics.
At the top of the chart, the candlestick pattern shows a clear upward trend spanning across multiple market cycles. A long-term resistance trendline has been drawn that connects the major highs from the two previous bull markets, specifically the peaks in late 2017 and late 2021. This resistance line acts as an upper boundary to the macro trend and, so far, the current price action in 2025 has not yet tested this long-term resistance. In fact, while Bitcoin has recently reached above $100,000, it remains below the ascending resistance trendline, suggesting that there could still be room for price to move higher before encountering the next major overhead challenge. The structure implies a potential upward continuation if momentum sustains, and the price may attempt to test this historical trendline in the near future.
Below the price chart, the RSI indicator offers additional insight into the underlying strength of this move. A descending RSI trendline connects the previous overbought peaks from 2017 and 2021, forming a macro resistance trendline in momentum that mirrors the structure seen in price. This declining RSI resistance has not yet been reached in the current cycle, implying that momentum still has space to grow before hitting a potential exhaustion point. The RSI is currently capped within a relatively tight consolidation box, with values fluctuating between the mid-60s and low-70s.
200W SMA crosses above the previous ATH
This chart illustrates the long-term price action of Bitcoin, focusing on the relationship between the 200-week simple moving average (SMA) and previous all-time highs (ATHs). Historically, when the 200-week SMA crosses above the previous cycle’s ATH, it has coincided with periods near the cycle tops. For example, in December 2017 and January 2022, the 200-week SMA moved above the prior ATH, which closely aligned with significant market peaks.
In the current cycle, however, the 200-week SMA has not yet crossed above the previous ATH from 2021, which is around $68,889.04. This is notable because, in past cycles, this crossover has typically marked the later stages of a bull run. The fact that this crossover has not yet occurred suggests that Bitcoin may still have room to move higher before reaching a new cycle top. However, it is important to recognize that this does not guarantee further upward movement. Even if Bitcoin’s price consolidates or moves sideways for an extended period, the 200-week SMA will gradually rise due to its lagging nature and could eventually cross above the previous ATH without a significant price rally.
Lets now move to the weekly charts and analyse where we are.
------------------------
Weekly timeframe
Support and resistance trendlines
This chart shows Bitcoin’s price action on a weekly timeframe, highlighting three key trendlines. Two resistance trendlines are drawn from the peaks of the last two major cycles, forming an upper boundary for price action. These lines act as potential resistance zones, indicating areas where previous rallies have topped out and where the current price could face selling pressure if it approaches these levels again.
Additionally, there is a clearly defined rising trendline that serves as bull market support. This trendline has been respected throughout the current cycle, connecting the higher lows since the market bottomed out in late 2022. As long as Bitcoin’s price continues to hold above this bull market support trendline, the overall bullish structure remains intact. This suggests that the uptrend is still healthy and that corrections or pullbacks, as long as they stay above this line, are part of a normal, sustainable bull market. If the price were to break below this support, it could signal a shift in market sentiment and potentially a deeper correction. For now, maintaining support on this trendline is a positive sign for the ongoing bull market.
Bearish divergence
The chart shows that Bitcoin has formed three consecutive price peaks, with each new high surpassing the previous one. This indicates that, from a price perspective, the market has maintained its upward momentum over this period. However, when looking at the Relative Strength Index (RSI) below the price chart, a different pattern emerges. Each time the price has made a new high, the RSI has registered a lower high, resulting in a clear bearish divergence. This is visually reinforced by the downsloping trendline that can be drawn across the RSI highs, in contrast to the uptrend in price.
Bearish divergence between price and RSI, as seen here, often signals underlying weakness in the buying momentum, even as price continues to rise. It suggests that each successive rally is being driven by less enthusiasm or participation from buyers. Given this setup, it is possible that the RSI could revisit the downsloping trendline in the near future. If this occurs, the price might make a marginally higher high, potentially forming a third peak slightly above the current level. This would maintain the divergence and could act as a warning sign for traders to be cautious about the sustainability of the current uptrend.
Stoch RSI
This chart presents the weekly price action of Bitcoin alongside the Stochastic RSI indicator. What stands out is the clear cyclical pattern in the Stoch RSI, where it tends to reach oversold levels roughly once every half year. These oversold readings have historically aligned with significant local bottoms in the price, signaling favorable buying opportunities for traders and investors. After reaching these low points, the Stoch RSI typically trends upward, eventually entering the overbought zone.
When the Stoch RSI enters overbought territory, as it does several times on this chart, it often coincides with local price peaks. These moments serve as warnings that the market may be overheated in the short term, and traders should be cautious about opening new long positions. The overbought readings suggest that a pullback or period of consolidation could be imminent, as the market works off excess bullish momentum.
Currently, the Stoch RSI is once again in the overbought zone. This suggests that Bitcoin may be vulnerable to a further pullback or at least a pause in its upward movement. While this does not guarantee an immediate reversal, it does mean that risk is elevated.
Failed breakout/liquidity grab
This weekly Bitcoin chart illustrates a strong and consistent uptrend that has been developing since late 2023. Each major move begins with a clear breakout above previous consolidation zones, followed by a retest of the broken resistance, which then acts as support, confirming the trend's strength. These retests tend to hold well, setting up for new bullish impulses.
In the earlier stages, we see BTC breaking out of a range around the $48,851 support level. After a successful retest of that zone, the price surged and entered a new consolidation phase just below $73,643. A second breakout occurred from this level, again followed by a retest that confirmed it as a new support level. This pattern reflects textbook bullish market structure: breakout, retest, and continuation.
However, the current price action shows something different. BTC has returned to its previous high around the $109,301 resistance level. Unlike the previous times, where strong bullish candles closed above resistance, this attempt has only pierced above the level with a wick, indicating potential exhaustion or hesitation. The highlighted label "Failed breakouts / Liquidity grab" suggests that these wick movements may have been attempts to trigger stop orders and gather liquidity before a possible retracement.
Now we will dive deep into the daily timeframe.
------------------------
Daily timeframe
Resistance, bullflag and Stoch RSI
This daily chart of Bitcoin reveals a period of consolidation just below a key resistance zone, which aligns with the previous all-time high area. BTC has been ranging within this red-marked resistance block, showing clear hesitation from buyers to push beyond it with conviction.
During this consolidation, a well-formed bull flag structure appeared, a bullish continuation pattern, signaling potential for further upside. The breakout from this bull flag occurred earlier this week, providing initial bullish confirmation as price pushed briefly above the upper boundary of the flag. However, the breakout lacked follow-through. Instead of sustaining momentum and closing decisively above resistance, BTC appears to have experienced a fake-out, with price now retracing back inside the prior range.
This failed breakout is particularly notable given the context of the Stochastic RSI indicator, which is currently in the overbought zone.
------------------------
4H timeframe
4H FVG and liquidity grab
This 4-hour chart of Bitcoin shows a clear structure where price has recently formed an equal high around the $110,612 level. Equal highs are often seen as zones where liquidity builds up, since many stop-loss orders from short positions typically rest just above them. This makes the area particularly attractive for a potential liquidity grab.
At the moment, BTC appears to be in a short-term retracement phase after rejecting from this equal high region. During this move, price left behind a bullish Fair Value Gap (FVG), which is a zone of inefficiency where price moved too quickly to fill orders. This FVG is now acting as a potential support zone. The chart suggests that BTC may revisit this FVG to rebalance before making another attempt to break through the equal highs.
If BTC can hold the FVG and generate upward momentum, a move above the equal highs becomes more likely. In that case, the resting liquidity just above those highs could be targeted, leading to a quick wick or breakout move before price potentially reverses again.
------------------------
Liquidation heatmap
1 month
This Binance BTC/USDT liquidation heatmap clearly shows that the majority of the liquidity is stacked to the upside. The bright yellow and green bands, which represent areas of high liquidation potential and leverage exposure, are heavily concentrated just above the current price levels, especially around the $111,000 to $114,000 zone. This indicates that many traders have short positions with stop-losses placed above these highs, making them prime targets for potential liquidation events.
As price moves closer to these high-liquidity zones, the probability increases that market participants, particularly larger players or algorithms, may push BTC upwards to trigger those stops and liquidate those positions.
1 week
The current price is hovering around the $108,000 range, with clear liquidity clusters forming both below and above this level. What stands out is the dense liquidation zone just below the current price, this suggests that many traders have placed long positions with stop-losses slightly under this support range. These positions create an opportunity for a liquidity sweep, where price briefly dips down to trigger liquidations, fill larger buy orders, and shake out weaker hands.
After such a sweep, the heatmap shows an even larger cluster of liquidation liquidity sitting just above the highs, especially around the $110,000 to $114,000 region. This is likely composed of stop-losses from short positions and breakout traders who entered too early. The concentration of liquidity here creates a strong incentive for price to target this zone after clearing the downside liquidity.
------------------------
Fear and greed index
Today
The Fear and greed today is at 66, meaning greed. This level suggests that market sentiment is optimistic, but not yet euphoric or irrational. In practice, it often means buyers are confident, and there’s still room for price continuation before we enter extreme greed territory
1 year chart
This chart displays the Crypto Fear & Greed Index over time, offering a visual representation of sentiment cycles in the Bitcoin market.
When examining the past year, you can see how sentiment has recovered significantly from the fear zone (below 30), especially from late 2024 into early 2025. This shift in sentiment aligned with BTC's price climbing back toward previous highs, indicating that sentiment is responding directly to price structure and bullish momentum.
------------------------
BTC exchange reserve
This chart, sourced from CryptoQuant, provides a clear visualization of the relationship between Bitcoin’s exchange reserves (blue line) and BTC price (white line), over a multi-year period. The key insight is the rapid and consistent decline in Bitcoin held on exchanges, especially noticeable from mid-2023 onward.
From around 2022, the amount of BTC on exchanges remained relatively stable. However, beginning in late 2022 and accelerating through 2023 into 2025, we see a shart and uninterrupted drop in exchange reserves.
This ongoing withdrawal trend typically signals accumulation behavior by investors. When BTC is withdrawn from exchanges and moved into cold storage or long-term wallets, it often reflects growing conviction among holders that price will rise and they don’t intend to sell in the short term.
------------------------
Final thoughts
This is a complete Bitcoin analysis for the community with a top-down analysis!
I have worked out a complete insight in the Bitcoin price with different analysis and on-chain data.
I would be excited if you boost, comment and share the analysis with your friends for the work that I have put in this analysis for everyone.
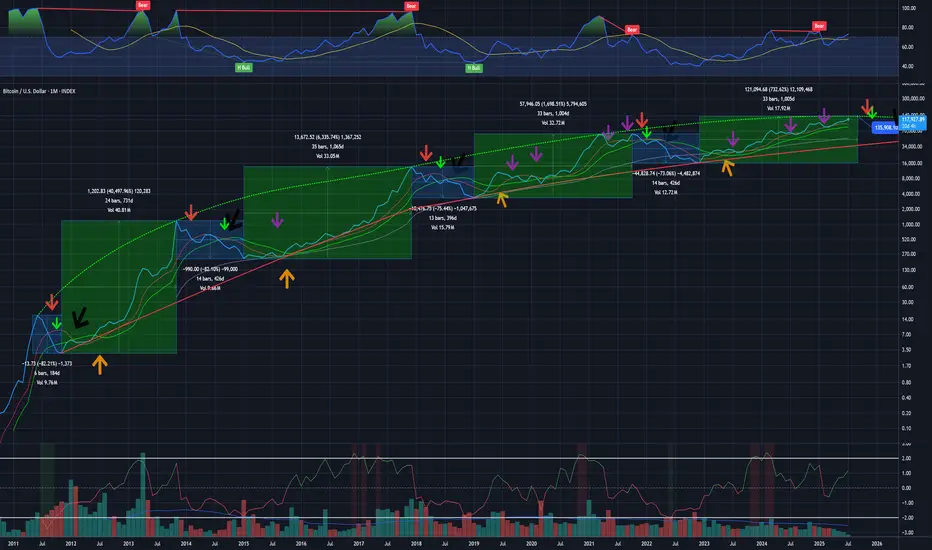
btcusd bull bear when monthly crossing DMAEvery time monthly closes below DMA 200 (Daily moving average) it could be start of bear market but it came out last times there were more fake (lila arrows).
But when it croses DMA 400 then it goes into multi month sell off to DMA 1400
Currently it is close to top and start of next 400 day sell off.
Bull market lasts 1000 days
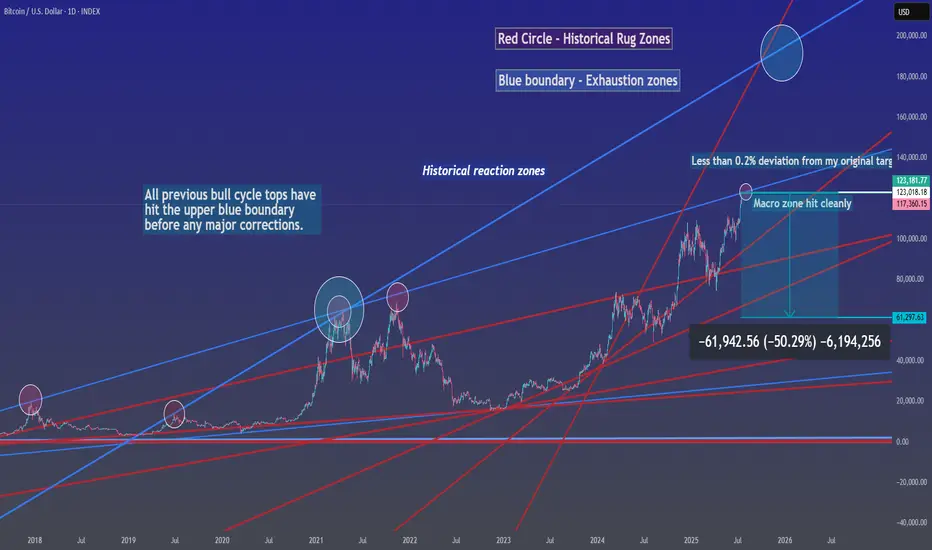
Historical Rug ZonesHistorically, every time BTC price action has interacted with this blue boundary zone, the market has corrected between 50% and 93%.
We are currently interacting with a historical exhaustion zone, where prior cycles have consistently triggered major corrections.
If history rhymes and BTC delivers even a 50% correction from here, the projected downside target would be around $61,000.
This is where late longs learn about early exits 🙂
BTCUSD LONG TERMBTCUSD Live Trading Session/ BTCUSD analysis #forex #forextraining #forex
Hello Traders
In This Video BTCUSD HOURLY Forecast By World of Forex
today BTCUSD Analysis
This Video includes_ (BTCUSD market update)
BTCUSD Analysis today | Technical and Order Flow
#usdjpy #usdchftechnicalanalysis #usdjpytoday #gold
What is The Next Opportunity on BTCUSD Market
how to Enter to the Valid Entry With Assurance Profit?
This Video is For Trader's that Want to Improve Their Technical Analysis Skills and Their Trading By Understanding How To Analyze The Market Using Multiple Timeframes and Understanding The Bigger Picture on the Charts.
Disclaimer: Financial Trading Has Large Potential Rewards, But Also Large Potential Risk. You must be aware of the Risk and Be Welling to Accept Them in order to Trade the Financial Market . Please be Carefully With Your Money.
We are talking about future market, anything can Happen,Markets are Always like that.dnt Risky more Than 2% of your account
Now you can join with our "vip premium" service
Join us and let's make trading together

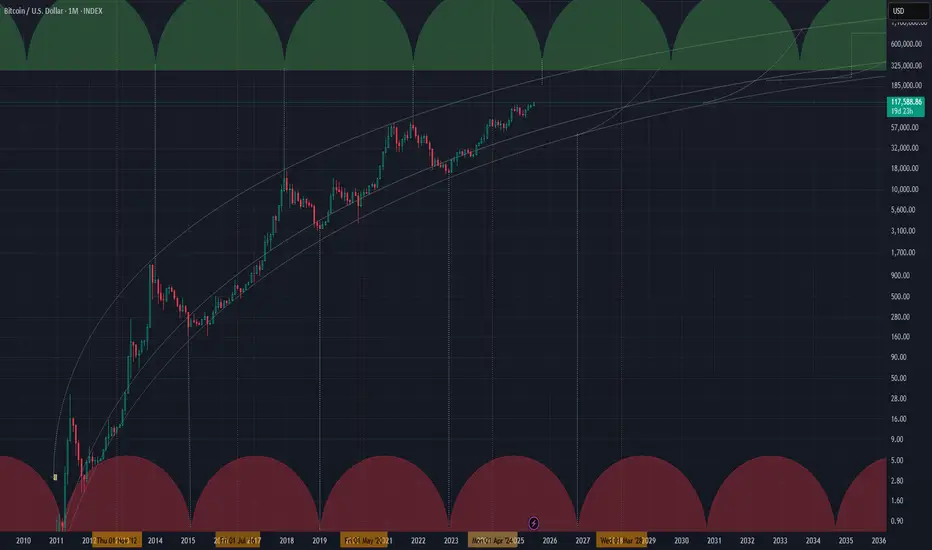
Cycle time tool sugesting topping prices around October 2025 As expected in previous analysis this idea support my thesis for topping close to October. i will be unloading soon to buy back around November 2026. Cheers!
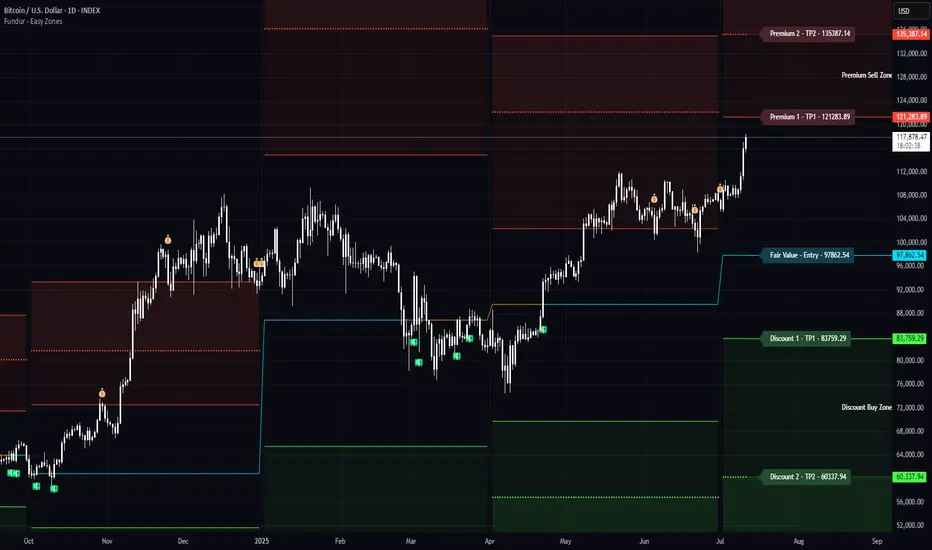
Bitcoin Breaks Above Prior Highs - What to ExpectFollow-Up Context:
As published previously, long positions were initiated around the $100,000–$102,000 support zone (green fair-value band & 200 DMA).
Current Outlook & Targets:
Quarterly Premium 1 (Q-P1) at $121,283 – first profit-taking objective.
Quarterly Premium 2 (Q-P2) at $135,387 – secondary bullish target if Q-P1 flips to support.
Key Levels Recap:
Support Held: $100 k–$102 k (fair-value confluence)
Liquidity Sweep: brief wick below to capture shorts before rapid reclaim.
No new entry is suggested here – we’re tracking progress toward the listed premium zones.
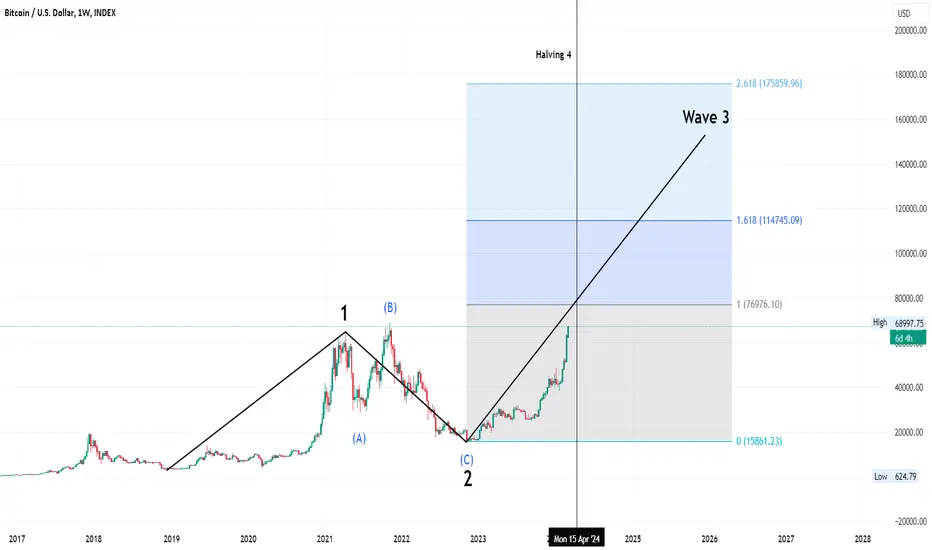
Wave 3Friends,
This wave is much too big to be some kind of first wave!
Technical Section:
What we have:
- The rise from 2019 to 2021 was Wave 1.
- Wave 2 is an expanded flat.
What we don't have:
- Wave 3 = either 1.62 x length of wave 1
or
2.62 x length of wave 1
or
4.25 x length of wave 1
Heavy resistance around $115,000Is it just me thinking we are at the top now? I dont see how we can penetrate this trendline . Your thoughts?
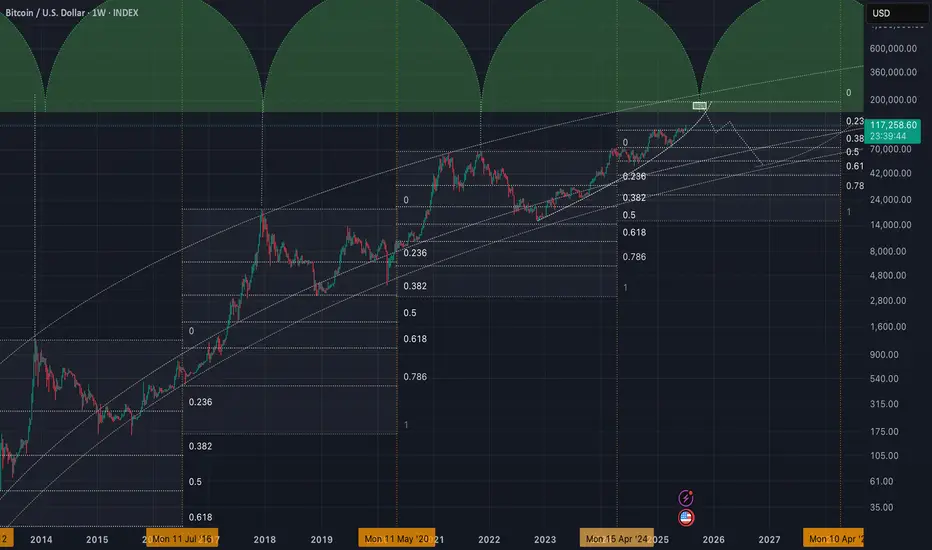
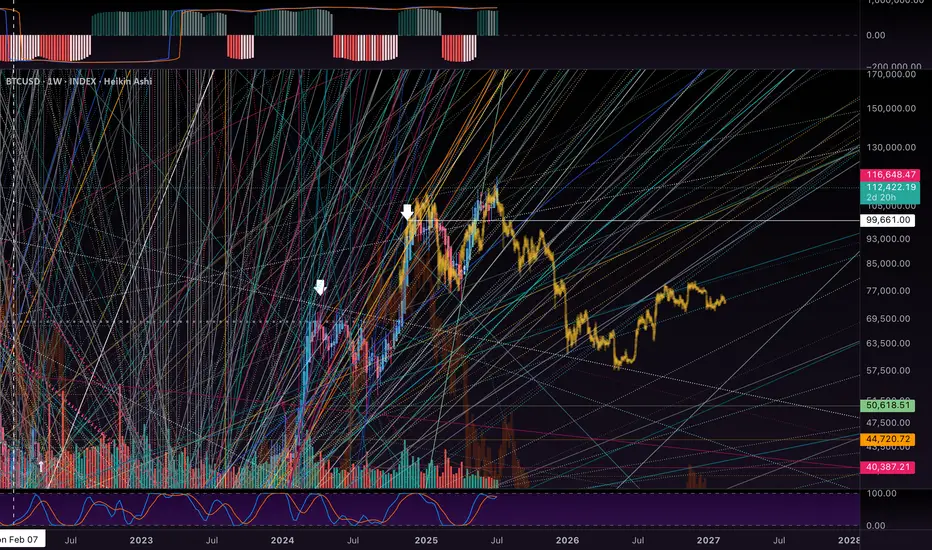
Next top and bottomI exposing more future details. Dont be like the maxis and make sure to take some profits around October. Buy back around Nov 2026 to stack more sats for the long run
Close to 200k is doable for this cycle!I don't like to bet on targets, I prefer taking profits around October 2025 as I mentioned multiple times. But this idea about topping around 194k is doable according to fib levels. Either way I am going to step out around October no matter the price, even if its bellow 100k.
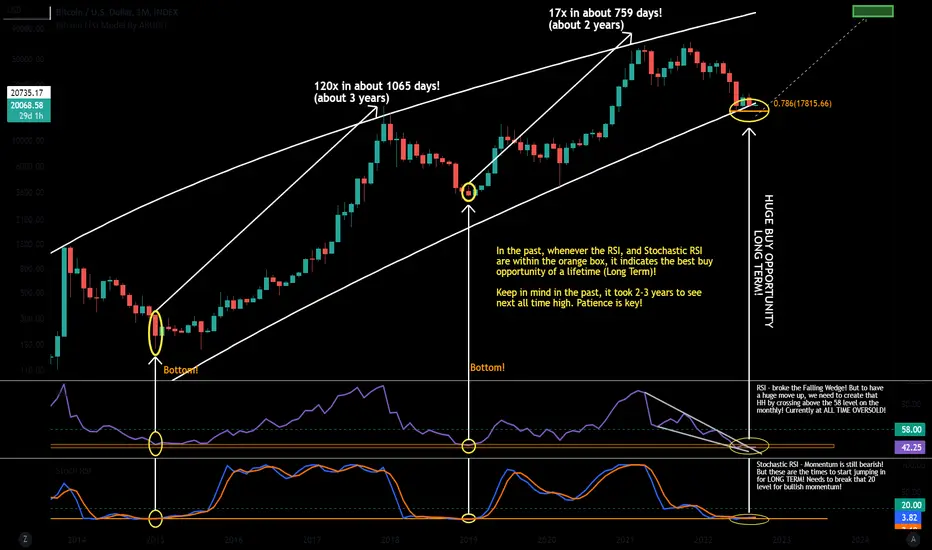
Bitcoin - Historical oversold on the monthly at Extreme Fear!BTC - Monthly chart! Majority buys the hype "Extreme Greed" and gets REKT. For me, I love buying the "Extreme Fear" on multiple timeframes.
Whales/elites will not miss any opportunities into making money. They simply buy the fear, hype up the market, take profit and crash it again after taking profit. Instead of beating then, lets ride with them! ;)
Majority got Rekt last year due to listening to the "Bullish" Narratives the media and Social Media Influencers were portraying last year! Stop listening to them and start paying attention to the technicals.
Before reading, get rid of your moonboy mentality and no emotions for dips/corrections! Cannot rule bearish scenarios! Dips are for buying!!
People are so focused on the hourly/daily timeframe that they get emotional on every dip! Take a step back to the weekly/monthly timeframe and see why I'm so bullish now. Stop looking at the short-term dips/rise. Short term is irrelevant for the move that is coming!
You can't be emotional in these markets (stocks, forex, crypto, real estate, etc.). You will lose this game following the news and doing what the majority does. News creates emotions. Everything you need to know are on the charts. News is manipulated by the elites, and they take advantage of our emotions. Stop listening to the news and pay more attention to the charts. Don't follow the majority, because the majority will lose in the end! Also, don't buy the hype when everyone is buying.. instead buy the fear when everyone else is selling
Everything is on the chart! Cryptocurrencies are on the verge of exploding higher. Dips/Corrections are normal and needed in a bull market and are buying opportunities! Huge gains opportunity in the coming months! Never trade blindly. Use multiple indicators to make calculated decisions. Trade with no emotions!
Facts:
The Best Opportunity is when the RSI and Stochastic RSI are in between the Orange Box and the Fear and Greed index is at "Extreme Fear"!
"If you can't beat the fear, do it scared!"
"Be fearful when others are greedy, and greedy when others are fearful!" - Warren Buffet.
"Markets are a device for transferring money from the impatient to the patient. - Warren Buffet
"Show me the charts, and I'll tell you the news." - Bernard Baruch
"The secret to investing/trading is figuring out how rich you want to be and how poor you're willing to become."
"If you want to live like the 5% of the population who are hugely successful, then don't act like the 95%!"
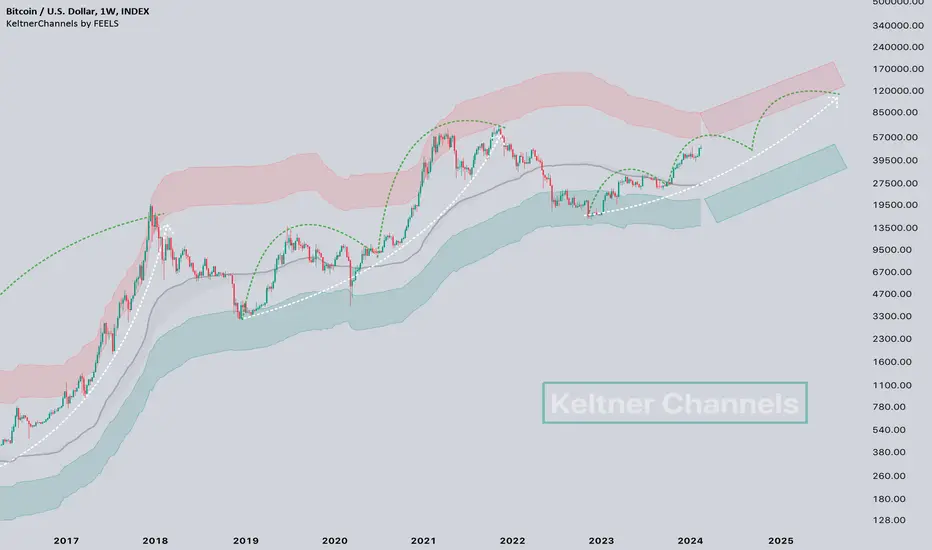
Are we in for a 3-wave cycle in BTC? 👀#Bitcoin Keltner Channels 📈
The current BTC cycle is often compared to the cycle of 2020 or 2016. Well, let's consider what if this cycle is different.
In the first cycle, we did not have substantive and protracted corrections. The second cycle had a more pronounced mid-cycle peak, and a longer consolidation after it, and even then the 2nd wave of movement.
The current cycle can have a 3-wave movement. What does this indicate?
💡For example, if now the ETF inflow continues to be positive, and in a month everyone will understand that the halving is very soon, this may lead to the fact that there will be no substantial corrections for another 2-3 months.
📝The third wave will begin already after a decrease in sales from miners and an increase in liquidity from lowering interest rates and infusions into the economy.
BTC Peak forecastedHI,
This is the weekly candle on BTC… showing in orange, a likely topping fractal, which would also likely propagate into something more like the dark orange, as we seek historic resistance levels to test for support.
As an interesting side note… i see DOGE coin as showing increasing strong bullish signals, which could indicate we are in the much prophecized decoupling of the DOGE-BTC pair… which will be a spectacular transfer of wealth from the dying giant to the intrepid coin of unconditional love! Thats what Dog’s represent… and it’s how the tribe feels about their coin too.
Biggest pump and dump of all time… the crypto geeks Pump btc, get the military dark money to buy in, and then dump it… empty bag. And where are they moving their money too? The favorite alt coins… and DOGE moves the biggest and fastest when it jumps and runs!
Good Luck!
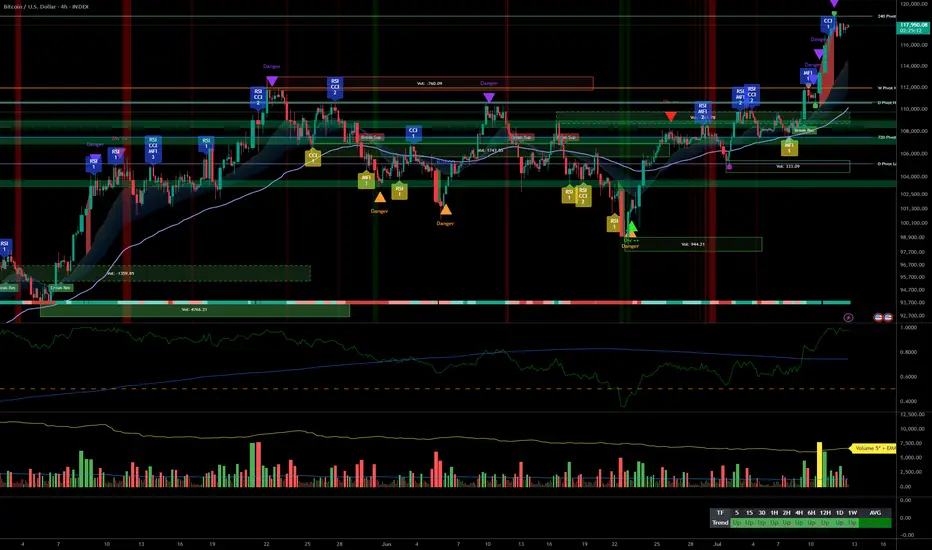
Bitcoin facing breakout, active management recommended__________________________________________________________________________________
Technical Overview – Summary Points
Strong bullish momentum across all timeframes (MTFTI “Strong Up”).
Key supports: 110,483–111,949. Major resistances: 118,689–119,499.
Volumes normal to slightly elevated. No anomaly or climax.
Behaviour: early caution signals on ISPD DIV (4H–2H), sector “sell” trigger on the Risk On / Risk Off Indicator (15min).
__________________________________________________________________________________
Strategic Summary
Overall bullish bias on all timeframes. Structural uptrend confirmed, but early behavioural/sector divergence at short term.
Buy zones: pullback to 110,483–111,949. Stop/alert below 110,483 H4/H6 close.
Opportunities: tight trailing above 118,689 to capture extension. Partial take profit advised in upper range (118,689–119,499) if divergences persist.
Risks: geopolitical risk-off catalysts, start of selling extension, or loss of support.
Plan: active management required, avoid overexposure, plan for key break levels, readiness to exploit imminent breakout.
__________________________________________________________________________________
Multi-Timeframe Analysis
1D : Price above all pivots, strong momentum. Key resistance in play (119,499), supports at 110,483/105,054. Volumes normal, bullish alignment.
12H : Confluence of resistances (119,499–115,495), structure intact, buy opportunity on retrace. No major alert.
6H : Strong buying extension, pure momentum. No excess signals.
4H : First divergence (ISPD DIV “sell”). Consolidation on resistance, consider partial profit-taking.
2H : Bullish momentum but ISPD DIV “sell” and moderately high volumes. Localized euphoria risk.
1H : No excess, post-breakout consolidation.
30min : Extreme consolidation, decelerating volumes, possible fatigue.
15min : Sector “sell” trigger (Risk On / Risk Off Indicator “Sell”). Trend remains up, but caution is advised.
Multi-tf summary:
Bullish alignment across all horizons. Short-term behavioural caution, but trend remains unchallenged as long as above 110,483–111,949.
__________________________________________________________________________________
Synthesis & Strategic Bias
Multi-timeframe momentum confirmed, watch supports at 110,483–111,949.
Buy on valid retrace, take profit at highs if behaviour diverges.
Break below 110,483 (H4/H6 close) = invalidation signal.
Key triggers: geopolitical news, broken supports, selling spikes.
Base scenario: likely imminent directional breakout (volatility). Watch for spikes on major headlines.
__________________________________________________________________________________
Fundamentals and Macro News
Uncertain backdrop (Fed, US inflation, bonds & FX), no major macro trigger in 48h but latent volatility.
Crypto: Bitcoin stable, general accumulation, no violent distribution detected.
Geopolitics: rising tensions (Iran, Ukraine). Can prompt sharp risk-off if escalation occurs.
No major macroeconomic event scheduled (empty calendar).
__________________________________________________________________________________
On-chain Analysis
Accumulation phase for all holders, >19k BTC/month absorbed. Extreme volatility compression (coiling).
Realized & implied volatility is exceptionally low, setting up violent move.
ETF (IBIT BlackRock): record accumulation. Downside break could trigger psychological stress.
Baseline: technical & on-chain setup disfavors bears. Any exogenous shock accelerates volatility.
__________________________________________________________________________________
Strategic Recap & Action Plan
Bullish bias validated, risk of market fatigue on short-term signals.
Buy on controlled pullback, tight trailing at highs, partial profit-taking in 118,689–119,499 band.
Swing stop below 110,000 (H4); total invalidation if daily support fails.
Expect directional move + volatility on next impulse (8–48h).
__________________________________________________________________________________
Conclusion
BTC remains in a primary bullish trend, supported by on-chain accumulation and extreme structural compression. Only active management (profit, leverage, stops) optimizes R/R and prepares to respond to an imminent, directional volatility event. Stay proactive and plan!
__________________________________________________________________________________
BTC & ALTCOINS, 4 charts in favor of the bull runIn the columns of TradingView, we have regularly offered you technical and fundamental monitoring of the fundamental uptrend in the bitcoin price. The latter has been supported by its positive correlation with the equity market (new all-time high for the S&P 500 and new all-time high for the MSCI World index for the global equity market), its negative correlation with the trend in the US dollar (DXY) and market interest rates, and finally its positive correlation with the trend in M2 global liquidity. On this subject of global M2 liquidity and BTC, I invite you to reread the analysis below by clicking on the chart.
Four charts currently favor a continuation of the uptrend in the bitcoin price, as well as in altcoins if and only if favorable signals of relative strength are given.
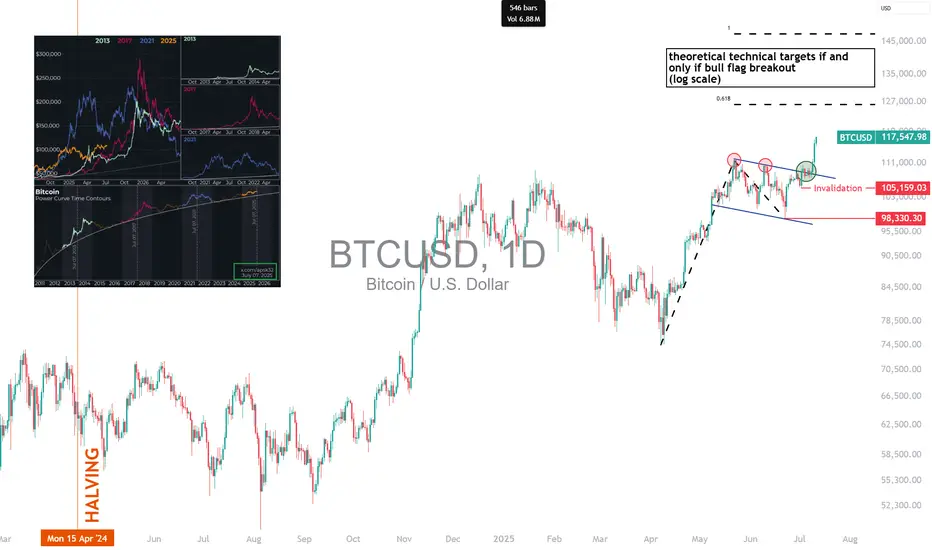
1) Bullish resolution of a bullish flag pattern on the daily BTC price
The chart below shows the daily Japanese candlestick pattern on the bitcoin price. The market has achieved a technical breakout of a bull flag configuration, a technical pattern found in the list of bullish continuation formations. The technical target for this pattern is $125/130K, and the bullish invalidation threshold is below support at $105K.
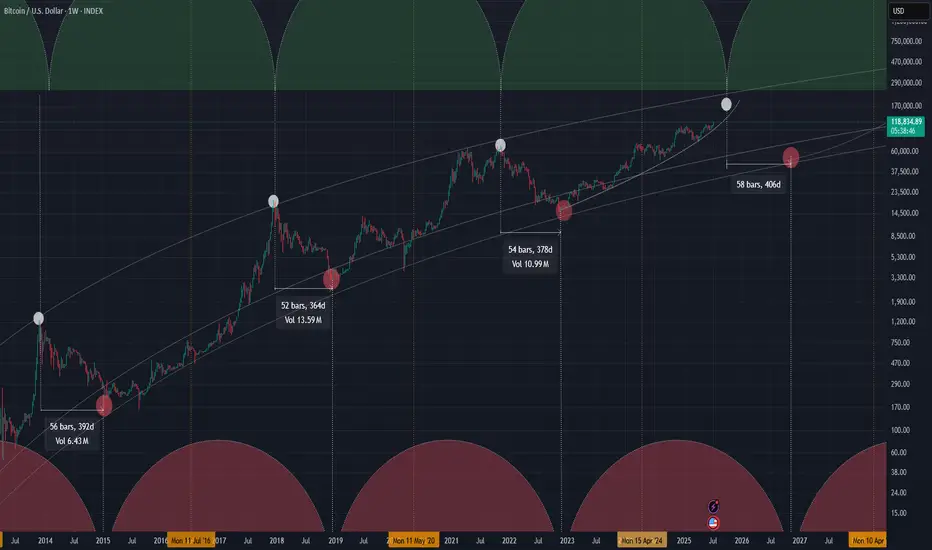
2) Cycle repetition on a calendar basis from the last year of the bull run
Bitcoin's bullish cycle linked to the spring 2024 halving ends at the end of 2025. When comparing cycles, it's interesting to note that from the end of July onwards, there's a bullish technical confluence of the three previous cycles for their fourth and final cycle year (Bitcoin follows a 4-year cycle as a reminder, structured around the four-year halving). If our current cycle aligns with the average of past cycles, then the price of bitcoin could trend towards US$150,000 by the end of 2025.
3) Bitcoin's dominance chart is validating a bearish divergence in weekly data
This is a long-awaited signal from the crypto investment community, namely the day when bitcoin's dominance will recede to make way for better relative behavior from altcoins. It's a phenomenon known as “altcoin season”, and it will come about if, and only if, BTC's dominance gives a downward reversal signal. That's why we need to keep a close eye on this potential bearish divergence on BTC dominance.
4) ALTCOINS: there's a potential bullish divergence on the ratio between altcoins (represented by the TOTAL3 index) and BTC
But it's the altcoins/bitcoin ratio that's the best barometer for seeing a potential altcoin season coming. This ratio is embodied here by the TOTAL3/BTC ratio, and a potential bullish divergence is forming. Should this ratio confirm it by breaking through technical resistance, this would signal the start of the altcoin season.
DISCLAIMER:
This content is intended for individuals who are familiar with financial markets and instruments and is for information purposes only. The presented idea (including market commentary, market data and observations) is not a work product of any research department of Swissquote or its affiliates. This material is intended to highlight market action and does not constitute investment, legal or tax advice. If you are a retail investor or lack experience in trading complex financial products, it is advisable to seek professional advice from licensed advisor before making any financial decisions.
This content is not intended to manipulate the market or encourage any specific financial behavior.
Swissquote makes no representation or warranty as to the quality, completeness, accuracy, comprehensiveness or non-infringement of such content. The views expressed are those of the consultant and are provided for educational purposes only. Any information provided relating to a product or market should not be construed as recommending an investment strategy or transaction. Past performance is not a guarantee of future results.
Swissquote and its employees and representatives shall in no event be held liable for any damages or losses arising directly or indirectly from decisions made on the basis of this content.
The use of any third-party brands or trademarks is for information only and does not imply endorsement by Swissquote, or that the trademark owner has authorised Swissquote to promote its products or services.
Swissquote is the marketing brand for the activities of Swissquote Bank Ltd (Switzerland) regulated by FINMA, Swissquote Capital Markets Limited regulated by CySEC (Cyprus), Swissquote Bank Europe SA (Luxembourg) regulated by the CSSF, Swissquote Ltd (UK) regulated by the FCA, Swissquote Financial Services (Malta) Ltd regulated by the Malta Financial Services Authority, Swissquote MEA Ltd. (UAE) regulated by the Dubai Financial Services Authority, Swissquote Pte Ltd (Singapore) regulated by the Monetary Authority of Singapore, Swissquote Asia Limited (Hong Kong) licensed by the Hong Kong Securities and Futures Commission (SFC) and Swissquote South Africa (Pty) Ltd supervised by the FSCA.
Products and services of Swissquote are only intended for those permitted to receive them under local law.
All investments carry a degree of risk. The risk of loss in trading or holding financial instruments can be substantial. The value of financial instruments, including but not limited to stocks, bonds, cryptocurrencies, and other assets, can fluctuate both upwards and downwards. There is a significant risk of financial loss when buying, selling, holding, staking, or investing in these instruments. SQBE makes no recommendations regarding any specific investment, transaction, or the use of any particular investment strategy.
CFDs are complex instruments and come with a high risk of losing money rapidly due to leverage. The vast majority of retail client accounts suffer capital losses when trading in CFDs. You should consider whether you understand how CFDs work and whether you can afford to take the high risk of losing your money.
Digital Assets are unregulated in most countries and consumer protection rules may not apply. As highly volatile speculative investments, Digital Assets are not suitable for investors without a high-risk tolerance. Make sure you understand each Digital Asset before you trade.
Cryptocurrencies are not considered legal tender in some jurisdictions and are subject to regulatory uncertainties.
The use of Internet-based systems can involve high risks, including, but not limited to, fraud, cyber-attacks, network and communication failures, as well as identity theft and phishing attacks related to crypto-assets.
Deeper Levels For bitcoinI am still waiting for deeper levels on bitcoin before beeing confident in longs.
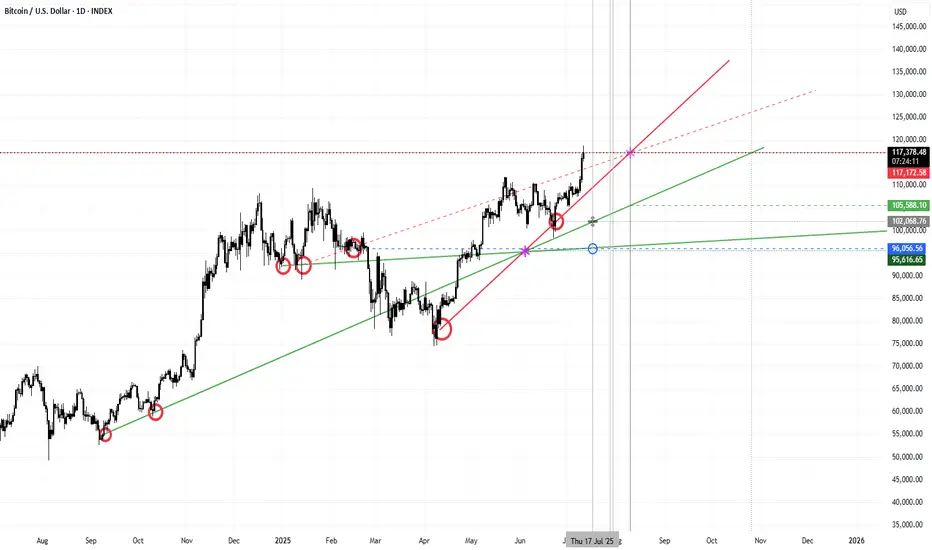
Simple DWEB node trendsThe only 1D trend lines you should need for confluence. Based off DWEB trend nodes. intersections marked for local price action. Only a 1D chart..
Diminishing log returnsThere is no such thing as diminishing log returns. The most basic technical analysis, based on chart shapes disproves it. Only an idiot would attempt to apply it to the most deflationary asset the world has ever seen. Other kinds of curves do exist. There is the bell curve, for instance, where many people find themselves on the wrong side of it. There are all manner of parable and sine waves. Types of waves you've never heard of. But somebody said diminishing log return, and it sounded profound, but wasn't backed up by anything.
My chart attached is your "shrimp" pattern, and we can all see that Bitcoin is breaking out from whatever overhead you imagined. So, I've proven your theory false.
#Bitcoin 3 Phases Theory 🚦Today I saw a headline that surprised me "The current bear market has become the longest in the history of the crypto industry"📰
And I had a question about whether they were living in the past, or where they saw the bear market.🤔
💡I want to remind you that it ended with a duration of exactly one year, just like the last cycle. And it was much shorter than in 2014.
Now CRYPTOCAP:BTC is +70% from the bottom, this is a classic phase of accumulation.

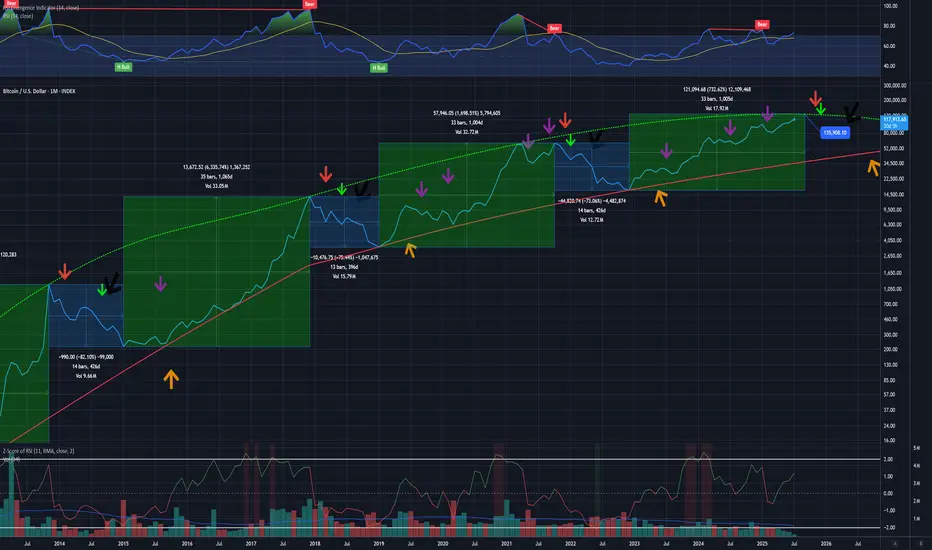
btcusd bull bear when monthly crossing DMAEvery time monthly closes below DMA 200 (Daily moving average) it could be start of bear market but it came out last times there were more fake (lila arrows).
But when it croses DMA 400 then it goes into multi month sell off to DMA 1400
Currently it is close to top and start of next 400 day sell off.
Bull market lasts 1000 days