Watch me make $125 liveafter a brutal night in the markets looking to recoup from the losses I took and regain my momentum before we close the trading week tomorrow.

The best trades require research, then commitment.
Get started for free$0 forever, no credit card needed

Scott "Kidd" PoteetThe unlikely astronaut

Where the world does markets
Join 100 million traders and investors taking the future into their own hands.

BTC POTENTIAL BULLS TRAP IN DEVELOPMENTI am inspecting the 4 hour candle in comparison to the daily chart on BTC and it seem we have all the characteristics of a bulls trap on the chart. If the next 4 hours candle does not close bullish, it will confirm a bulls trap and price will likely pullback into the triangle. So be cautious trading

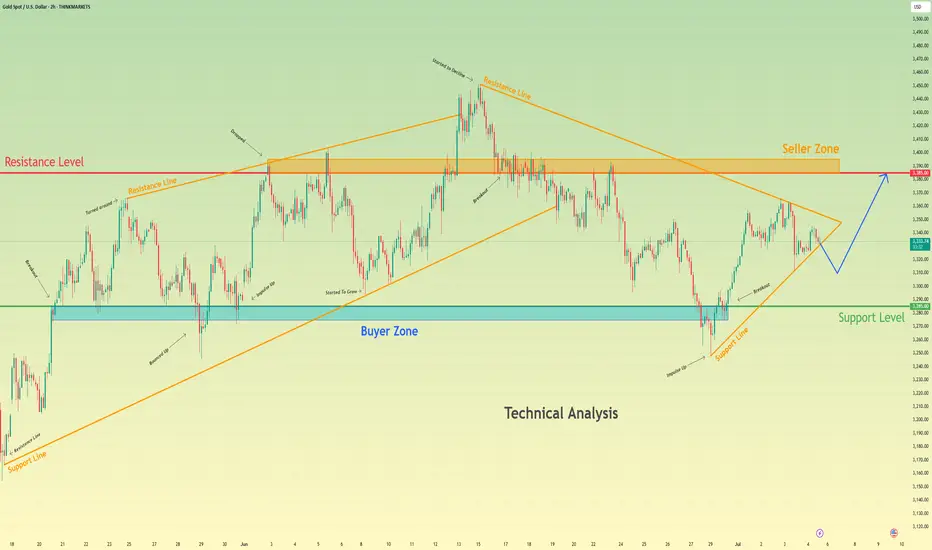
Gold setup: ascending triangle and Trump’s debt bombGold just formed an ascending triangle, and a breakout could send it $300 higher. In this video, we analyse the new pattern, the key breakout level, and why Trump’s new tax bill and Powell’s potential replacement could spark a major move. Will fundamentals match the technicals? Watch to find out.

EURUSD Sell analysis/ideaThis analysis is based on the 4-hour timeframe and executed using reversal trading and trend formation. complete explanation in the video!

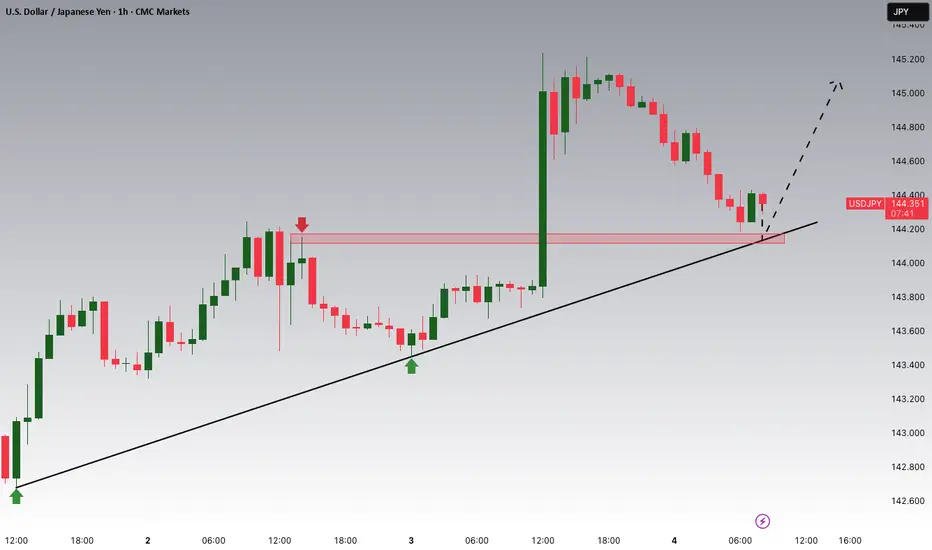
End of Week analysis (USDJPY)Sorry for the late video but we are looking good for another continuation day. we have some strong bullish momentum now to tap into that untapped daily wick. from there we will see some strong resistance.
Happy trading everyone hope everyone had a great week.

July 4 GOLD FIREWORKS!!!Gold bout to POP!!!! and it could be seriously huge! Im just patiently waiting for a area of entry. I have never traded a July 4th Holiday with this much clarity on what I see so this could get interesting.

Valero Breaks the DowntrendValero Energy spent more than a year in a downtrend, but some traders may think conditions have changed.
The first pattern on today’s chart is the series of lower highs between April 2024 and May 2025. VLO pushed above that falling trendline last month and has remained there since. That may suggest

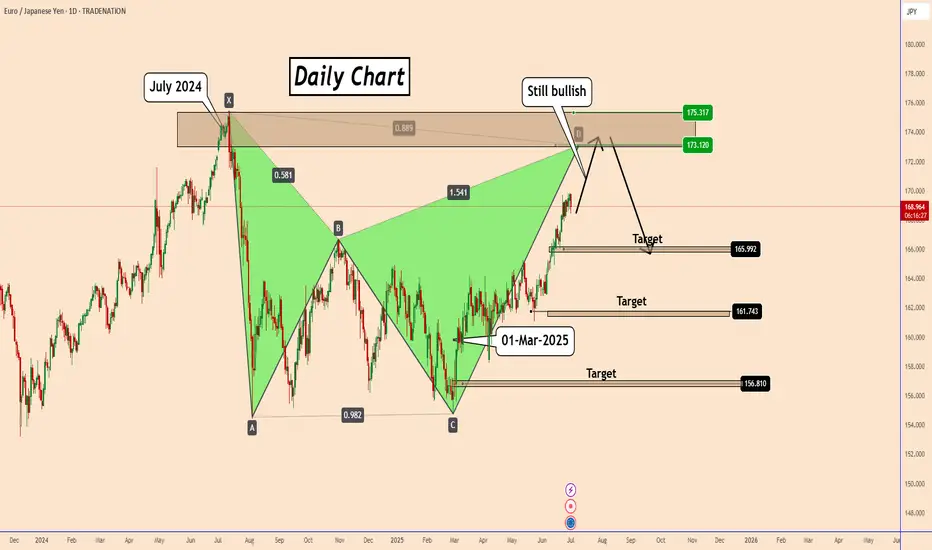
EURJPY is rising to 173 for a bearish and larger pattern.EURJPY is rising to 173 for a bearish and larger pattern.
Since the beginning of March 2025, EURJPY started an uptrend and is still rising in a clear way with no signs of reversal.
As long as the BOJ has no plans to change its monetary policy statement or make any significant interventions in For
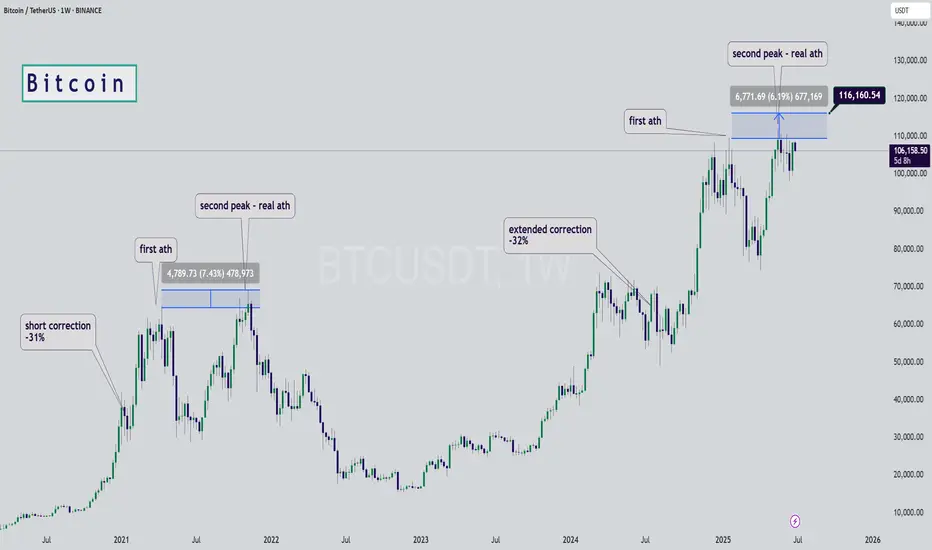
Bitcoin Fractal, increase to $116k Hi Everyone☕👋
BINANCE:BTCUSDT
Been such a long time since I posted. Today I'm looking at BTCUSDT, and I'm looking at the previous all time high cycle and what we were seeing (the pattern aka fractal).
Here's why we're likely going a little higher.
First correction of -32%
Followed by f
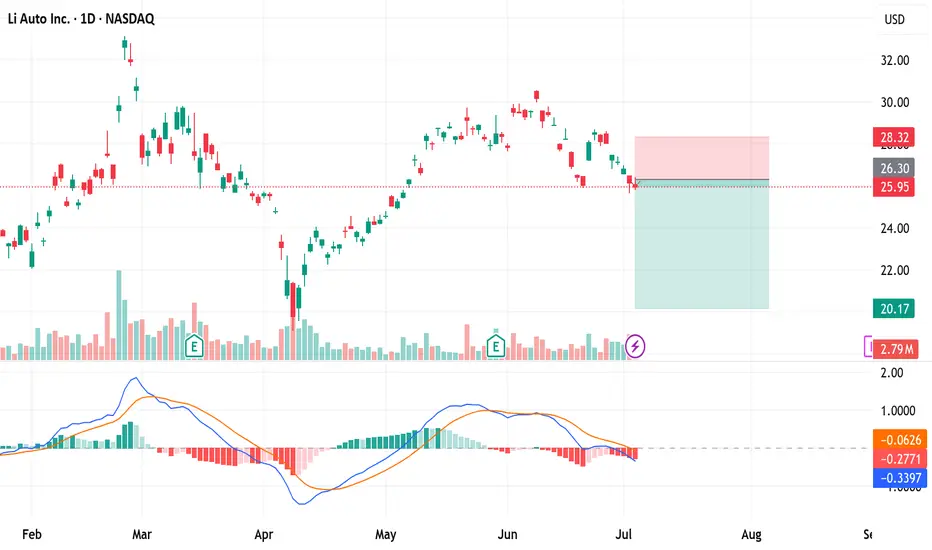
The market bias stays up, MJ stocks may be a buy here. The market continues to be biased up, and the target is likely the weekly B. MJ stocks are showing technical signs that a reversal may come. There may be other sectors similar as I think the summer bottom gamblers will start appearing now that everything else is at the highs. Gold looks like it will

See all editors' picks ideas
True Close – Institutional Trading Sessions (Zeiierman)█ Overview
True Close – Institutional Trading Sessions (Zeiierman) is a professional-grade session mapping tool designed to help traders align with how institutions perceive the market’s true close. Unlike the textbook “daily close” used by retail traders, institutional desks often anchor their

Open Interest Footprint IQ [TradingIQ]Hello Traders!
Th e Open Interest Footprint IQ indicator is an advanced visualization tool designed for cryptocurrency markets. It provides a granular, real-time breakdown of open interest changes across different price levels, allowing traders to see how aggressive market participation is distribu

Zigzag CandlesCan't deny that I am obsessed with zigzags. Been doing some crazy experiments with it and have many more in pipeline. I believe zigzag can be used to derive better trend following methods. Here is an attempt to visualize zigzag as candlesticks. Next steps probably to derive moving average, atr (alth

MathStatisticsKernelFunctionsLibrary "MathStatisticsKernelFunctions"
TODO: add library description here
uniform(distance, bandwidth) Uniform kernel.
Parameters:
distance : float, distance to kernel origin.
bandwidth : float, default=1.0, bandwidth limiter to weight the kernel.
Returns: float.
triangular(distance

MathConstantsLibrary "MathConstants"
Mathematical Constants
E() The number e
Log2E() The number log (e)
Log10E() The number log (e)
Ln2() The number log (2)
Ln10() The number log (10)
LnPi() The number log (pi)
Ln2PiOver2() The number log (2*pi)/2
InvE() The number 1/e
SqrtE() The n

taLibrary "ta"
█ OVERVIEW
This library holds technical analysis functions calculating values for which no Pine built-in exists.
Look first. Then leap.
█ FUNCTIONS
cagr(entryTime, entryPrice, exitTime, exitPrice)
It calculates the "Compound Annual Growth Rate" between two points i

Tape [LucF]█ OVERVIEW
This script prints an ersatz of a trading console's "tape" section to the right of your chart. It displays the time, price and volume of each update of the chart's feed. It also calculates volume delta for the bar. As it calculates from realtime information, it will not display info

Dominance Pie ChartA different type of charting, the pie chart,
here for showing the available dominance on one chart,
together with the total % dominance per ticker and between brackets
the % rise/fall.
Can be used in every timeframe
(It is normal it takes some time to be loaded)
Cheers!

Circular Candlestick ChartAn original (but impractical) way to represent a candlestick chart using circles arc.
The most recent candles are further away from the circle origin. Note that OHLC values follow a clockwise direction. A higher arc length would indicate candles with a higher body or wick range.
The Length setti

Color█ OVERVIEW
This library is a Pine Script® programming tool for advanced color processing. It provides a comprehensive set of functions for specifying and analyzing colors in various color spaces, mixing and manipulating colors, calculating custom gradients and schemes, detecting contrast, and con

See all indicators and strategies
Community trends
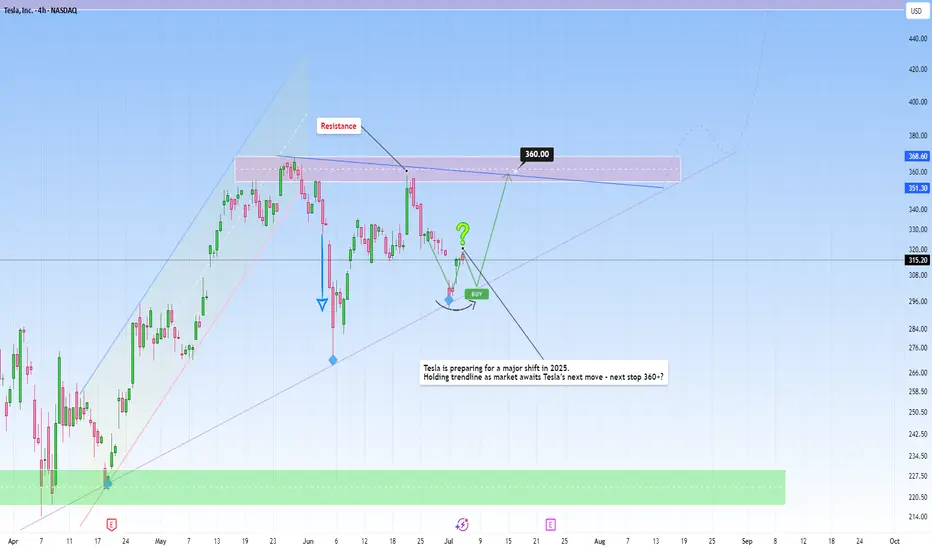
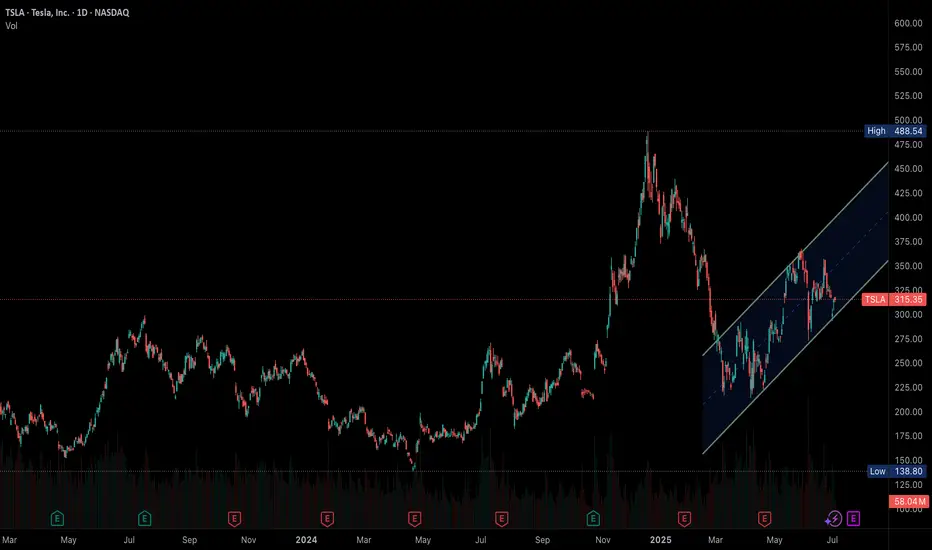
Big Bounce or Breakdown? Tesla at the edgeTesla is at crossroads right now, where the next move will define its near-term trajectory.
After an extended correction phase, TSLA is reaching a key zone around the $300 level, one that held price well during recent pullbacks.
Although recent tax news caused a decline in the price, belief in Tesl
Adobe - A gigantic triangle breakout! 🔋Adobe ( NASDAQ:ADBE ) will break the triangle:
🔎Analysis summary:
Yes, for the past five years Adobe has been overall consolidating. But this consolidation was governed by a strong symmetrical triangle pattern. Thus following the underlying uptrend, there is already a higher chance that we w

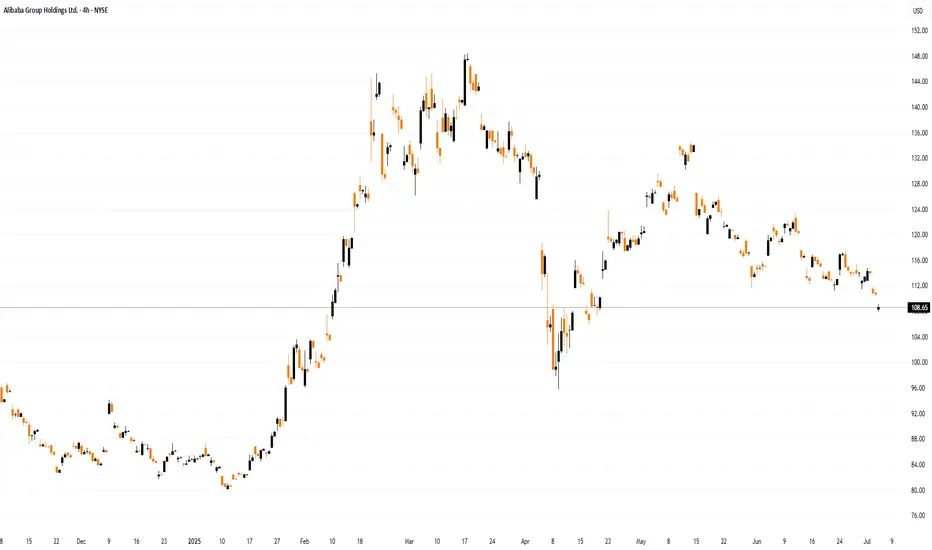
Alibaba (BABA) Shares Fall to Lowest Level in 2.5 MonthsAlibaba (BABA) Shares Fall to Lowest Level in 2.5 Months
Yesterday, Alibaba (BABA) shares dropped to their lowest level since late April. The decline followed the company’s announcement of a planned bond issuance totalling approximately $1.53 billion, with a maturity date set for 2032. The funds w
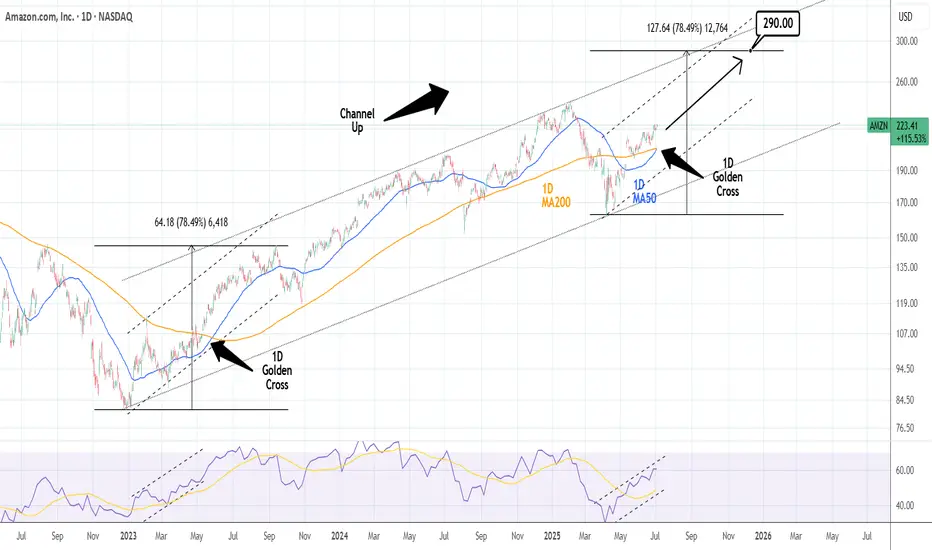
APPLE: 1st 1D Golden Cross in 2 years just formed.Apple is bullish on its 1D technical outlook (RSI = 67.490, MACD = 1.760, ADX = 17.850) and yesterday it started forming the first 1D Golden Cross in more than 2 years. This signals the extension of the 2nd major bullish wave of the 3 year Channel Up. The previous one made an incredible extensino to
Could TSLA rebound after a weaker decrease than expected deliverTesla Q2 2025 Delivery fell, but could it rebound in 2H?
Key Figures
Q2 2025 Deliveries: 384,122 vehicles
Year-over-Year Change: Down approximately 13–14% from Q2 2024
Wall Street Expectations: Around 385,000–387,000 vehicles
Production vs. Deliveries: 410,244 vehicles produced, indicating a
$BULL from $HOOD charting for maximum gains. 50$ reclaim this is a great risk to take here and i beleive can benefit alot of beginner traders to increase there first bag!
bag dad

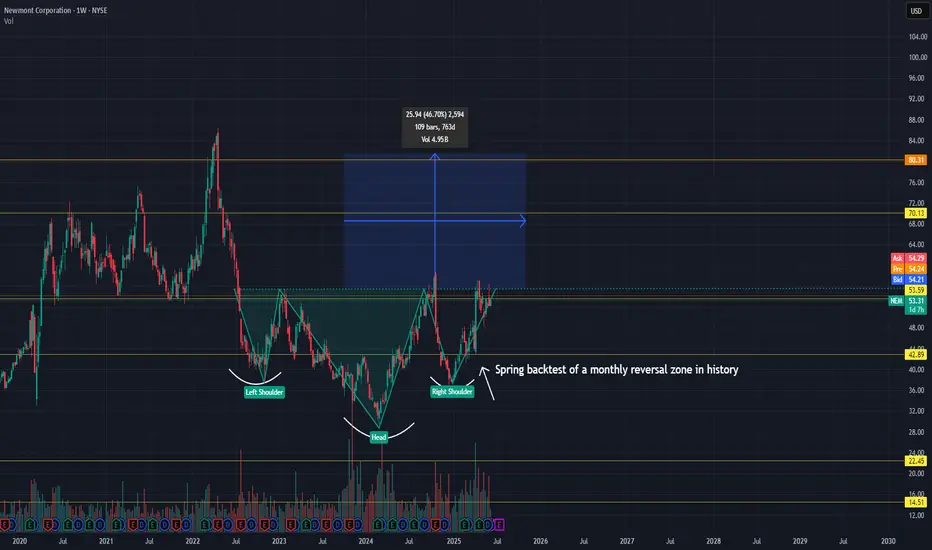
Newmont showing an extremely positive outlookSome notes which can be used as arguments to the bullish outlook:
The stock is above the 200D and even the 200W EMA.
Large inverted head and shoulders structure which presents an opportunity leading up to 80$ which also turns out to be the resistance level tested in 1987 and 2022.
Locally looks
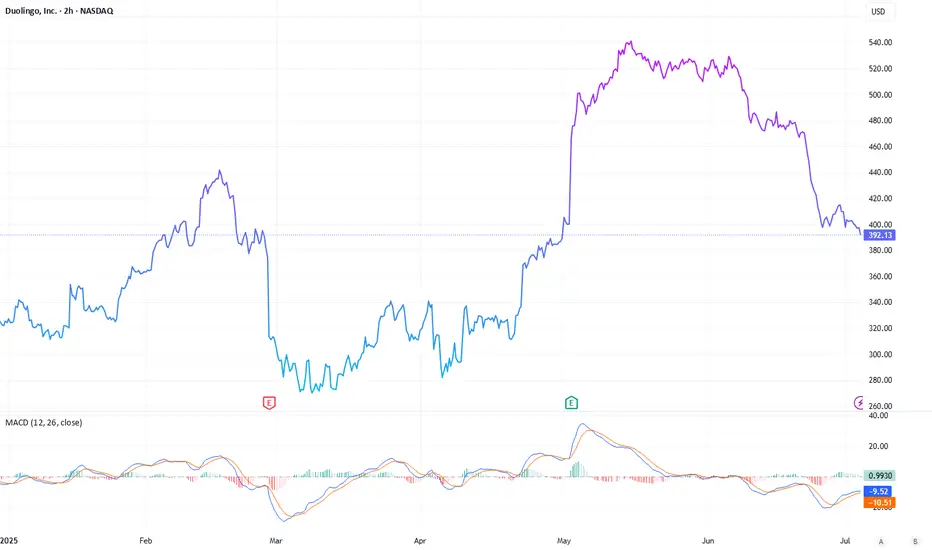
Duolingo’s Language Learning Boom: A Profitable EdTech PlayDuolingo, the language-learning app that took the world by storm, has evolved from a free tool into a powerhouse since its 2021 IPO. With a market cap nearing $11 billion and its stock quadrupling in value, the company stands out as a rare profitable player in the edtech space. But what fuels its su
short this this time might little time to drop but it will short this this time might little time to drop but it will
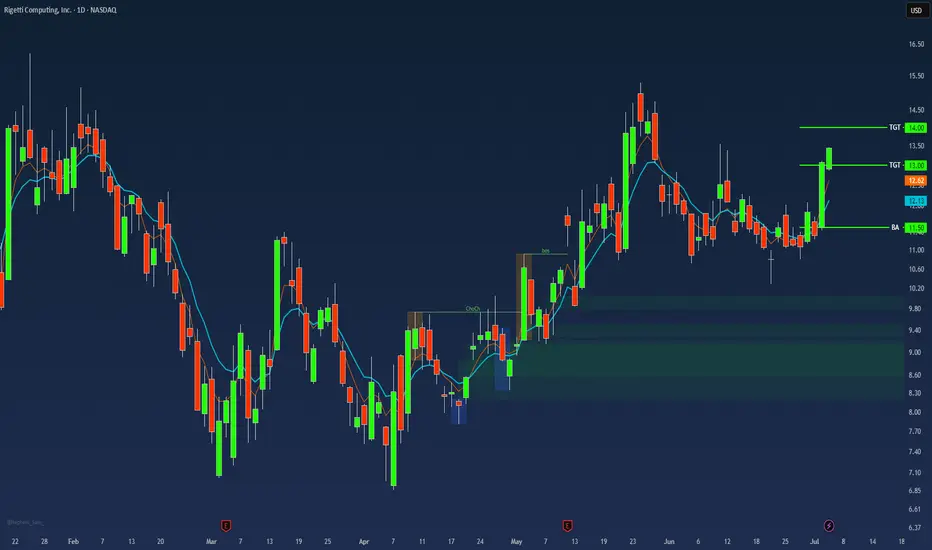
$RGTI Swing Trade Call Debit SpreadNASDAQ:RGTI
Buy to Open (BTO) 6/30/25 3:57pm Jul18 CDS 13/14, Paid 0.19.
Sell to Close (STC) 7/3/25 9:31am Jul18 CDS 13/14 0.38, Paid 0.19, 100 % ROI
I'm looking to Roll trade if possible.
See all stocks ideas
Jul 7
KALVKalVista Pharmaceuticals, Inc.
Actual
—
Estimate
−0.84
USD
Jul 7
FNGRFingerMotion, Inc.
Actual
—
Estimate
—
Jul 7
PKEPark Aerospace Corp.
Actual
—
Estimate
—
Jul 7
BNEDBarnes & Noble Education, Inc
Actual
—
Estimate
−0.81
USD
Jul 8
KRUSKura Sushi USA, Inc.
Actual
—
Estimate
−0.01
USD
Jul 8
P
PENGPenguin Solutions, Inc.
Actual
—
Estimate
0.32
USD
Jul 8
AEHRAehr Test Systems
Actual
—
Estimate
−0.02
USD
Jul 9
ANGOAngioDynamics, Inc.
Actual
—
Estimate
−0.12
USD
See more events
Community trends
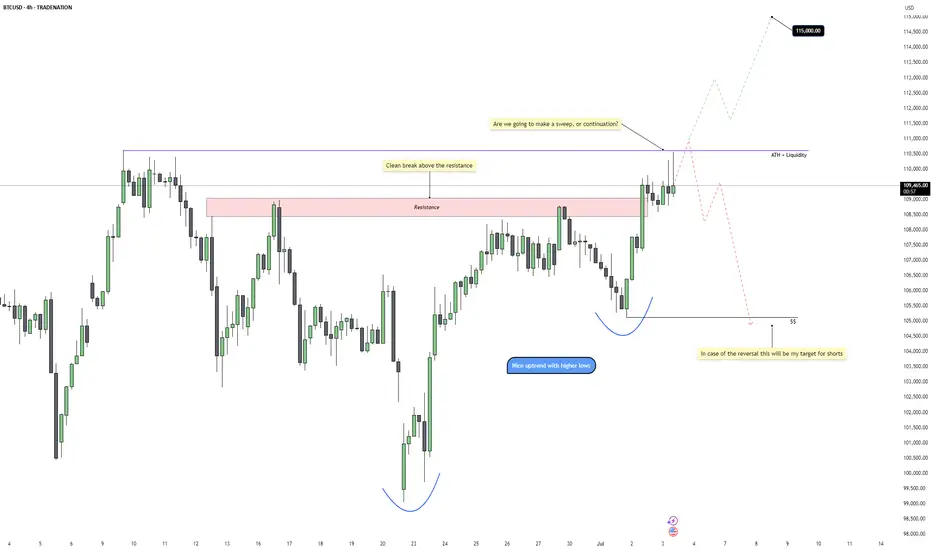
Bitcoin – ATH Sweep or Breakout?Bitcoin is pushing into a critical decision point as it challenges the previous all-time high near 110k. After a strong push out of a rounded bottom formation with clean higher lows, price has now broken above the last visible resistance area and is hovering just under the ATH liquidity. This rally
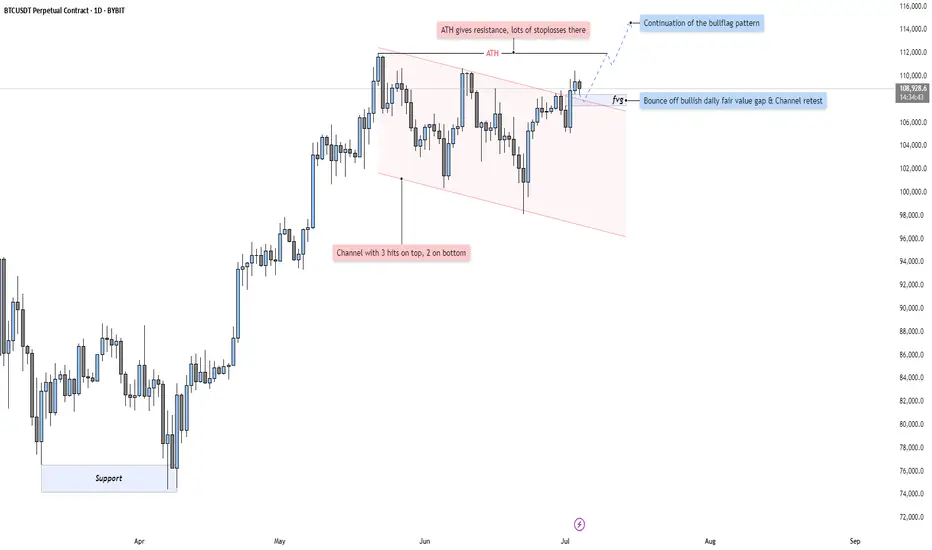
BTC - Bullflag Pattern points to new ATHMarket Context
Bitcoin has been trading within a well-defined descending channel for several weeks now, respecting both upper and lower boundaries with precision (3 touches on the top, 2 on the bottom). This structure suggests an orderly pullback after a strong impulsive leg to the upside in Q2. As
July Altcoin Watchlist Reversal Signals Are Heating UpHi Everyone,
The crypto market is heating up as we step into July, and the tone is shifting. After months of uncertainty, several altcoins are beginning to show early signs of structural reversal, positioning July to potentially emerge as one of the strongest bullish setups we've seen this cycle.
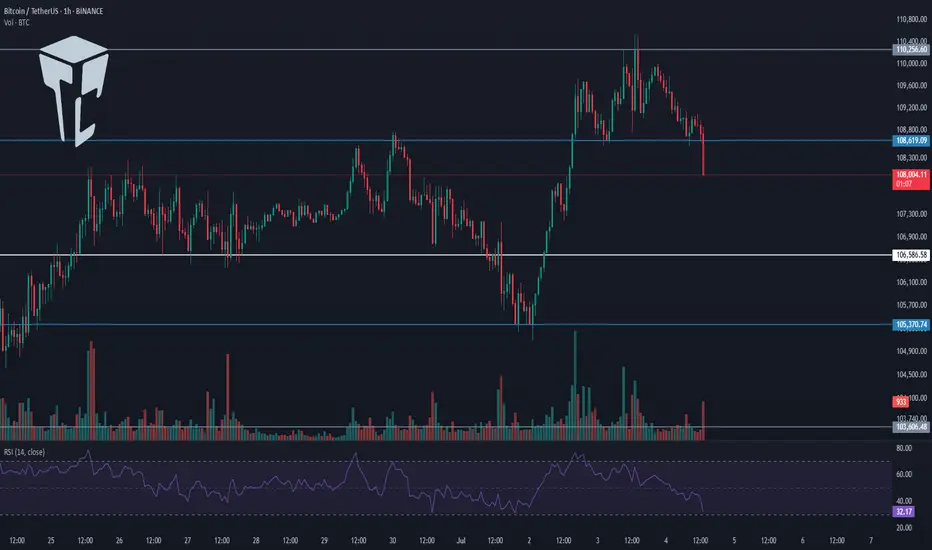
TradeCityPro | Bitcoin Daily Analysis #118👋 Welcome to TradeCity Pro!
Let’s dive into the Bitcoin analysis and key crypto indexes. As usual, in this analysis, I’ll review the futures triggers for the New York session.
⏳ 1-Hour Timeframe
On the 1-hour timeframe, the price remains within the same range box between 108619 and 110256, and it i
Bitcoin - Trust the higher timeframe!⚔️Bitcoin ( CRYPTO:BTCUSD ) is still 100% bullish:
🔎Analysis summary:
For the past couple of months we have been seeing an overall consolidation on Bitcoin. But looking at the higher timeframe, Bitcoin remains in an underlying strong bullrun. Consolidations are always expected and no reason t

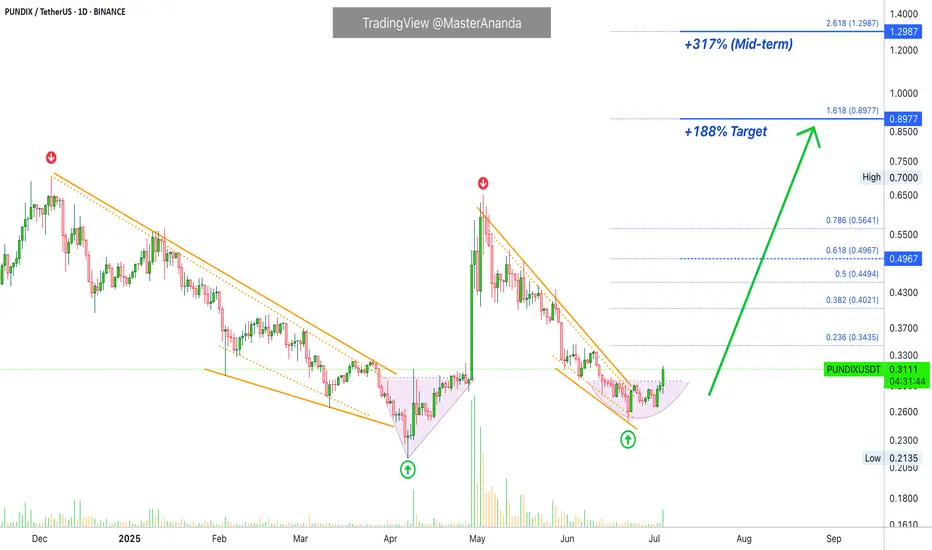
PundiX: Focus on the WinIf you had to choose between a pair that is dropping or set to drop vs one that is rising or set to rise, which one would you choose?
Looking at the chart, the red arrow shows a peak and subsequent drop; the green arrow shows a bottom. The bottom is followed by a rise.
PUNDIXUSDT is now trading wi
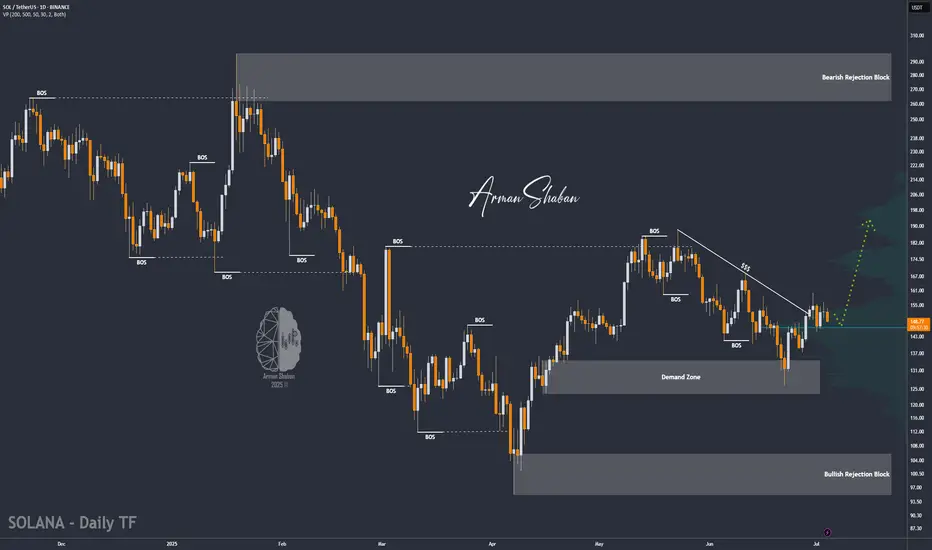
SOL/USDT : Strong Bullish Move Ahead?By analyzing the #Solana chart on the daily timeframe, we can see that the price is currently trading around $149.62. If the price holds above the key level of $146.28, we could expect the beginning of a strong bullish wave, potentially delivering over 25% short-term returns.
If this scenario plays
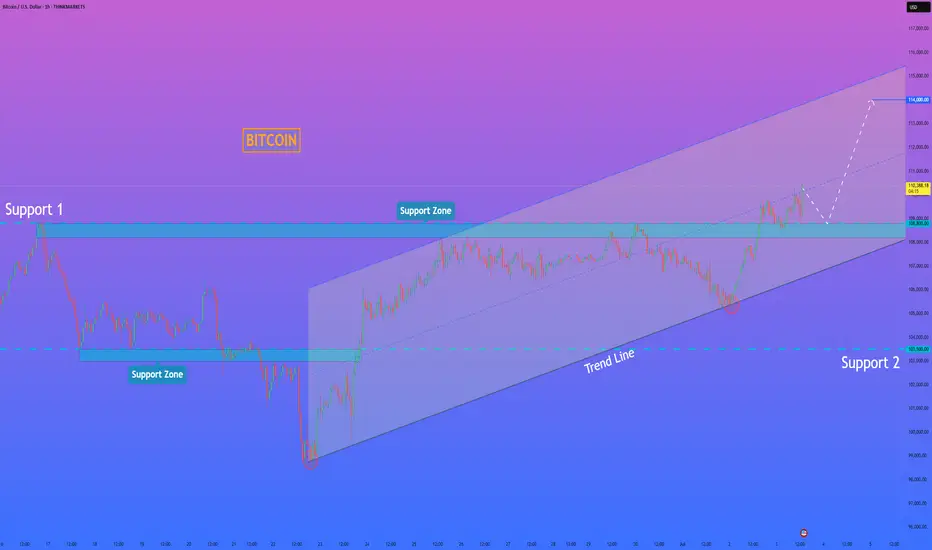
HelenP. I Bitcoin may correct to support level and continue growHi folks today I'm prepared for you Bitcoin analytics. If we look at the chart, the price has formed a clean upward channel after bouncing from the strong support zone at 103500 - 103000 points. This movement marked the beginning of a new bullish phase. Price continued to rise step by step, confirmi
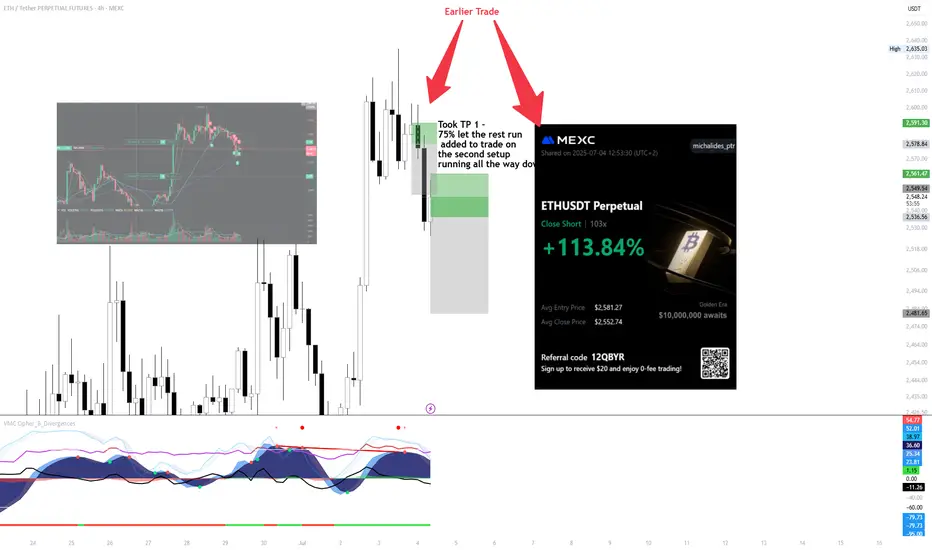
ETH SHORT SCALP ! to 2500
Executed an ETH short from the earlier setup — took 75% profit at TP1, then let the rest run.
Price pulled back into the secondary zone, added to the position with structure confirmation.
Let it roll into the next leg — clean execution, solid momentum follow-through.
+113.84% on the full move, ma
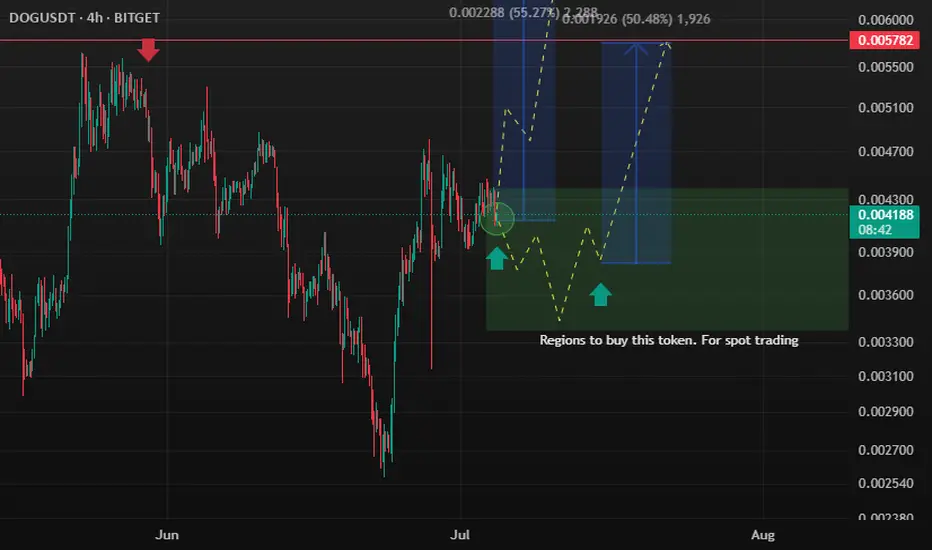
doggusdt (buy position)in tokan moqeiat kharid khobi dard baraye mamaleh geran espat . mantegheh khareed cpeharo moshkhs kardam veba do senario ehtamali robro npastim. cpehmeh chi vi chart moshkhs est niaz bah tozihat ezafeh nemibinam. mofegh bashid pozishen
189 / 5,000
This token is a good buying opportunity for spot tra
See all crypto ideas
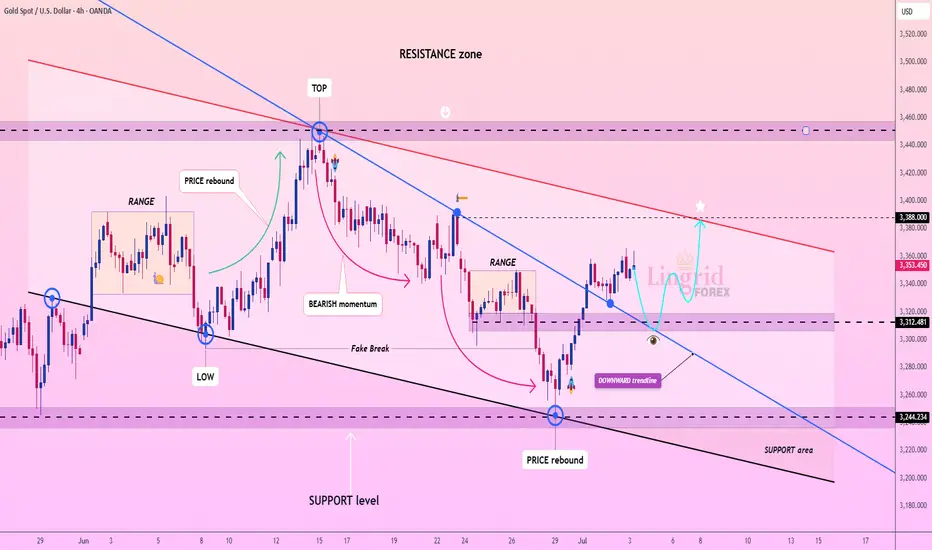
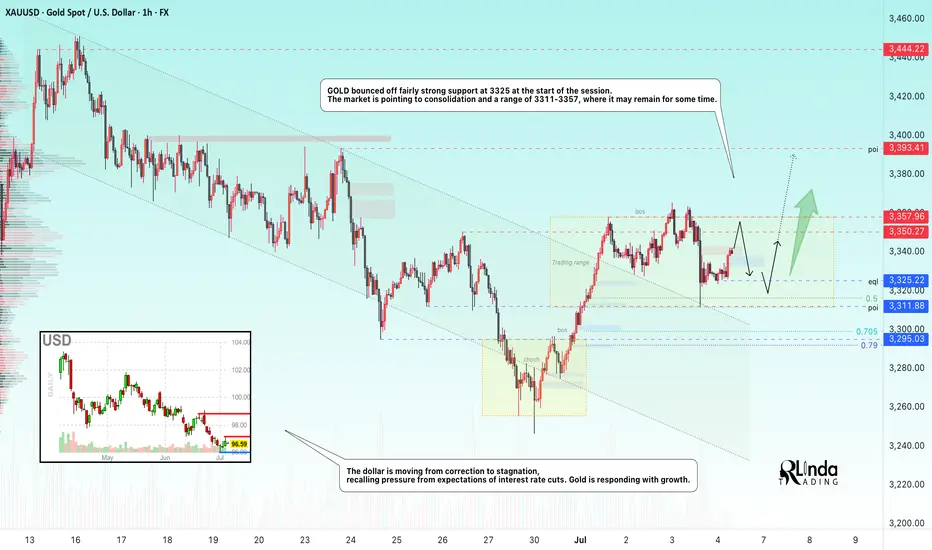
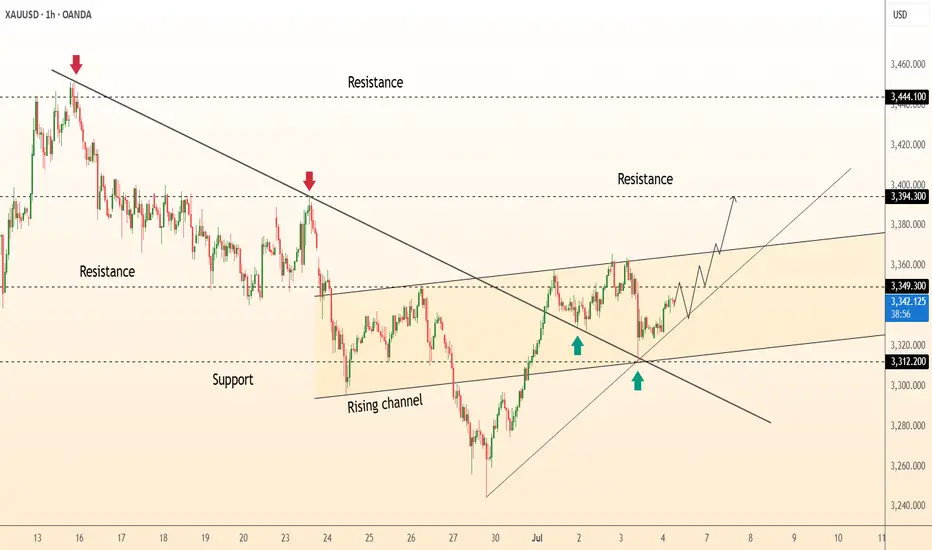
Lingrid | GOLD Pre-NFP Price Action AnalysisThe price perfectly fulfilled my last idea . OANDA:XAUUSD rebounded strongly from the 3244 support area, breaking above the downward trendline and pushing into the mid-resistance band. The price is currently testing 3353 and could pull back slightly before retesting the 3388 key resistance level
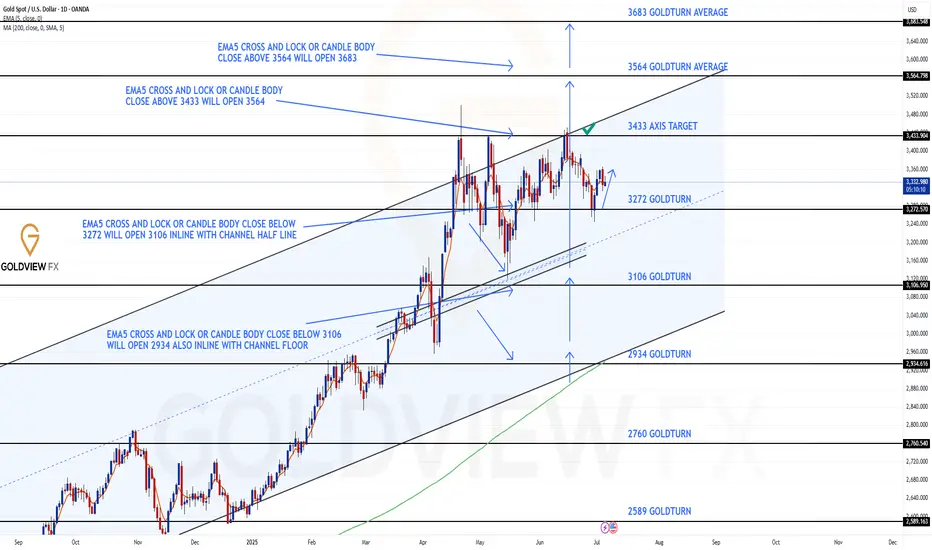
GOLD ROUTE MAP UPDATEHey Everyone,
Great finish to the week!!
We will now finish off with the Daily chart update, after following the 1h and 4h chart throughout the week. This will now remind everyone, how we broke down the overall structure into play.
The bounce scenario off 3272 has now officially played out, just
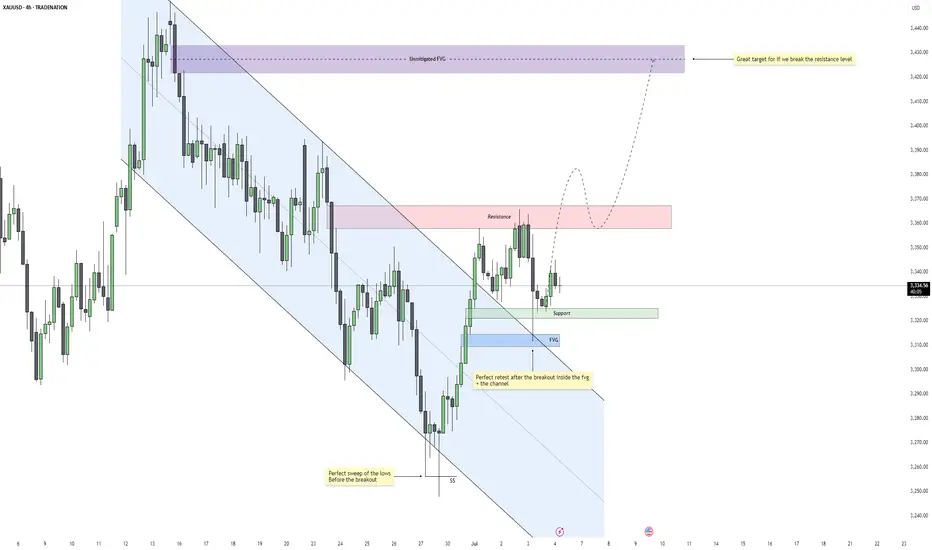
Gold – Is $3430 the Next Target After This Breakout?Gold recently completed a clean sweep of the 4H swing lows, taking out downside liquidity just before breaking out of a well-defined descending channel. This move marked a shift in momentum and structure, suggesting that the bearish leg may have concluded and the market is now transitioning into a m
XAUUSD CHART PATTERN 2\HTrade Setup (Buy Position):
Entry Point: 3330
Target 1: 3380
Target 2: 3420
Stop Loss: 3290
Strategy Insight
You’re targeting a +50 pip move to Target 1 and +90 pip move to Target 2.
Risk is -40 pips from the entry (3330 → 3290).
Risk-Reward Ratio:
To Target 1: 1.25 : 1
To Target 2: 2.25
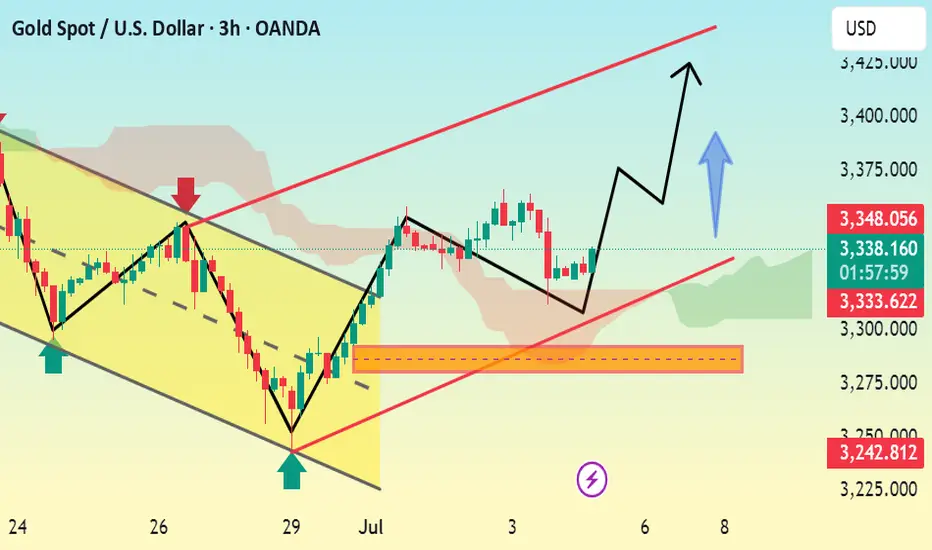
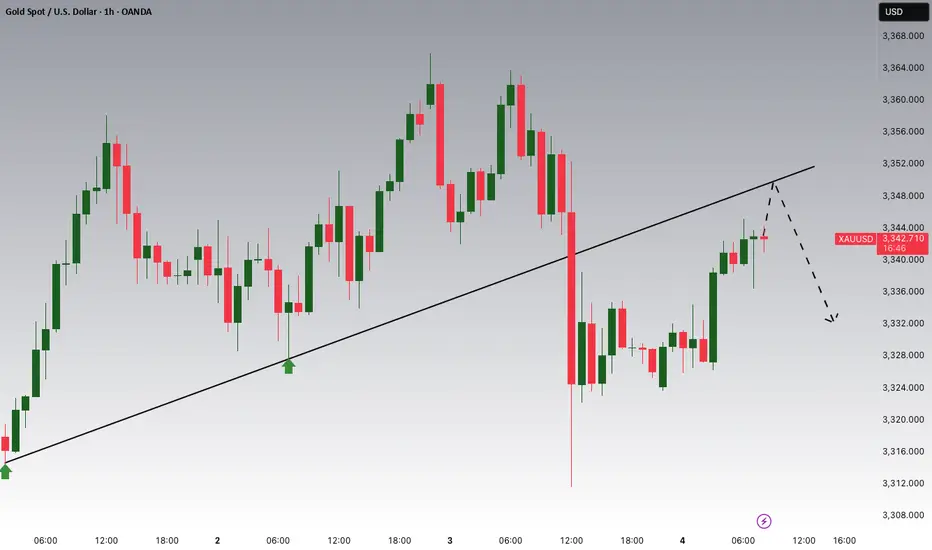
GOLD → Consolidation after a trend break...FX:XAUUSD , after breaking out of a downtrend, is consolidating, which may continue for some time due to Thursday's news and low liquidity on Friday.
Gold stabilized after a correction, but volatility risks remain. After falling from a weekly high of $3,366, gold prices found demand again in A
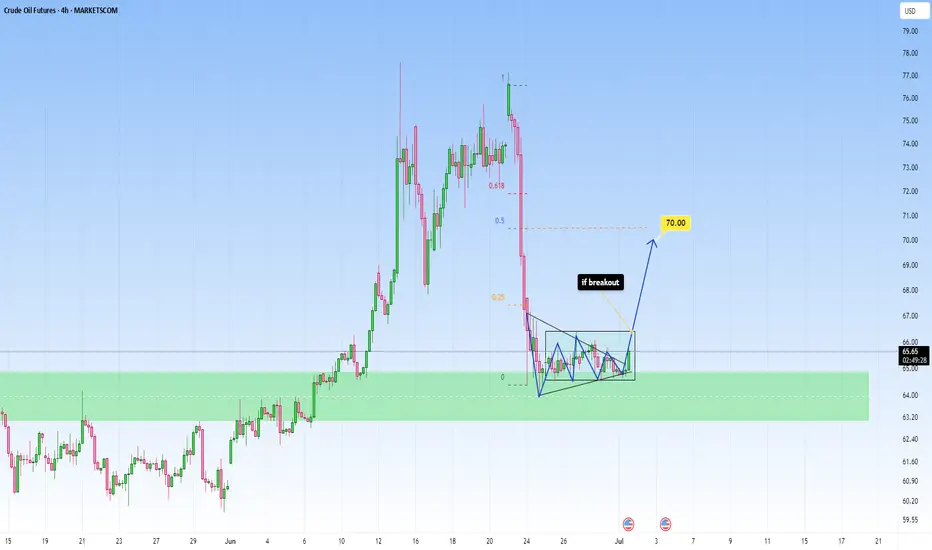
OIL fell sharply, opportunity for upside target of 70$OIL fell sharply and has now been in a contraction for a while, I am taking it into account for a potential breakout, as it shows tightening price action, which reflects market indecision.
Price action has now coiled into a symmetrical triangle, this is often a classic continuation or reversal patte
Gold Breakout and Potential RetraceHey Traders, in today's trading session we are monitoring XAUUSD for a selling opportunity around 3,350 zone, Gold was trading in an uptrend and successfully managed to break it out. Currently is in a correction phase in which it is approaching the retrace area at 3,350 support and resistance zone.
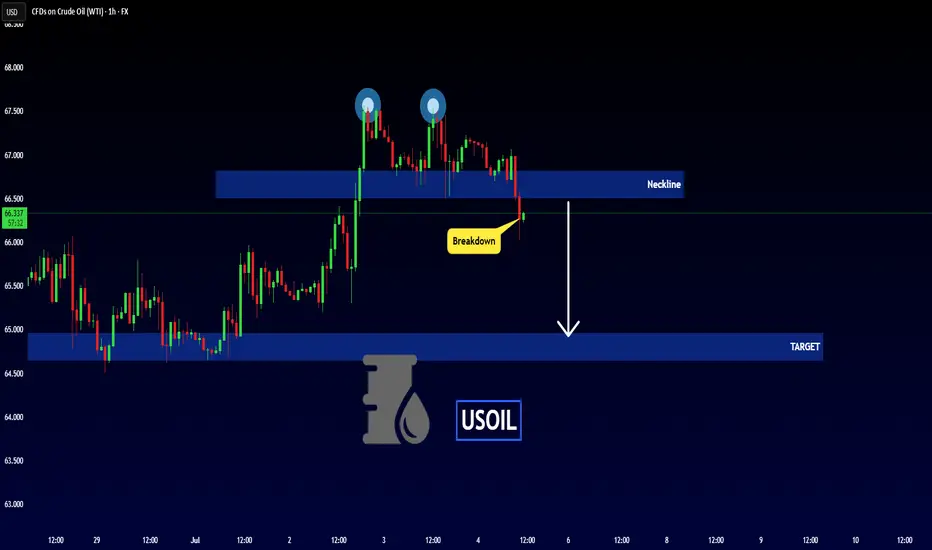
USOIL - Bearish Double TOPHello Traders !
The USOIL failed to create a new higher high!
The price formed a double top pattern.
Currently, The neckline is broken !
So, I expect a bearish move📉
________________
TARGET: 64.960🎯
DeGRAM | GOLD around $3350📊 Technical Analysis
● Bulls defended the 3 312 pivot where the rising-channel base and July trend-support intersect; successive higher-lows are squeezing price against 3 355—last week’s swing cap and channel median.
● A break of 3 355 completes a 1 : 1 wedge measured to 3 380, and the grey inner
Gold will exit from pennant and then rise to resistance levelHello traders, I want share with you my opinion about Gold. Recently, the price formed a pennant pattern after a sharp bullish impulse from the buyer zone (3275–3285 points). That upward movement started after the price bounced off the strong support level (3285) and broke out from the wedge structu
See all futures ideas
USDJPY Potential UpsidesHey Traders, in today's trading session we are monitoring USDJPY for a buying opportunity around 144.100 zone, USDJPY is trading in an uptrend and currently is in a correction phase in which it is approaching the trend at 144.100 support and resistance area.
Trade safe, Joe.
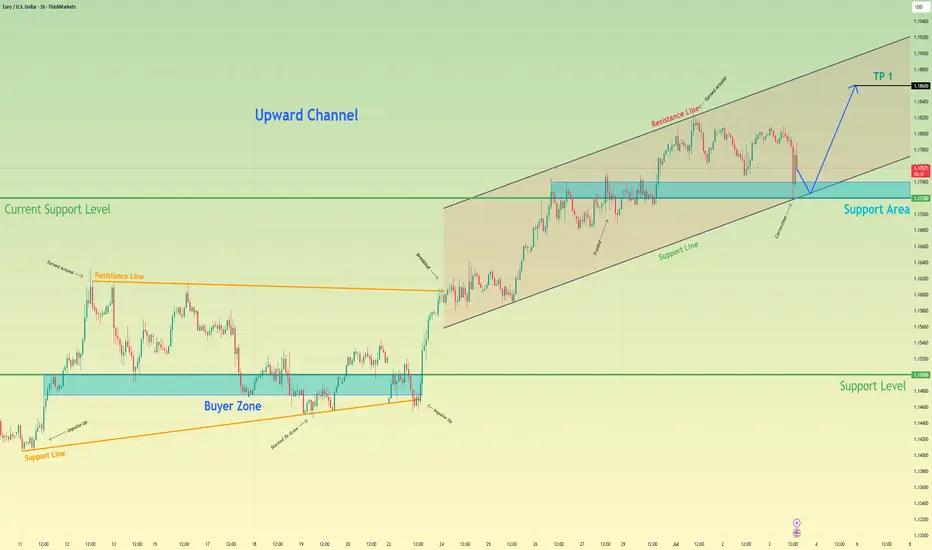
Euro can rebound up from support area to 1.1860 pointsHello traders, I want share with you my opinion about Euro. In this chart, we can see how the price has been moving confidently inside an upward channel after breaking out of a wedge formation. Previously, price consolidated within a narrowing wedge pattern above the buyer zone and broke upward, sho
04.07.25 Morning ForecastPairs on Watch -
FX:GBPJPY
FX:USDJPY
OANDA:XPTUSD
FX:EURCAD
A short overview of the instruments I am looking at for today, multi-timeframe analysis down to what I will be looking at for an entry. Enjoy!

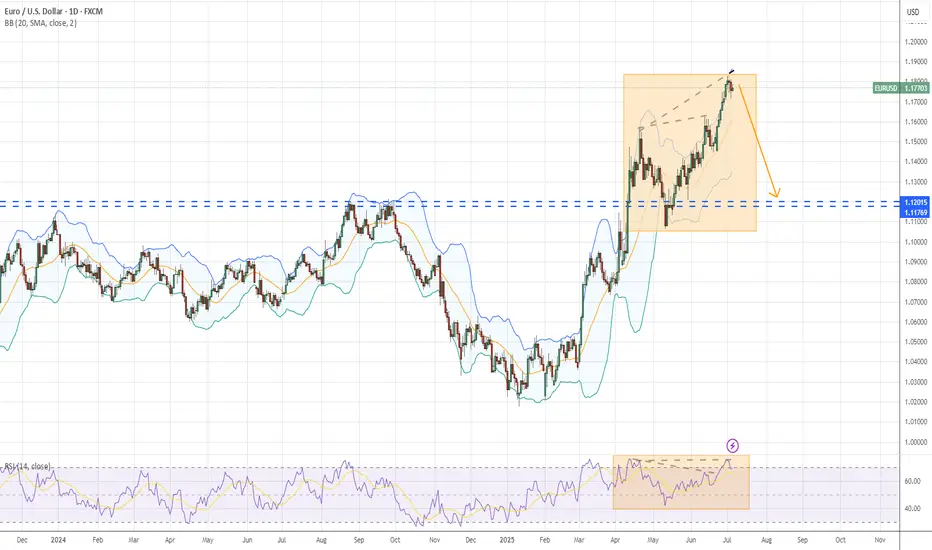
EURUSD ObservationCurrent status of EURUSD:
From the daily chart, it has diverged twice
It is no longer suitable to continue buying
Switch to a smaller period, like 4 hours, or 1 hour.
In fact, the hour head structure has appeared.
If it meets your entry criteria, you can try shorting
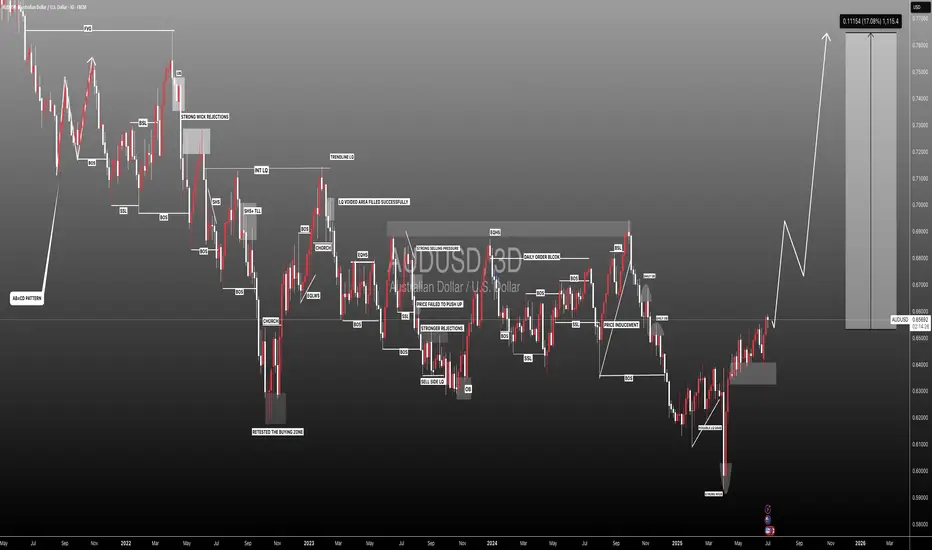
#AUDUSD: +1100 Pips Possible Swing Bullish Move! AUDUSD a strong sign of bullish behaviour has appeared alongside bullish momentum. As we have NFP tomorrow, we expect market to remain volatile; what we think now is to have market settled down before we can have any confirmation. We recommend to remain extra cautious tomorrow, once market get settl
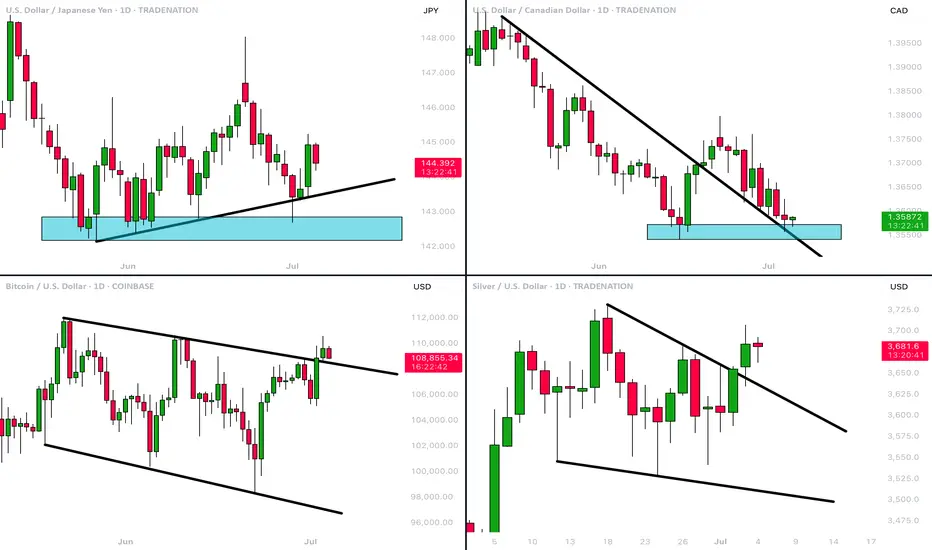
MarketBreakdown | USDJPY, USDCAD, BITCOIN, SILVER
Here are the updates & outlook for multiple instruments in my watch list.
1️⃣ #USDJPY daily time frame 🇺🇸🇯🇵
The market nicely respected a rising trend line
and bounced from that, forming a high momentum bullish candle.
I think that the pair will continue rising and reach 145.8 level soon.
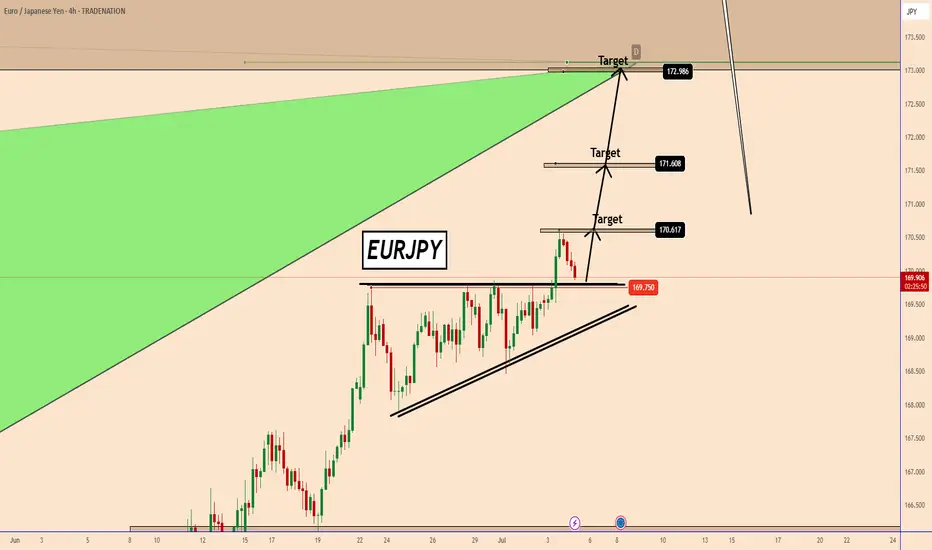
EURJPY: Another Bullish pattern pushing EURJPY to 173 EURJPY: Another Bullish pattern pushing EURJPY to 173
Yesterday, EURJPY confirmed a bullish triangle pattern during the opening of the U.S. market.
EURJPY has already reached 170.60 and is coming back for a retest of the broken resistance before moving higher again.
It's a complex situation,
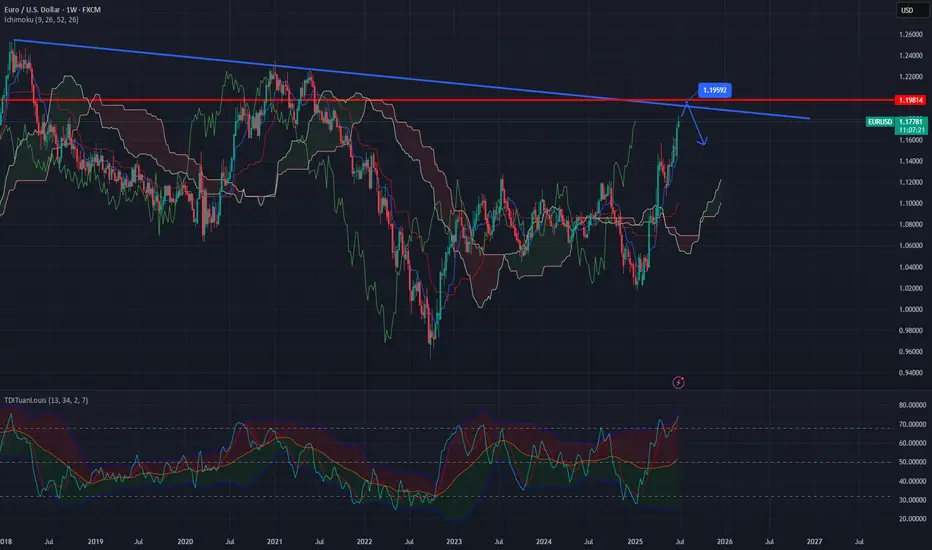
EU may stop rising soon. Closes to W1 downtrend!1. Key points for reversal coming:
The bullish wave on the weekly (W1) timeframe has been rising for quite a long time and has extended significantly.
It is approaching the downtrend zone on the weekly/monthly (W1/MN) chart.
There is a twisted Kumo top in the Ichimoku Cloud, indicating potential ind
EURUSD 30Min Engaged ( Bullish Entry Detected )➕ Objective: Precision Volume Execution
Time Frame: 30-Minute Warfare
Entry Protocol: Only after volume-verified breakout
🩸 Bullish Wave Coming From : 1.17400
➗ Hanzo Protocol: Volume-Tiered Entry Authority
➕ Zone Activated: Dynamic market pressure detected.
The level isn’t just price — it’s

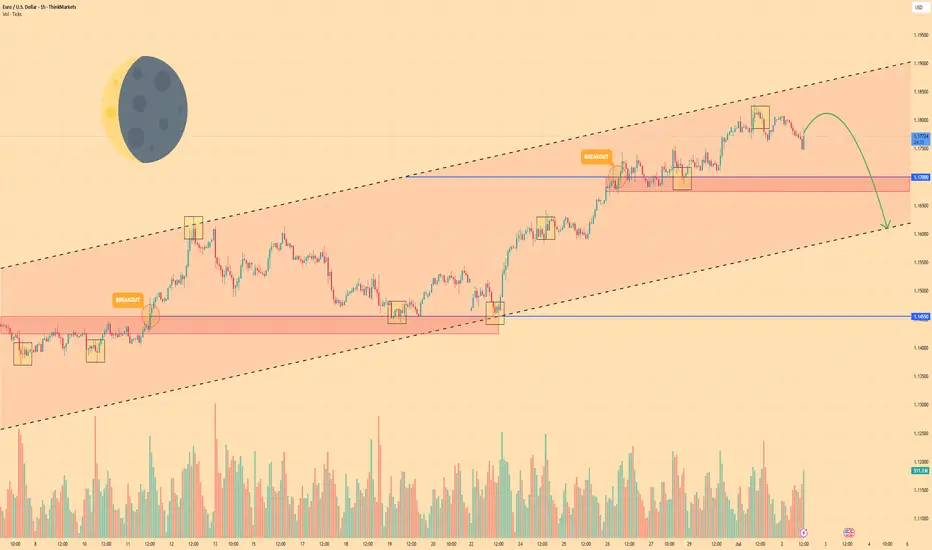
EURO - After movement up, price will drop to support lineHi guys, this is my overview for EURUSD, feel free to check it and write your feedback in comments👊
Recently price started to grow inside a rising channel, where it some time traded below the support area and soon bounced up.
Price broke $1.1455 level and rose to the resistance line of the channel
See all forex ideas
| - | - | - | - | - | - | - | ||
| - | - | - | - | - | - | - | ||
| - | - | - | - | - | - | - | ||
| - | - | - | - | - | - | - | ||
| - | - | - | - | - | - | - | ||
| - | - | - | - | - | - | - | ||
| - | - | - | - | - | - | - | ||
| - | - | - | - | - | - | - |
Trade directly on the supercharts through our supported, fully-verified and user-reviewed brokers.


