The market bias stays up, MJ stocks may be a buy here. The market continues to be biased up, and the target is likely the weekly B. MJ stocks are showing technical signs that a reversal may come. There may be other sectors similar as I think the summer bottom gamblers will start appearing now that everything else is at the highs. Gold looks like it will

The best trades require research, then commitment.
Get started for free$0 forever, no credit card needed

Scott "Kidd" PoteetThe unlikely astronaut

Where the world does markets
Join 100 million traders and investors taking the future into their own hands.

NATURAL GAS - Who can Predict this wild beast?Natural gas got demolished today, down over 8%.
The one headline we saw hitting the tape that is having some partial influence:
"Vessel Arrives at LNG Canada to Load First Cargo, Strengthening Global Supply Outlook – LNG Recap"
Today, we did hedge our core long UNG position with a short dated $5

GBPJPY: Bullish Impulse May Take Price To 205! 700+ Pips MoveGBPJPY is in steady bullish move in other words it is in impulse move; price has not yet exhausted and there is still extended bullish move to completed before bears takes control over. Please use accurate risk management while trading and do your own analysis.
LIKE
COMMENT
SHARE
Good luck.
Te

Stocks Are Crushing It at Record Highs. What’s Behind the Rally?Happy record highs, everyone — confetti, champagne, and yet another all-time high. The Nasdaq NASDAQ:IXIC and the S&P 500 SP:SPX just did it again — notched fresh closing records that have traders flexing their P&Ls like it’s 1999.
If you’ve been on the sidelines, you’re probably staring at th

One Last Push Before It’s Over?Total Market Cap CRYPTOCAP:TOTAL CRYPTOCAP:TOTALES
From a price action perspective, the structure looks very constructive:
• In May 2021, a swing high was formed, which later became a key resistance level.
• In November 2021, we saw a fakeout, confirming the significance of the level.
•

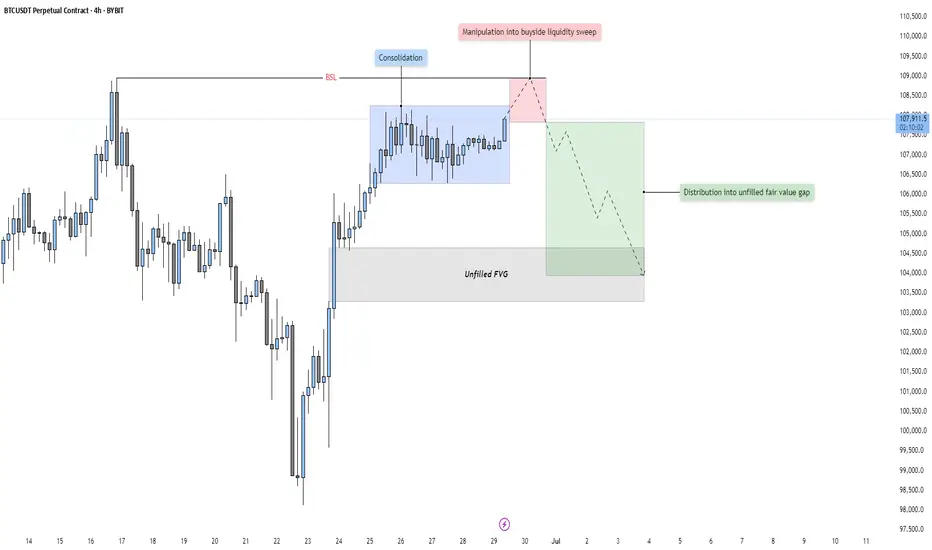
BTC - Consolidation, Manipulation & DistributionMarket Context
The current price action unfolds within the broader structure of a bullish leg that began after a sharp reversal near 97,000. This impulsive rally created a clear Fair Value Gap on the 4-hour chart—left behind as price surged upward with minimal resistance. Following this move, the m
PCEs & attacks on PowellWe are carefully monitoring the PCEs today, to see, "wins" this small battle in the rate-lowering war. Let's dig in.
Let us know what you think in the comments below.
Thank you.
77.3% of retail investor accounts lose money when trading CFDs with this provider. You should consider whether you under

21D $BTC pattern to watchWanted to show a pattern I was looking at and analyzing the 21D (a fib number) and see the fib extensions match up on each breakout.
A tad confusing I know, but hope the visual helps.
Fibo

Beating the S&P 500 with TradingView's Stock ScreenerThis is Mo from MWRIGHT TRADING. The date is Friday, June 27th, 2025.
This video is about selecting stocks that collectively have the potential to consistently beat the S&P 500
I look for smooth and consistent long-, mid-, and short-term performance. For that we need
Building a Screener
What I

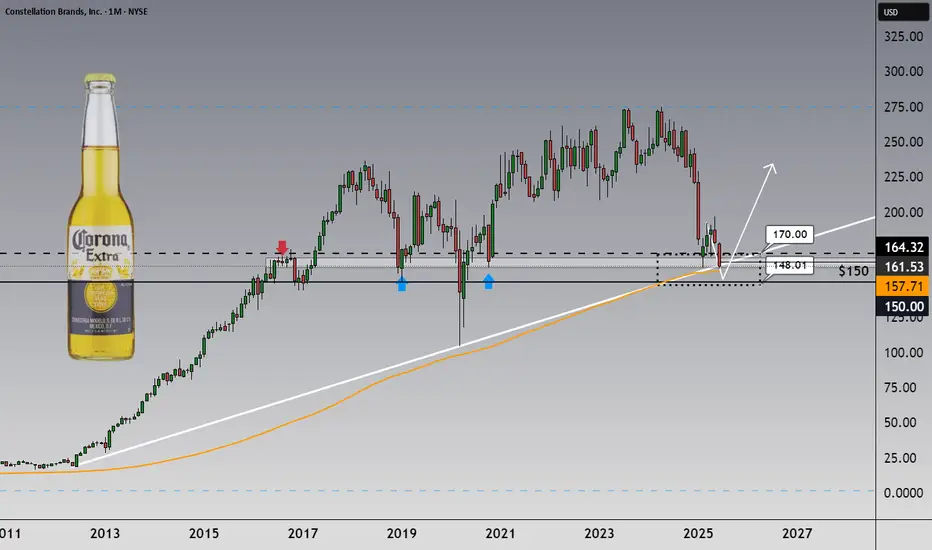
27% Cheaper Than Buffett’s Buy – And Sitting on a Key ZoneHi,
One of the most recent and notable additions to Berkshire Hathaway’s portfolio is Constellation Brands NYSE:STZ — and if that’s not a fundamental vote of confidence, I don’t know what is.
And hey, while Midsummer Day is behind us, warm and sunny summer evenings still lie ahead. So why not ma
See all editors' picks ideas
True Close – Institutional Trading Sessions (Zeiierman)█ Overview
True Close – Institutional Trading Sessions (Zeiierman) is a professional-grade session mapping tool designed to help traders align with how institutions perceive the market’s true close. Unlike the textbook “daily close” used by retail traders, institutional desks often anchor their

Open Interest Footprint IQ [TradingIQ]Hello Traders!
Th e Open Interest Footprint IQ indicator is an advanced visualization tool designed for cryptocurrency markets. It provides a granular, real-time breakdown of open interest changes across different price levels, allowing traders to see how aggressive market participation is distribu

Zigzag CandlesCan't deny that I am obsessed with zigzags. Been doing some crazy experiments with it and have many more in pipeline. I believe zigzag can be used to derive better trend following methods. Here is an attempt to visualize zigzag as candlesticks. Next steps probably to derive moving average, atr (alth

MathStatisticsKernelFunctionsLibrary "MathStatisticsKernelFunctions"
TODO: add library description here
uniform(distance, bandwidth) Uniform kernel.
Parameters:
distance : float, distance to kernel origin.
bandwidth : float, default=1.0, bandwidth limiter to weight the kernel.
Returns: float.
triangular(distance

MathConstantsLibrary "MathConstants"
Mathematical Constants
E() The number e
Log2E() The number log (e)
Log10E() The number log (e)
Ln2() The number log (2)
Ln10() The number log (10)
LnPi() The number log (pi)
Ln2PiOver2() The number log (2*pi)/2
InvE() The number 1/e
SqrtE() The n

taLibrary "ta"
█ OVERVIEW
This library holds technical analysis functions calculating values for which no Pine built-in exists.
Look first. Then leap.
█ FUNCTIONS
cagr(entryTime, entryPrice, exitTime, exitPrice)
It calculates the "Compound Annual Growth Rate" between two points i

Tape [LucF]█ OVERVIEW
This script prints an ersatz of a trading console's "tape" section to the right of your chart. It displays the time, price and volume of each update of the chart's feed. It also calculates volume delta for the bar. As it calculates from realtime information, it will not display info

Dominance Pie ChartA different type of charting, the pie chart,
here for showing the available dominance on one chart,
together with the total % dominance per ticker and between brackets
the % rise/fall.
Can be used in every timeframe
(It is normal it takes some time to be loaded)
Cheers!

Circular Candlestick ChartAn original (but impractical) way to represent a candlestick chart using circles arc.
The most recent candles are further away from the circle origin. Note that OHLC values follow a clockwise direction. A higher arc length would indicate candles with a higher body or wick range.
The Length setti

Color█ OVERVIEW
This library is a Pine Script® programming tool for advanced color processing. It provides a comprehensive set of functions for specifying and analyzing colors in various color spaces, mixing and manipulating colors, calculating custom gradients and schemes, detecting contrast, and con

See all indicators and strategies
Community trends
NATURAL GAS - Who can Predict this wild beast?Natural gas got demolished today, down over 8%.
The one headline we saw hitting the tape that is having some partial influence:
"Vessel Arrives at LNG Canada to Load First Cargo, Strengthening Global Supply Outlook – LNG Recap"
Today, we did hedge our core long UNG position with a short dated $5
7/1/25 - $oscr - Dip buying AH at mid 17s7/1/25 :: VROCKSTAR :: NYSE:OSCR
Dip buying AH at mid 17s
- stock running for good reason
- NYSE:HIMS of insurance type
- NYSE:CNC is pee'ing in the narrative, but NYSE:OSCR guide unaffected
- I'd expect to pick up a MSD gain here
- I have limits into the 16's tn where i'd rather own more

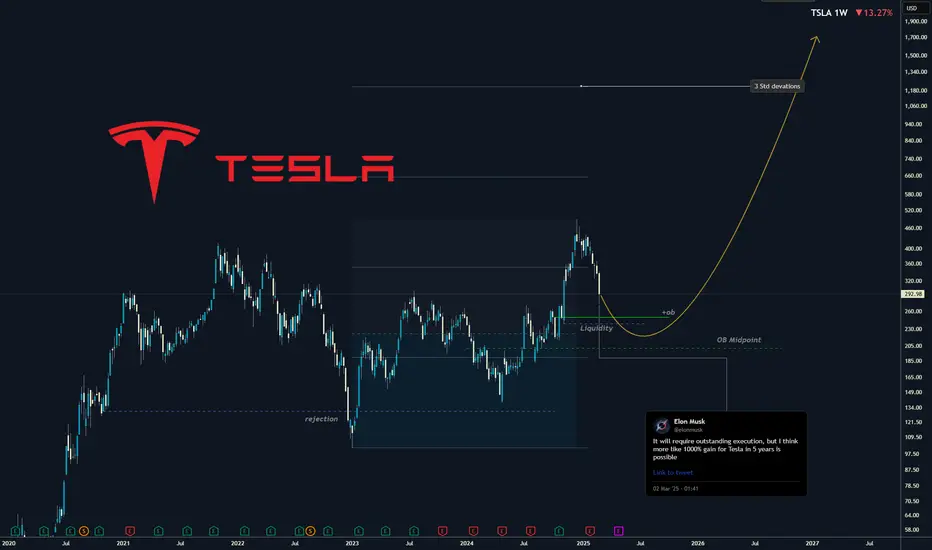
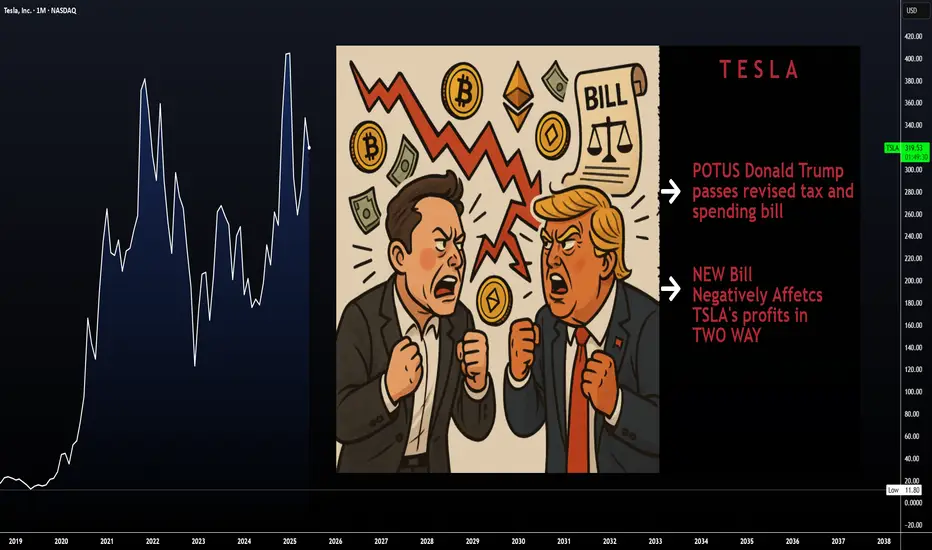
TESLA I Its not only EV Cars. Elon Musk predicting 1000% growthThis is not a short-term trade as you know from me on FX, Crypto and Indices. This is buy and hold investment. I got already good bag of share and Im still adding without trying to time if perfectly, but now I think its time to buy bigger positions.
Tesla is my 3rd biggest position after the Bitcoi
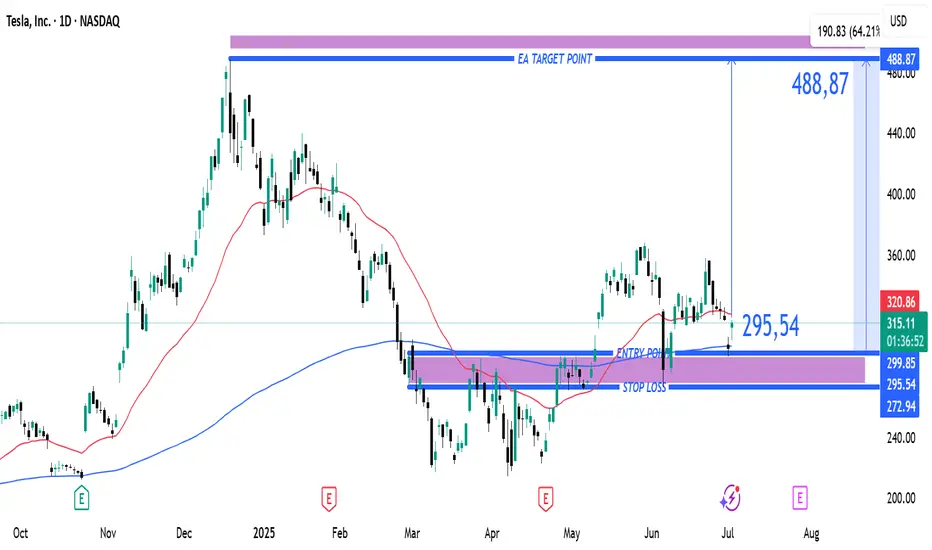
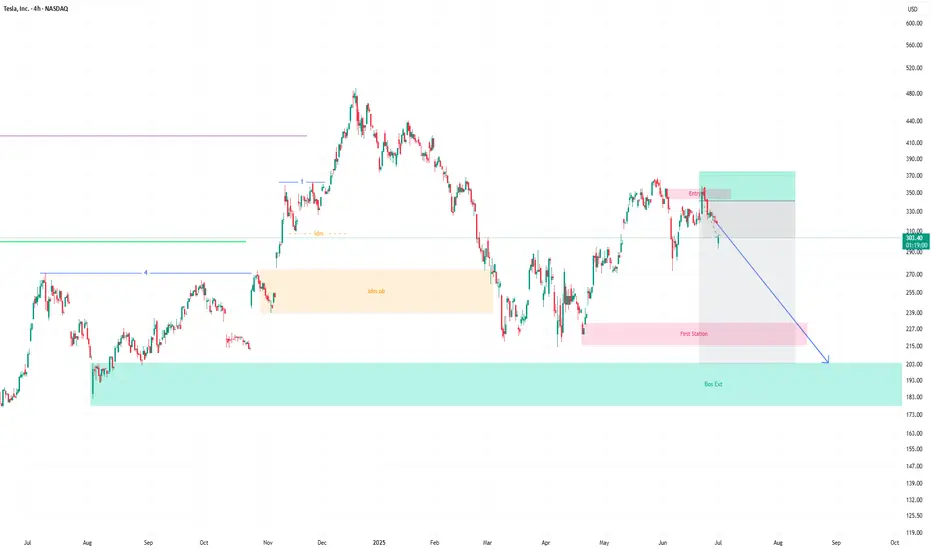
Tesla Bullish Breakout Setup: Entry at $295.54 Targeting $488.87Entry Point (Buy Zone): Around $295.54
Stop Loss: Between $272.94 – $295.54 (lower purple support zone)
Target (TP): $488.87
Current Price: $315.33 (as of the latest candle)
📈 Strategy Summary:
Setup Type: Long (Buy)
Risk-Reward Setup:
Reward: ~$193.33 per share (from $295.54 to $488.87)
Ris
The price will drop to at least $230The price will drop to at least $230. after that can goes to $200. but i have to re-check at $230
If you are thinking of investing, this is not a good place to buy at all.
I recommend entering in the $200 range after getting the necessary confirmations.
If you would like to follow me to see the rest
MUSK on TRUMP's Bill | "outrageous, disgusting abomination"Elon Musk’s sided against the latest Trump-backed tax-and-spending package, in a plot twist between the recent partners turned enemies.
Musk called the legislation a “massive, outrageous, pork-filled Congressional spending bill” and a “disgusting abomination,” publicly shaming senators and represen
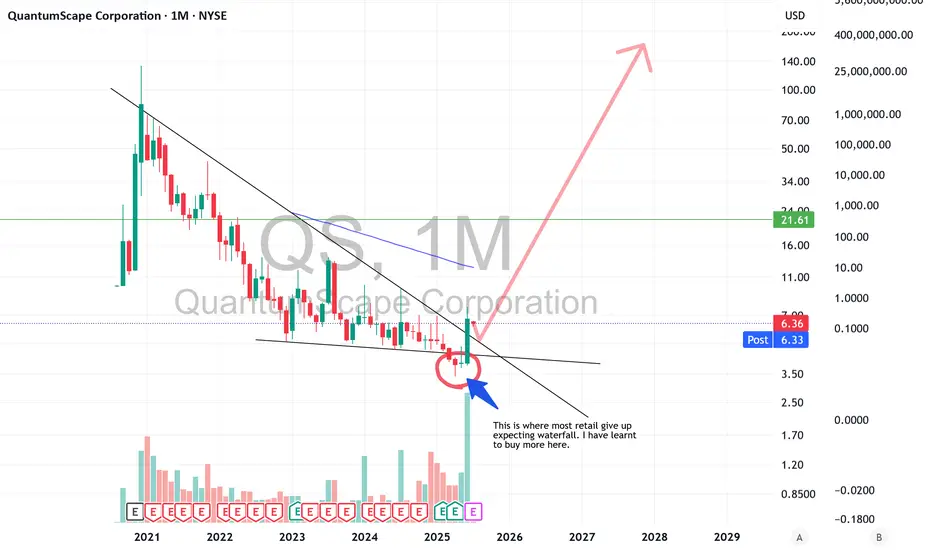
QS heading a lot higherFor those that have been following me for a while know I have been a long time holder of QS and have been accumulating even up until yesterday. Its been a long painful hold but I believe we are finally ready to begin the upward trajectory that many expected. I pointed out in the chart where most ret
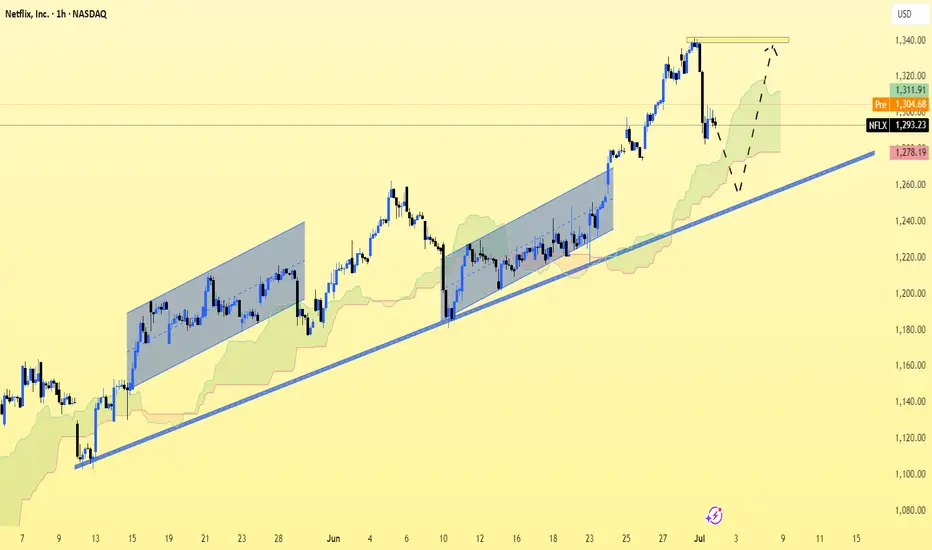
NFLX (Netflix Inc.) on the 1-hour chart (NASDAQ)NFLX (Netflix Inc.) on the 1-hour chart (NASDAQ) using price action, trendlines, and Ichimoku Cloud.
Observations:
There's a strong uptrend with higher highs and higher lows.
Price recently pulled back and is currently testing the Ichimoku cloud support, possibly forming a bullish continuation pa
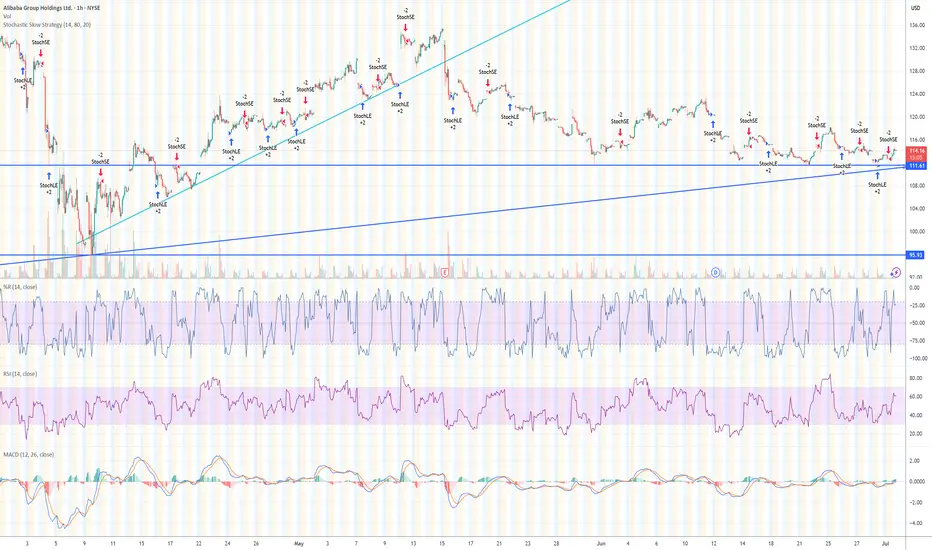
Alibaba on the lower upward trend lineAlibaba is on the upward trend line after years of a downward trend. The AI business is booming. The fundamentals speak for themselves. The price/earnings ratio for 2025 is around 12 and is on Value level. The conflict with the Chinese party seems to have improved. The company is buying back shares.
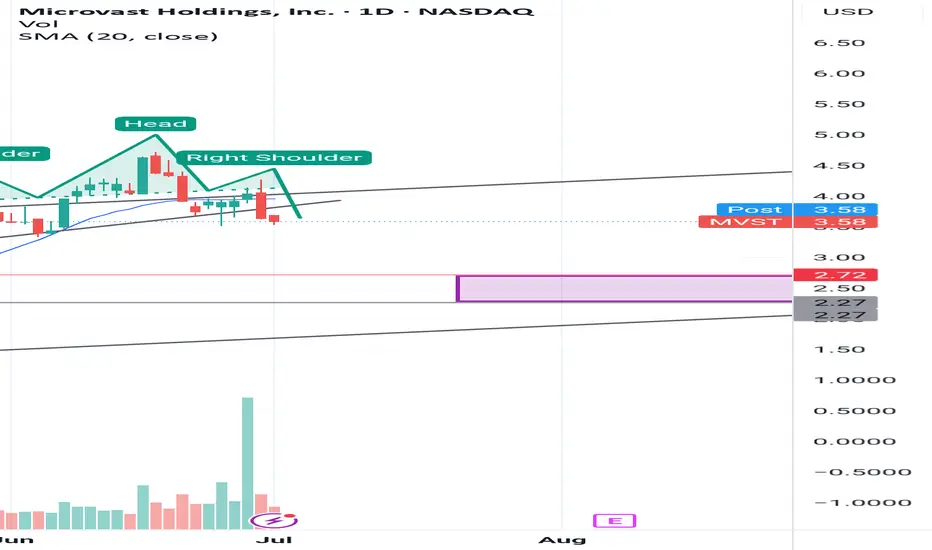
MVST - Bearish Head & Shoulders Breakdown Targeting $2.25–$2.75A classic Head and Shoulders pattern has formed on MVST's daily chart, with a clear neckline break to the downside. This technical setup suggests bearish momentum in the short term, with a likely price target between $2.25 and $2.75.
This zone also aligns with a prior consolidation area and dynamic
See all stocks ideas
Today
FIZZNational Beverage Corp.
Actual
0.48
USD
Estimate
0.48
USD
Today
HSCSHeartSciences Inc.
Actual
—
Estimate
−1.78
USD
Today
FNGRFingerMotion, Inc.
Actual
—
Estimate
—
Today
IMMRImmersion Corporation
Actual
—
Estimate
0.23
USD
Today
PMCBPharmaCyte Biotech, Inc.
Actual
—
Estimate
—
Today
USAUU.S. Gold Corp.
Actual
—
Estimate
−0.15
USD
Today
ALZNAlzamend Neuro, Inc.
Actual
—
Estimate
−2.70
USD
Today
MEIMethode Electronics, Inc.
Actual
—
Estimate
0.00
USD
See more events
Community trends
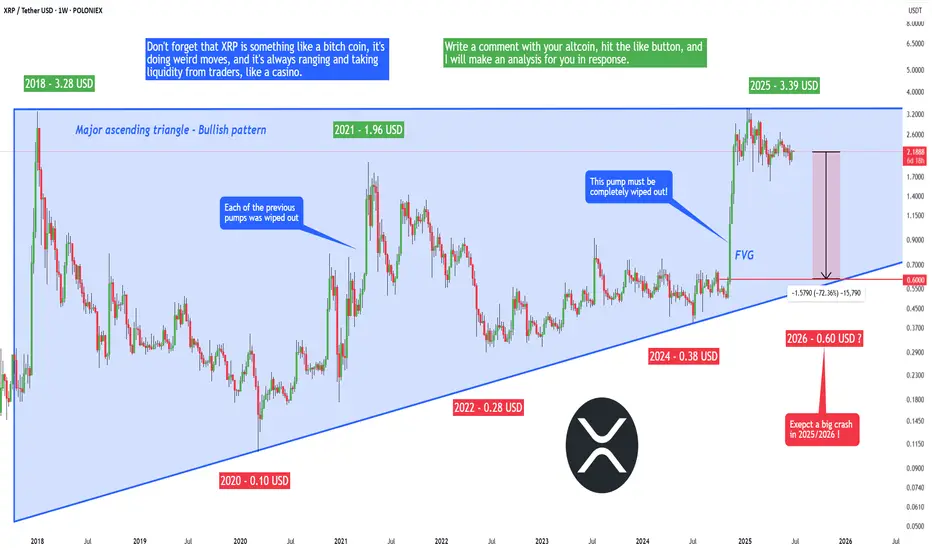
XRP Army - prepare for a 72% crash to 0.6 USD! (lifetime chance)The current price of XRP is 2.19 USD, and I predict a big crash in 2025/2026 to 0.6 USD. Yes, I know you may think that that's completely impossible, especially if you are high on your XRP holdings, but I can assure you that this is going to happen! What can you do?
If you are a hodler, then you
BTC - Will the Bearish Channel continue?Market Context
After a strong impulsive rally earlier in the year, BTC has been trading within a descending channel on the daily timeframe. This corrective structure suggests a period of consolidation and redistribution, as price oscillates between the channel's boundaries. The repeated rejection f

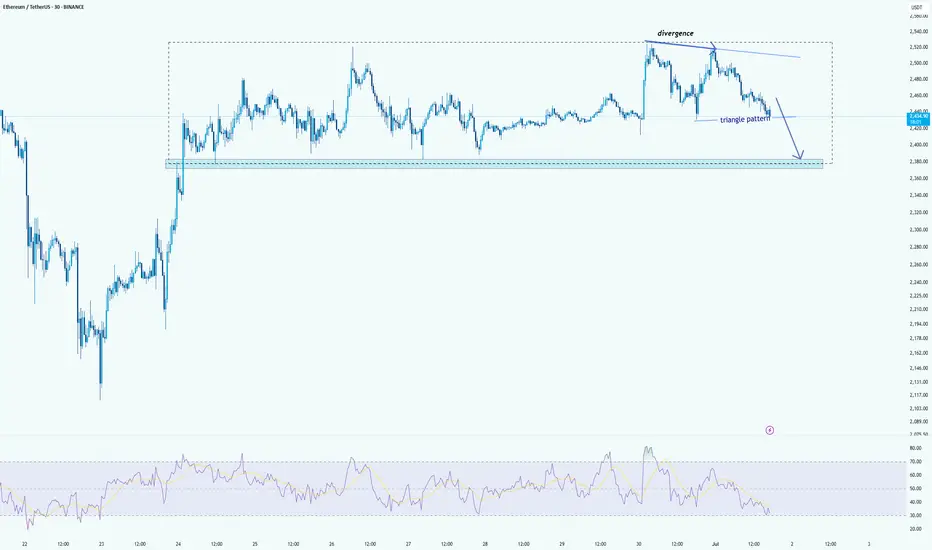
ETH 30min: Bearish Triangle Forming After RSI Divergencehelo guys
Ethereum is currently trading within a clear range, and recently formed a bearish triangle pattern near the top of the consolidation. A visible RSI divergence confirmed the loss of bullish momentum as price made a higher high, but RSI printed a lower high — a common sign of exhaustion.
N
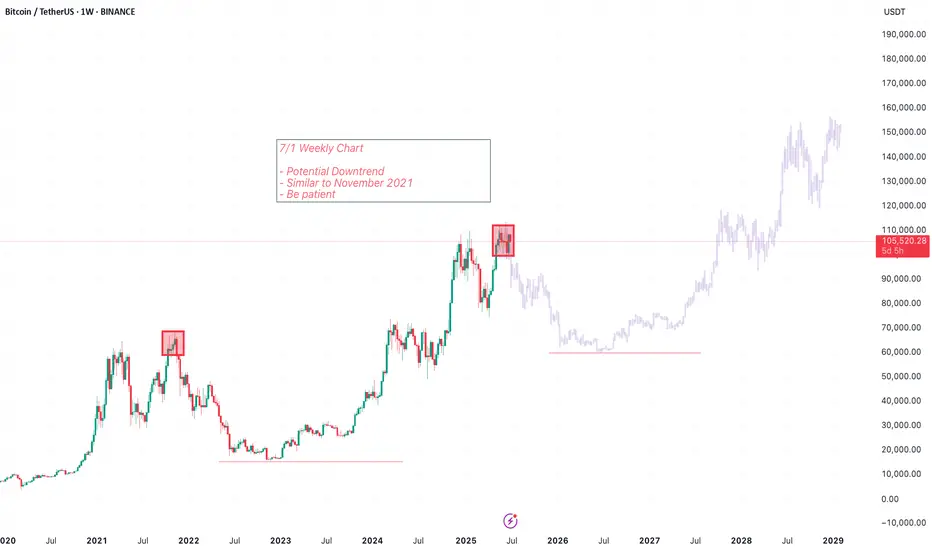
BTC Weekly Chart: DOWNJuly 1st 2025
BTC Weekly Chart: Down
Potentially forming a local top on the wrong shoulder.
See October-November 2021.
Be Patient.
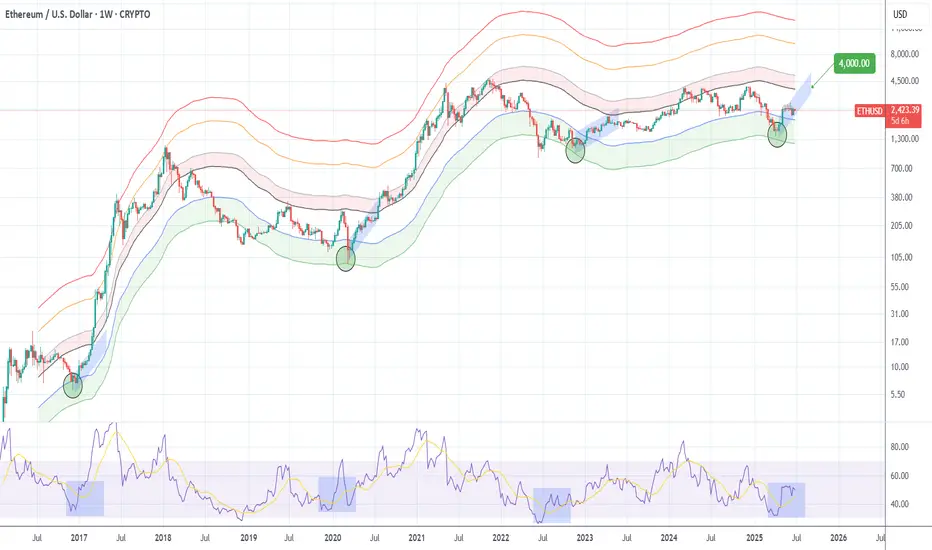
ETHEREUM Perhaps the easiest long out there.Ethereum (ETHUSD) is consolidating just above the Buy Zone of the Mayer Multiple Bands (MMBs) where it rebounded on its April bottom.
Throughout its historic price action, every time it hit this Zone and rebounded, it reached at least the bottom of its Mean MM zone (red Zone).
As a result, $4000 t
Bitcoin - Price struggles below resistance, correction to $104k?This 4-hour chart for BTC/USD illustrates a detailed technical analysis scenario highlighting key resistance and support zones, as well as a critical fair value gap (FVG). The chart shows that Bitcoin is currently facing strong resistance in the $108,000 to $109,000 range. This area has been tested

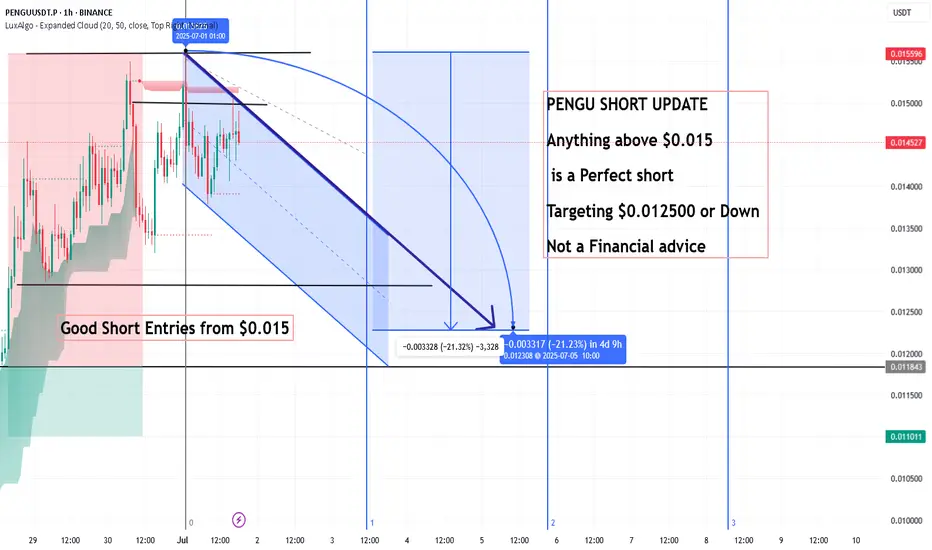
PENGU SHORT UPDATE ,Anything above $0.015 is a Perfect shortPENGU SHORT UPDATE
Anything above $0.015
is a Perfect short
Targeting $0.012500 or Down
Not a Financial advice
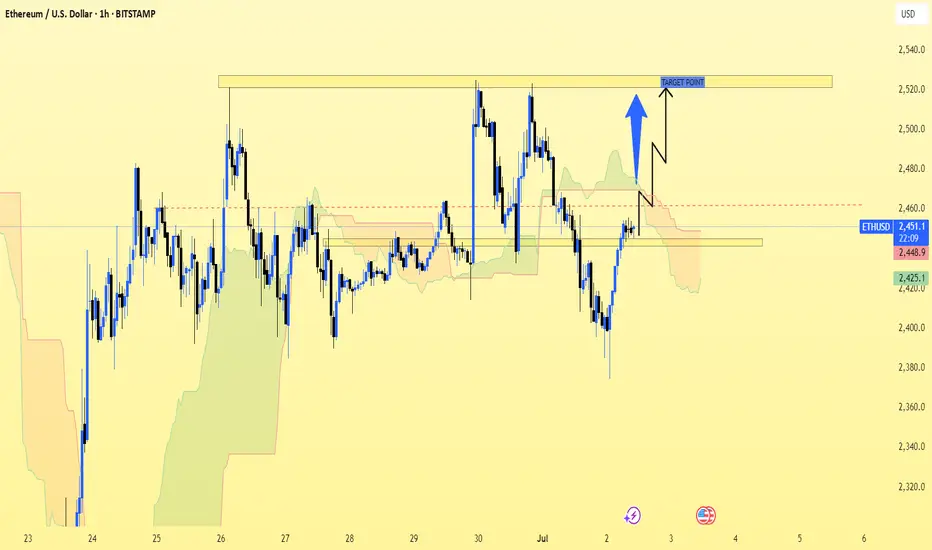
ETH/USD (Ethereum to US Dollar) on the 1-hour timeframe. ETH/USD (Ethereum to US Dollar) on the 1-hour timeframe.
Here’s a quick breakdown of what’s visible:
There is an Ichimoku Cloud indicator on the chart.
A resistance zone is marked at the top (around $2,540 – $2,550).
A support zone appears around $2,440 – $2,460.
There's a bullish arrow point
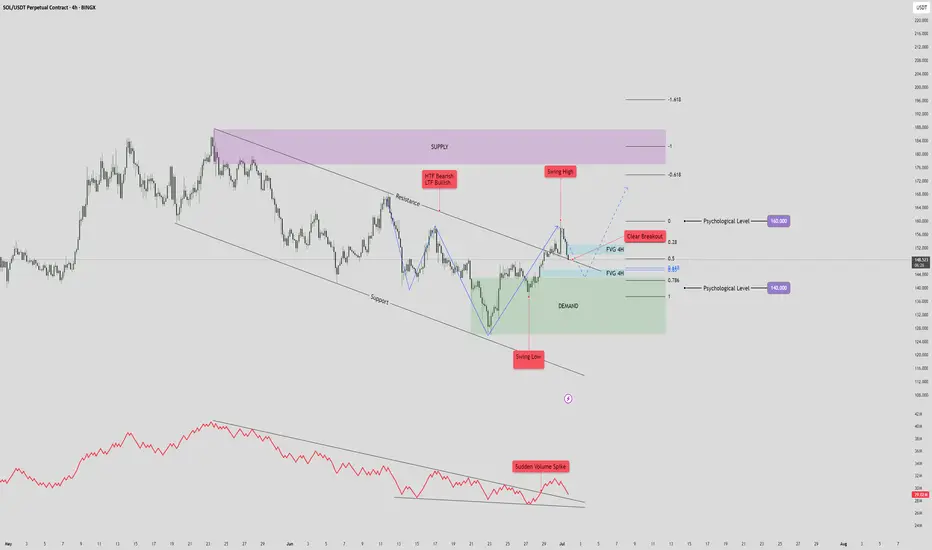
Solana (SOL/USDT) 4H Reverse H&S PatternSolana (SOL/USDT) – 4H Market Outlook | July 1, 2025
Introduction
SOL has formed a reverse head and shoulders pattern, followed by a clean breakout above resistance. While the lower time frame is bullish, the higher time frame remains bearish, creating a short-term opportunity within a broader dow
Bitcoin Recovers Above 105,000, Extremely Bullish +AltcoinsBitcoin produced only two days red, a bear-trap, and is now trading daily back above $107,000, an extremely bullish development.
Good morning my fellow Cryptocurrency trader, I hope you are having wonderful day.
The altcoins market bull market is confirmed and what Bitcoin is currently doing gives

See all crypto ideas
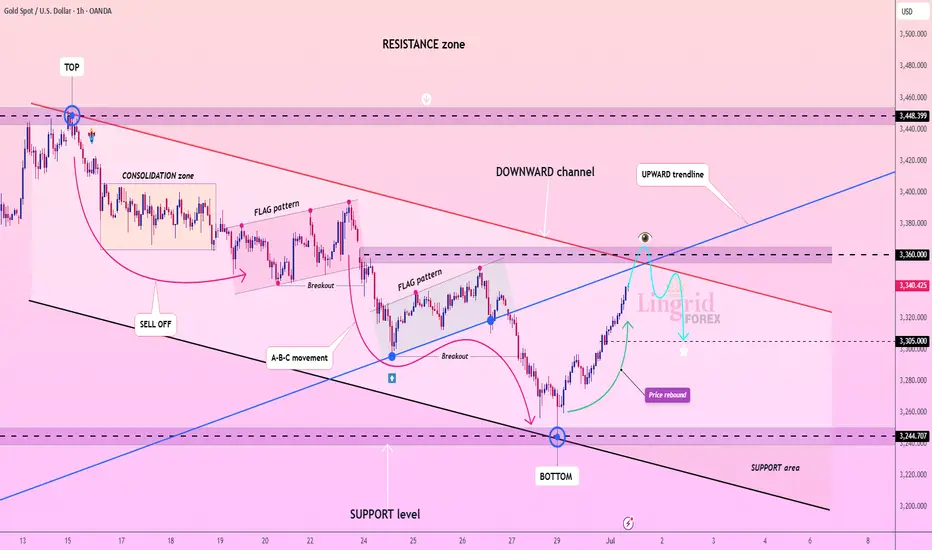
Lingrid | GOLD Shorting Opportunity at Confluence ResistanceOANDA:XAUUSD is approaching the key resistance near 3360 after rebounding from the 3245 support level and breaking out of the downward channel. Price is now testing the upward trendline from below, intersecting with the red descending trendline and horizontal resistance. If this confluence zone rej
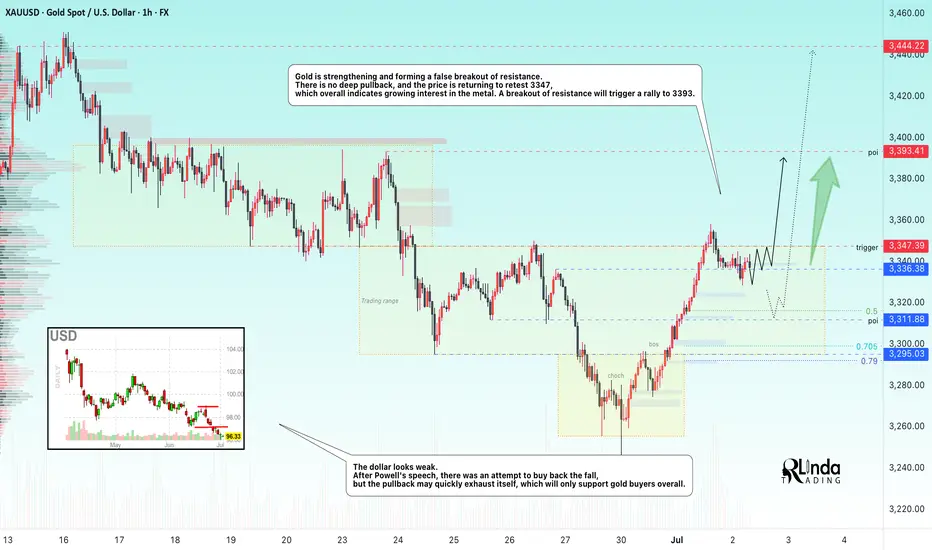
GOLD → Retesting resistance may lead to a breakout.FX:XAUUSD breaks the downward resistance line on the senior timeframe and tests the upper limit of the trading range amid the falling dollar and Powell's speech. The metal may continue its upward movement.
The dollar's rise was short-lived after Fed Chairman Jerome Powell hinted at an imminent
XAUUSD : Bull or Bear ? (READ THE CAPTION)By analyzing the gold chart on the 4-hour timeframe, we can see that the price continued its correction yesterday, dropping to as low as $3327. However, gold rebounded and is currently trading around the $3344 level.
The key condition for further bullish movement is a stable hold above $3338. If th
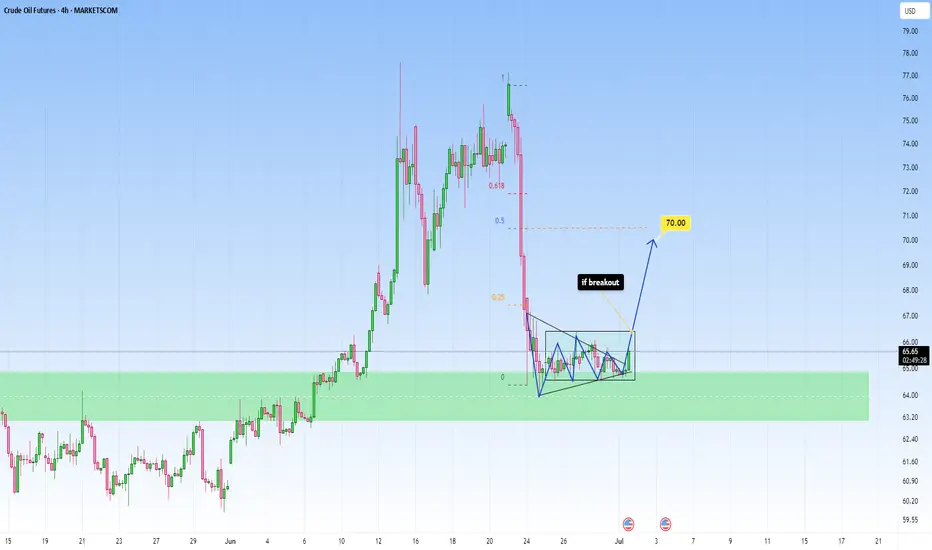
OIL fell sharply, opportunity for upside target of 70$OIL fell sharply and has now been in a contraction for a while, I am taking it into account for a potential breakout, as it shows tightening price action, which reflects market indecision.
Price action has now coiled into a symmetrical triangle, this is often a classic continuation or reversal patte
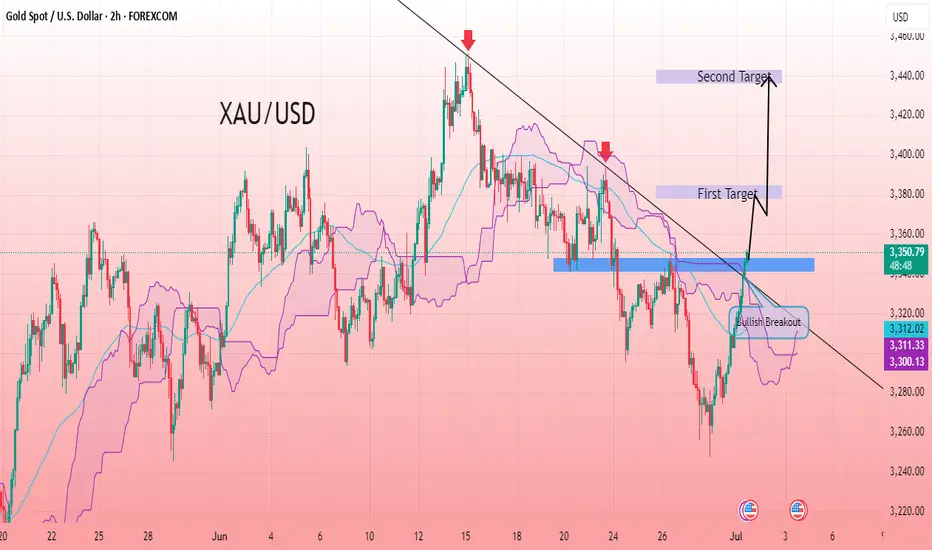
XAU/USD 2H CHART PATTERNXAUUSD 2H chart shows a clear trendline breakout after a period of consolidation, indicating a potential bullish continuation. The breakout occurred with strong momentum, supported by clear higher lows before the break, signaling buyer interest. Price action has closed firmly above the trendline, co
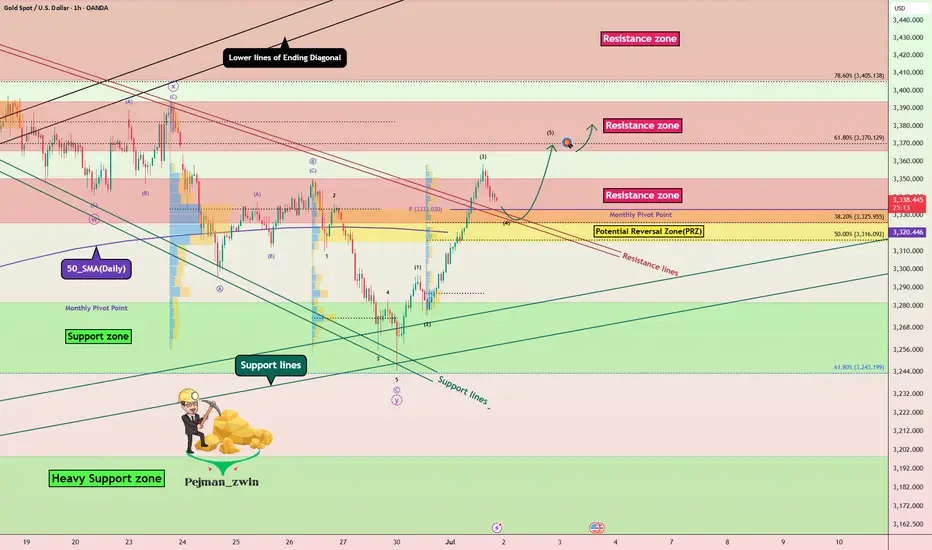
Gold Breakout Retest – Will PRZ Trigger the Next Rally?Gold ( OANDA:XAUUSD ) attacked the Resistance lines and Resistance zone($3,350-$3,326) as I expected in yesterday's idea .
Gold seems to have broken the Resistance zone($3,350-$3,326) and Resistance lines and is pulling back to this zone.
In terms of Elliott Wave theory , Gold appe
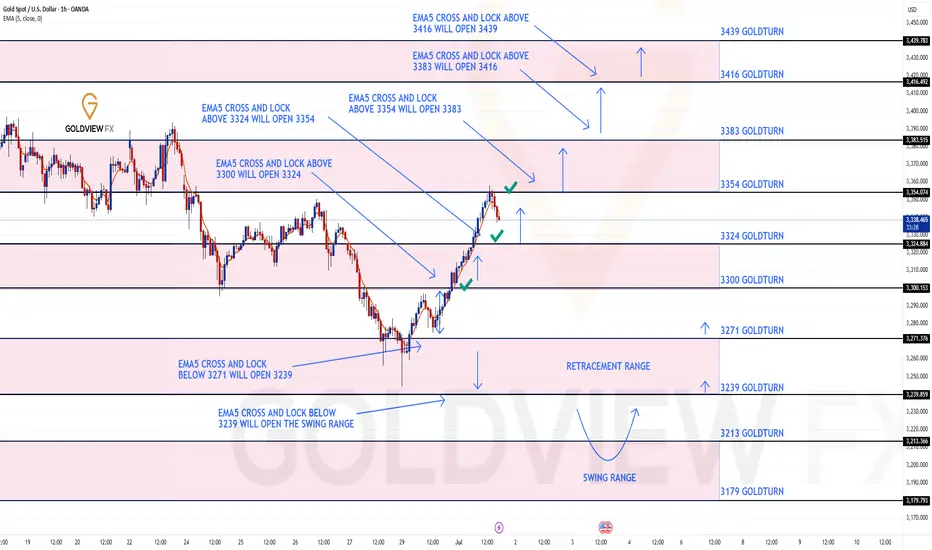
GOLD ROUTE MAP UPDATEHey Everyone,
Another PIPTASTIC day on the charts today with our analysis playing out to perfection!!!
After hitting 3300 target yesterday, we stated that we would now look for ema5 cross and lock above 3300 to open 3324. This was locked and loaded and we got the target hit at 3324. This followed
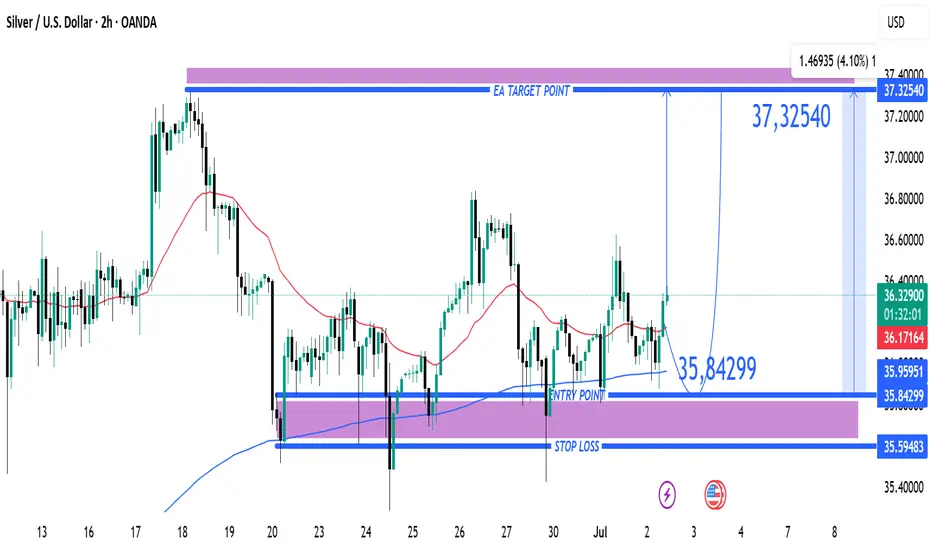
Silver (XAG/USD) Bullish Trade Setup from Key Support ZoneXAG/USD (Silver) Trade Analysis – 2H Chart (July 2, 2025)
🔹 Trade Setup Overview:
Entry Point: 35.84299
Target (TP): 37.32540
Stop Loss (SL): 35.59483
Current Price: 36.36350
Risk/Reward Ratio: ~5.9:1 (Very favorable)
🔹 Technical Insights:
Support Zone:
Price recently tested and respected a st
Trading Signal for (XAU/USD) sell below $3,359 (21 SMA-7/8 MurraEarly in the European session, gold is trading around 3,341, below the 7/8 Murray and above the 21 SMA and the 200 EMA, with a bullish bias.
We can see that gold reached the 7/8 Murray level on the H4 chart. This has become strong resistance, so we believe a technical correction could occur below t
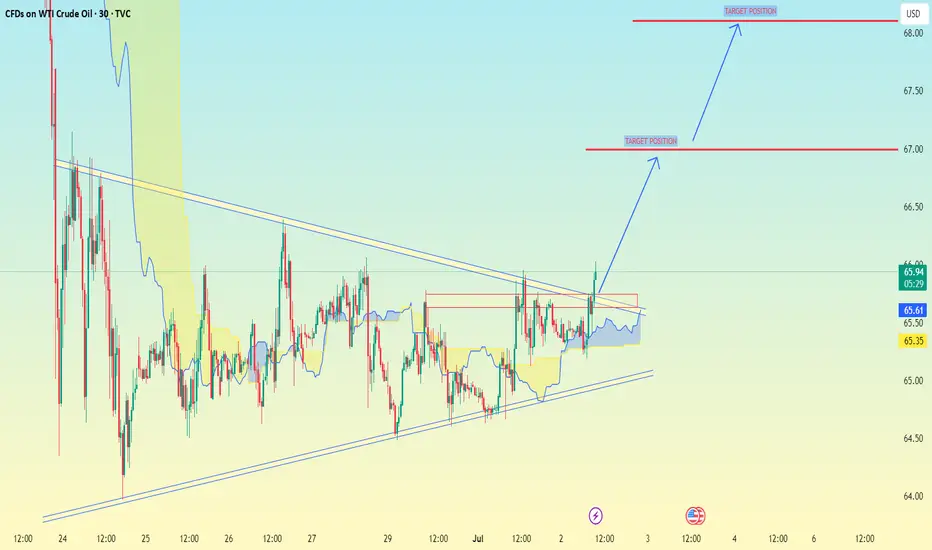
(WTI Crude Oil) on the 30-minute timeframe:(WTI Crude Oil) on the 30-minute timeframe:
You have a clear triangle breakout happening.
The chart shows two bullish target positions marked with blue arrows.
Based on your chart:
Current Price Zone: Around 66.20 - 66.25
Target Levels:
✅ First Target: 67.00
✅ Second Target: 68.00 - 68.10
-
See all futures ideas
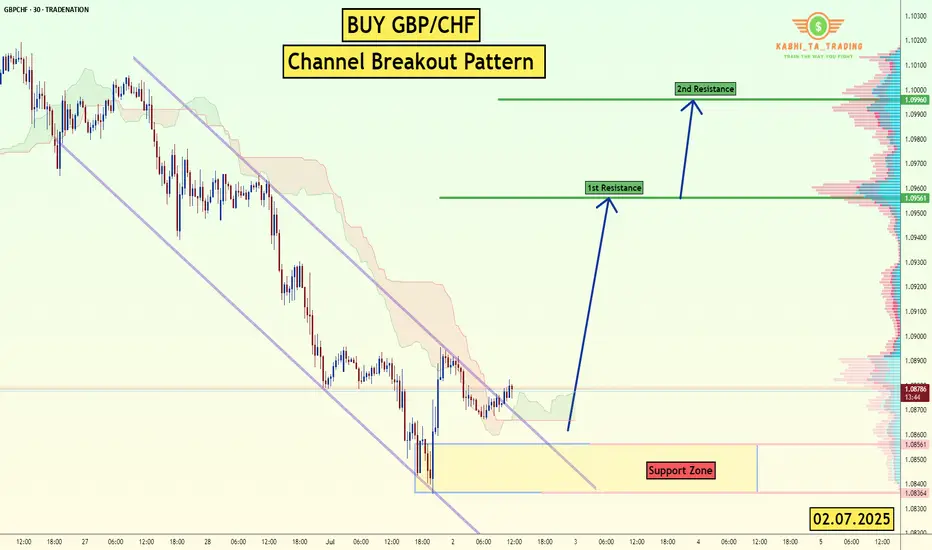
GBP/CHF - Channel Breakout (02.07.2025)The GBP/CHF pair on the M30 timeframe presents a Potential Buying Opportunity due to a recent Formation of a Breakout Pattern. This suggests a shift in momentum towards the upside and a higher likelihood of further advances in the coming hours.
Possible Long Trade:
Entry: Consider Entering A Long
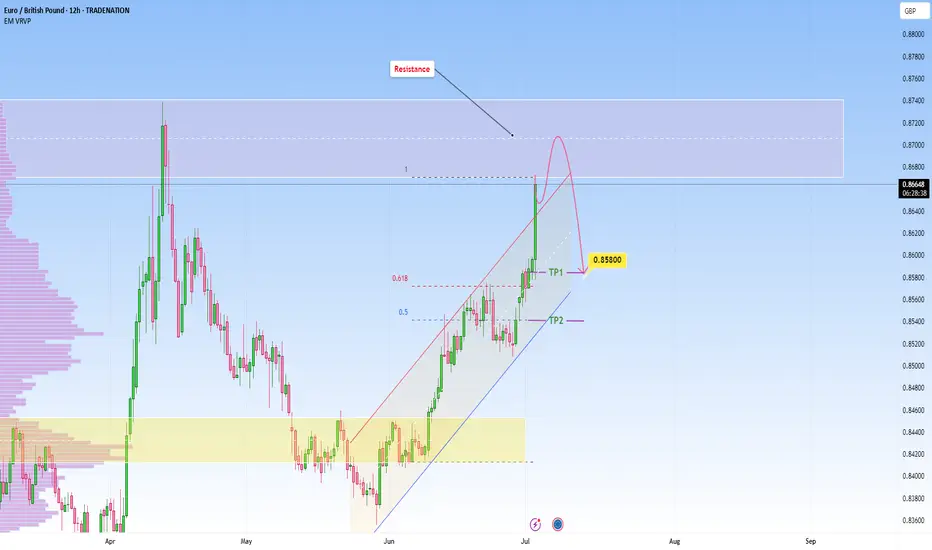
EURGBP reached strong resistance: Likely reversal incomingPrice has been in a strong impulsive rally, pushing aggressively into a well established resistance zone. This zone is marked by a prior sharp sell-off, suggesting it could trigger selling interst again.
The current move appears overextended in the short term. The ascending channel is extremly vert
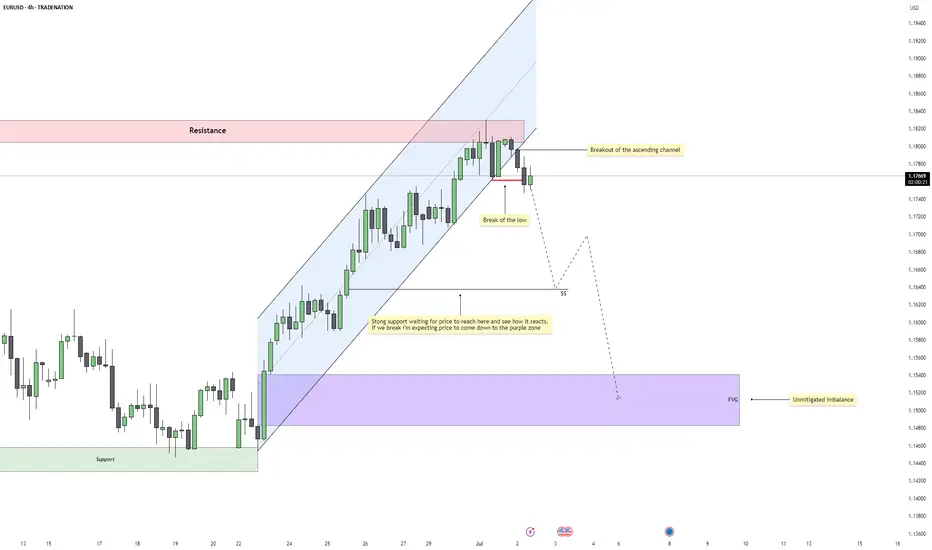
EURUSD – Bearish Reversal Confirmed After Structural BreakEURUSD has shifted out of its bullish environment after a sustained rally inside a clean ascending channel. Price recently rejected a resistance zone that capped previous buying pressure and has now started to rotate downward. This marks the first serious challenge to the trend and sets the tone for
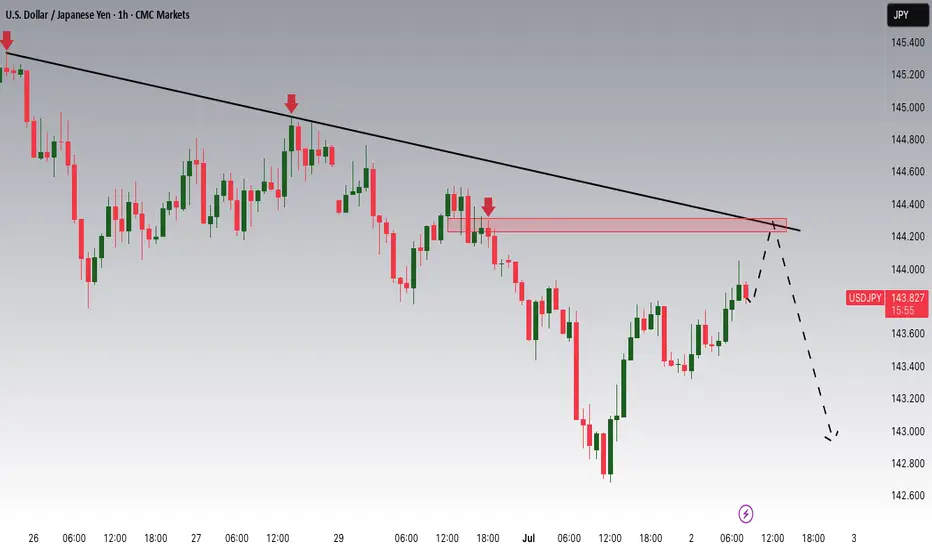
USDJPY Potential DownsidesHey Traders, in today's trading session we are monitoring USDJPY for a selling opportunity around 144.200 zone, USDJPY is trading in a downtrend and currently is in a correction phase in which it is approaching the trend at 144.200 support and resistance area.
Trade safe, Joe.
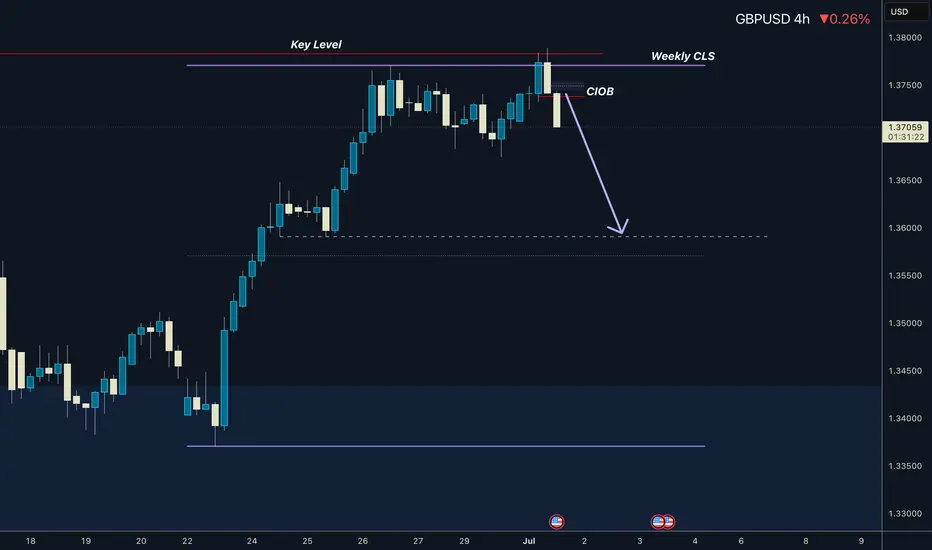
GBPUSD I Weekly CLS I Model 1 I Target 50%Hey, Market Warriors, here is another outlook on this instrument
If you’ve been following me, you already know every setup you see is built around a CLS Footprint, a Key Level, Liquidity and a specific execution model.
If you haven't followed me yet, start now.
My trading system is completely
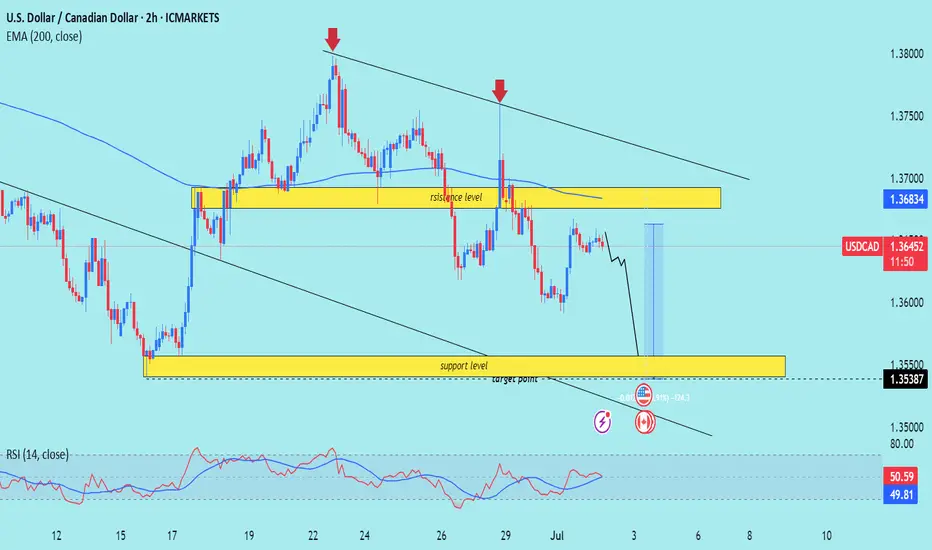
USD /CAD) bearish reversal analysis Read The captionSMC trading point update
Technical analysis of USD/CAD pair on the 2-hour timeframe, suggesting that the price is likely to drop toward the support zone. Here's the detailed idea behind the analysis:
---
Chart Breakdown (2H – USD/CAD)
1. Resistance Zone (Yellow Box - Top):
Marked as a st
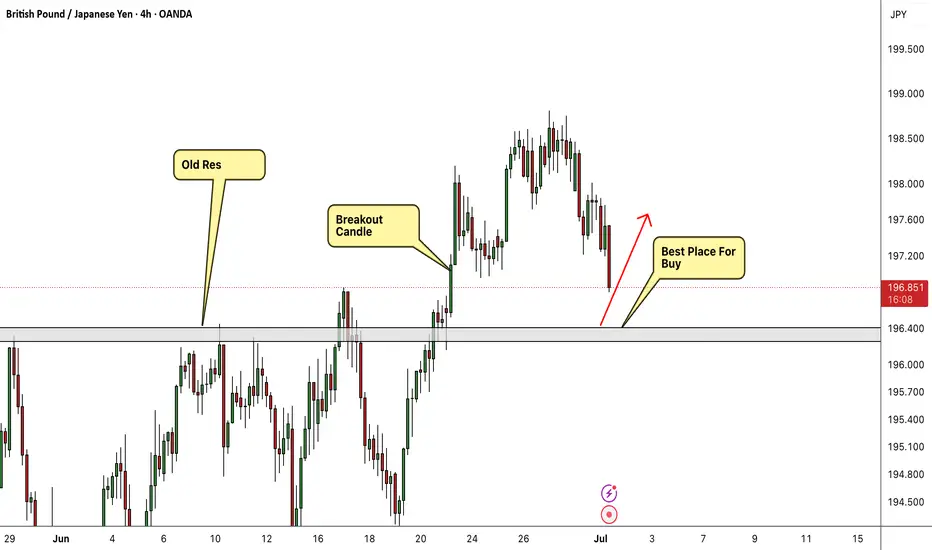
GBP/JPY Best Place To Buy Very Clear , Let`s Get This 200 Pips !Here is my 4H T.F Chart and if we check we will see that we have a very good support area very near the price now and we have already a good breakout and the price never retest the broken res and new supp so i`m waiting the price to retest it and give me any bullish price action and then we can buy
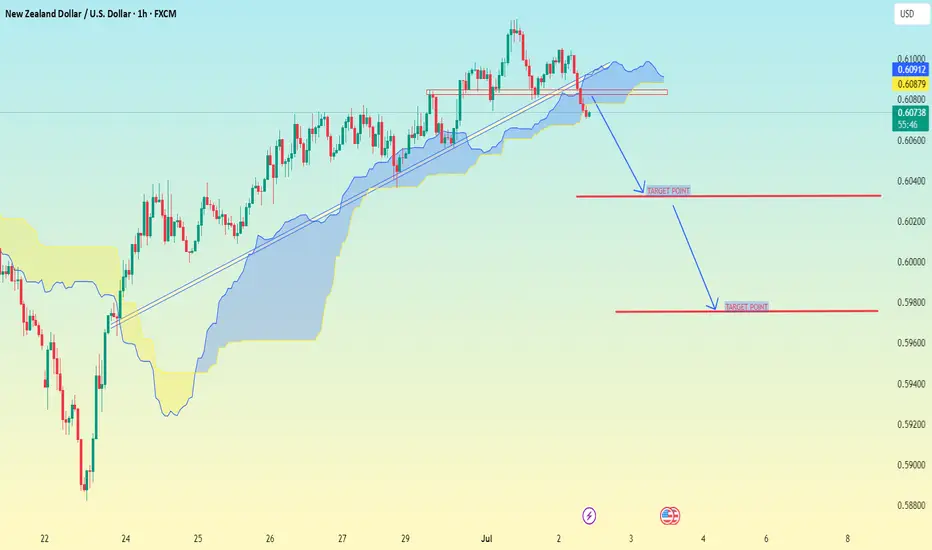
NZD/USD(New Zealand Dollar vs US Dollar) chart on the 1H timefrm NZD/USD (New Zealand Dollar vs US Dollar) chart on the 1H timeframe:
Price has broken below the ascending trendline and is now trading below the Ichimoku Cloud, confirming bearish momentum.
You already have clear two downside target levels marked on the chart.
Based on your chart:
✅ First Targ
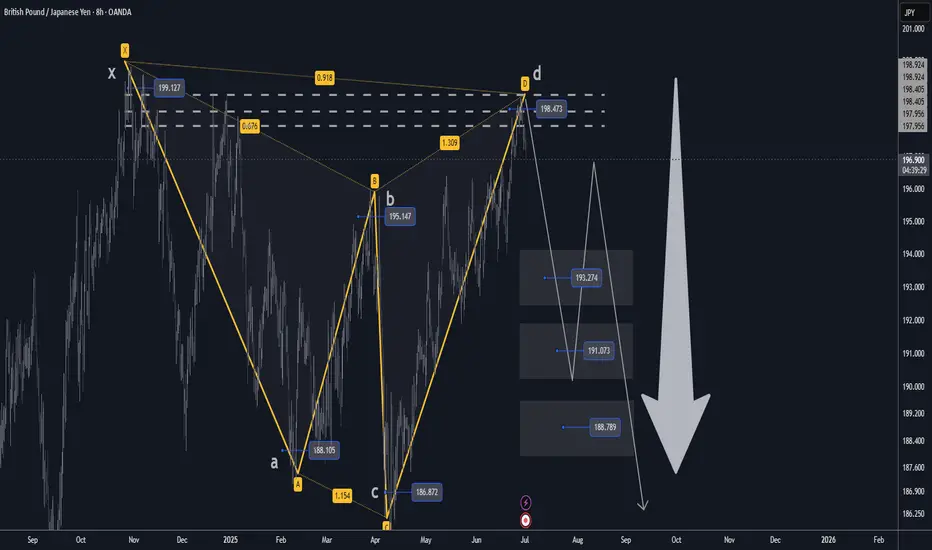
GBPJPY H4 XABCD Short at Market TP Below Market🔸Hello traders, let's review the 4 hour chart for GBPJPY. Strong gains off the lows recently, however price getting overextended and expecting reversal later at/near PRZ/D.
🔸Speculative XABCD structure defined by point X 199 point A 188 point B 195.20 point C 186.80 point D/PRZ 198.40/80 .
🔸Curren
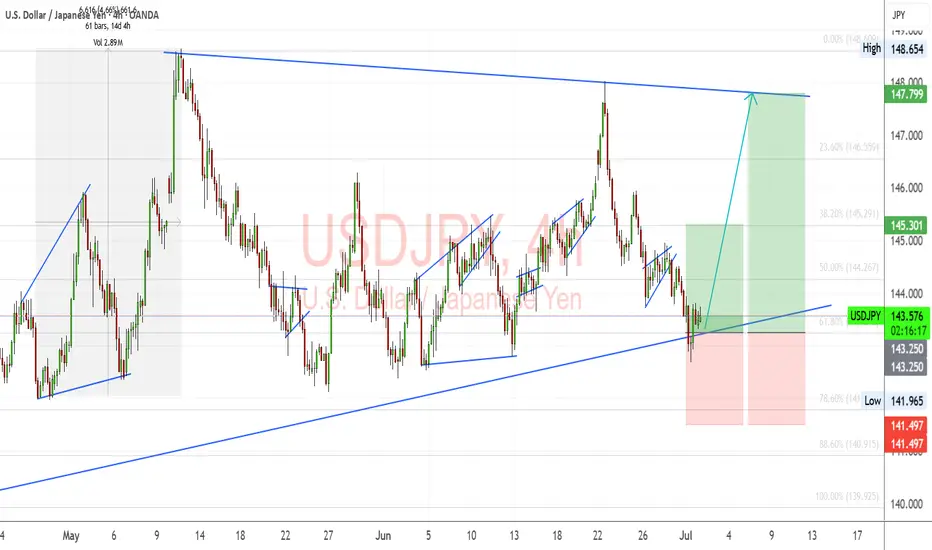
USDJPY – Key Support Bounce with Macro TailwindsUSDJPY is bouncing off a key trendline and 61.8% Fib zone (143.25–143.60) with confluence across multiple JPY crosses (EURJPY, AUDJPY, CADJPY). This area has historically triggered strong upside momentum, and the current setup aligns with both technical structure and macro drivers.
📊 Fundamentals S
See all forex ideas
| - | - | - | - | - | - | - | ||
| - | - | - | - | - | - | - | ||
| - | - | - | - | - | - | - | ||
| - | - | - | - | - | - | - | ||
| - | - | - | - | - | - | - | ||
| - | - | - | - | - | - | - | ||
| - | - | - | - | - | - | - | ||
| - | - | - | - | - | - | - |
Trade directly on the supercharts through our supported, fully-verified and user-reviewed brokers.


