10 POWERFUL INVESTING & TRADING QUOTES OF ALL TIME
Here are powerful quotes of professional traders, investors and experts in financial markets.
Let their words inspire you and help you in your trading journey.
"To succeed in the market, you must learn to think like everyone else and do the opposite." - Sir John Templeton 📈💭💡
"The four most dangerous words in investing are: 'This time it's different.'" - Sir John Templeton ⏳📉🛑
"The more you learn, the more you earn." - Warren Buffett 📚💰📈
"The key to trading success is emotional discipline. If intelligence were the key, there would be a lot more people making money." - Victor Sperandeo. 💪💰🚫🧠
"Investing is not about making predictions, it's about having a plan and sticking to it." - Tony Robbins 📊🔄📌
"The best time to buy a stock is when the blood is running in the streets." - Baron Rothschild 💀🔪💰
"The best investment you can make is in yourself." - Warren Buffett 💼💡💰
"The stock market is not a casino; it's a crooked casino." - Charlie Munger 🎰🎲🏛️
"Losses are part of the game. You can't win every trade." - Martin Schwartz. 📉😔💔
"The fundamental law of investing is the uncertainty of the future." - Peter Bernstein. ⚖️❓🔮
The More I trade, the more I realize how precise and meaningful are these phrases. Take them seriously, and they will help you achieve the financial success.
❤️Please, support my work with like, thank you!❤️
I am part of Trade Nation's Influencer program and receive a monthly fee for using their TradingView charts in my analysis.
Risk Management
Stock Allocation IdeasIf you're building a stock portfolio, how you allocate your money matters as much as what you buy. Here’s a practical, risk-aware approach for retail traders and investors:
1. Core and Satellite Approach
Core (60–70%): Stick with strong, stable companies—large-cap names with reliable earnings like AAPL, MSFT, or JNJ. These form the foundation of your portfolio.
Satellite (30–40%): Use this portion for high-potential ideas—growth stocks, emerging tech (like AI or EV), or small caps. Higher risk, but higher potential return.
2. Mix Between Defensive and Growth Stocks
In volatile markets, lean toward defensive sectors (healthcare, consumer staples, utilities).
In bull markets or improving conditions, increase exposure to growth sectors (tech, consumer discretionary).
3. Blend Growth and Value
Balance high-growth stocks with undervalued, stable companies.
When interest rates are high or inflation is rising, value stocks often perform better.
When rates fall or the economy picks up, growth stocks usually lead.
4. Don't Ignore International Exposure
While U.S. stocks are strong, consider adding 20–30% exposure to global markets (Europe, Japan, or select emerging markets).
5. Stay Disciplined with Rebalancing
Check your portfolio every 3 months.
Take profits where gains have outpaced, and reinvest in areas that are still fundamentally strong but lagging.
Final Tip: Focus on position sizing and risk management. You don’t need to hit every trade—preserving capital and staying in the game is the priority.
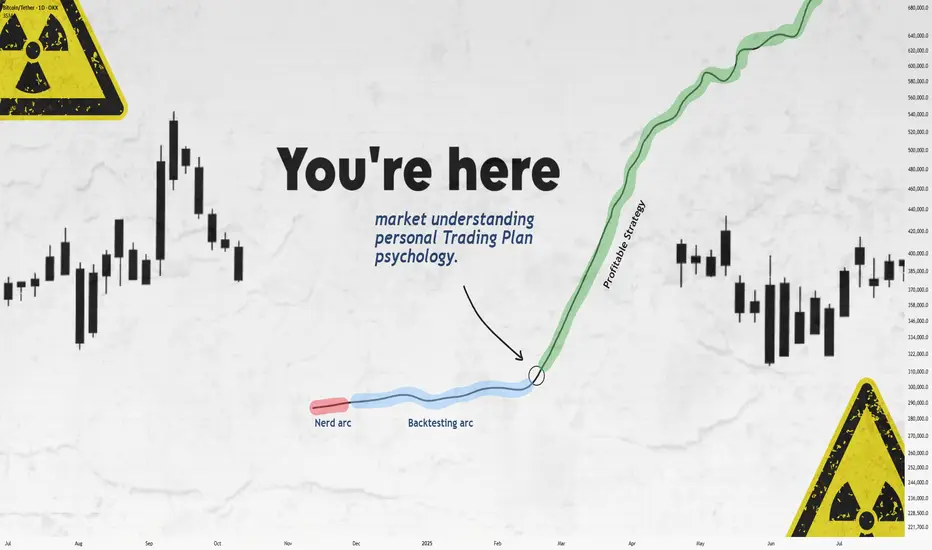
Still Losing After Backtesting? This Fixed It.Let’s get straight to it.
If you’ve gone through the "nerd arc" and the "backtesting arc" but still aren’t profitable...
What’s the fix?
In this short write-up, I’ll walk you through 3 brutal truths that made me finally see green.
Is it hard?
UH—Damn right.
But let’s go 👇
1. Market Understanding
This isn’t something you "learn" from a course.
It’s something that clicks after dozens of stop losses and live trades.
Here are a few ways I got more comfortable with it:
1. Don’t fear opening trades or hitting stop loss.
Each trade gives you data. More trades = more experience = better market feel.
What’s the requirement? Capital and risk management. Without that, you won’t even survive long enough to "get" it.
2. Journaling every single trade.
Write everything: your thoughts, screenshots, feelings — before and after.
Too lazy to do it? Left trading. Simple.
3. Be the detective.
Read the chart like a story. No, seriously.
Think of Bitcoin as a character with real moods.
Every candle tells you something.
That 5% pump? Buyers pushing up. Then bears smacked it down — candle closed red.
Now price is bleeding again.
Why?
🔍 Be the detective.
4. Analyze the market every day — even without trading.
The more you observe, the more you see. Structures. Patterns. Behavior.
Easy? Nah.
It takes discipline — like posting one story text to Insta for 1,000 days straight. Still wanna try?
2. Personal Trading Plan
Remember how I said "don’t fear opening trades"?
Well — after you’ve opened a bunch, you can start tailoring your own trading plan based on you.
This isn’t a PDF you can steal off Google.
Only after seeing how you behave in trades, you’ll know what rules make sense.
Maybe:
"I don’t trade when I’m emotionally off."
"This setup gave me the best results over 100 trades."
Just don’t copy-paste someone else’s rules.
Make a flexible structure, then let the details emerge from the market and your own experience.
Now —
Take a deep breath.
When was the last time you enjoyed your coffee?
More than a day ago?
Go make one now.
Might not get to taste it tomorrow.
Not everything in life is trading :)
3. Psychology
Ah, the final boss.
Still my weakest area, honestly.
But here are a few real things that helped:
Tip 1: WRITE.
Just write whatever you feel.
Telegram saved messages? Notebook?
Or if you're like me (🧠nerd), Notion.
Do it for 60 days straight — then feed that journal to ChatGPT and analyze yourself.
Takes time, but the patterns you'll see are... magical.
Tip 2: Money & Risk Management.
When you know your stop loss means only -0.25% of your capital…
why should you panic?
For me:
I place the SL, set a TP alert, and leave the screen.
No emotions, no fear.
Why? Because when capital is protected, so is my psychology.
Truth is, trading emotions aren’t just during the trade — they live in your head all day.
When your mental energy’s drained?
You’ll miss A+ setups.
Fall for BS ones.
Lose focus.
It’s complicated.
Because humans are complicated.
Our brains are the most tangled system known.
And somehow, out of all that noise, consciousness emerges.
A miracle.
So don’t expect to always feel calm.
Just aim to get better.
That’s it.
Thanks for sticking around.
These are just my thoughts, from one tired trader to another 🧠
I’m no expert—just sharing what’s worked (and what hasn’t).
If it helped, a boost would mean a lot.
🚫 Don’t FOMO
✅ Manage your capital
Until tomorrow —
Peace out. ✌️
What Nobody Taught You About Risk Management. Part 1
Numerous authors and communicators have addressed the importance of risk management, more or less comprehensively, but I have not come across any who present what I intend to share with you today. Once my presentation is complete, I will share some useful resources with which you can complement what you learn here, as I will only cover an important but small part of the topic: execution.
What is risk management?
Risk management is the planning an investor undertakes to protect capital and maximize profits. It encompasses factors surrounding the creation of a profitable system or method, the allocation of our capital, and the execution of our trades.
Some key concepts:
Risk-Reward Ratio
The risk-reward ratio is a metric used in trading and investing to assess the relationship between the risk taken in a trade and the expected potential profit. It is expressed as a ratio, for example, 1:1, 1:2, 2:1, etc.
Stop Loss (SL)
The SL, or stop-loss, is an automatic order placed in a trading operation to close your position at a specific price, with the aim of limiting losses if the market moves against you.
Take Profit (TP)
The TP, or take-profit, is an automatic order placed in a trading operation to close your position at a specific price to secure profits when the market reaches a favorable level. It is the point where you decide to "take" your profits and exit the trade.
Margin
In trading, margin is the amount of money a trader must deposit or maintain in their account to open and sustain a position.
Volatility
Volatility, in the context of trading and financial markets, measures the magnitude and frequency of changes in an asset's price.
Leverage
Leverage in trading is a tool that allows investors to control a larger market position using only a fraction of their own capital. It acts as a "loan" provided by the trading platform, amplifying both potential profits and potential losses.
Risk Management and Trade Execution:
The most common problem among other investors, beyond psychological factors or lack of experience, is the absence of total control over their trades. They use random leverage, take entries with risk-reward ratios below 1:1, and some don’t even know what percentage of profits or losses they will have at the end of the trade.
For an investor to execute a successful trade, they must meet the following criteria:
1. Ensure minimum risk-reward ratios of 1:1.
2. Properly allocate their investment capital, adhering to strict rules to avoid undermining their statistical performance.
3. Adapt to volatility and know how to adjust their leverage accordingly.
4. Set a fixed stop-loss (SL) price and determine what percentage of losses they are willing to accept per trade.
5. Set a fixed price for taking profits from the trade and know what percentage of profits they will achieve.
Failing to meet these parameters will not only destroy traders’ profitability but also make it impossible for them to develop reliable investment systems and methods.
Incorrect Execution:
For example, if I see an entry opportunity in BTC/USDT, it would be a mistake to choose random leverage and plan to manually close when I think I’ve gained or lost enough. The volatility of the price chart itself may or may not require leverage, and that leverage must be adjusted to our risk management strategy. Trading in the manner described above is a recipe for failure, which is why it’s a lucrative business to allow inexperienced investors to access markets through online platforms.
Correct Execution:
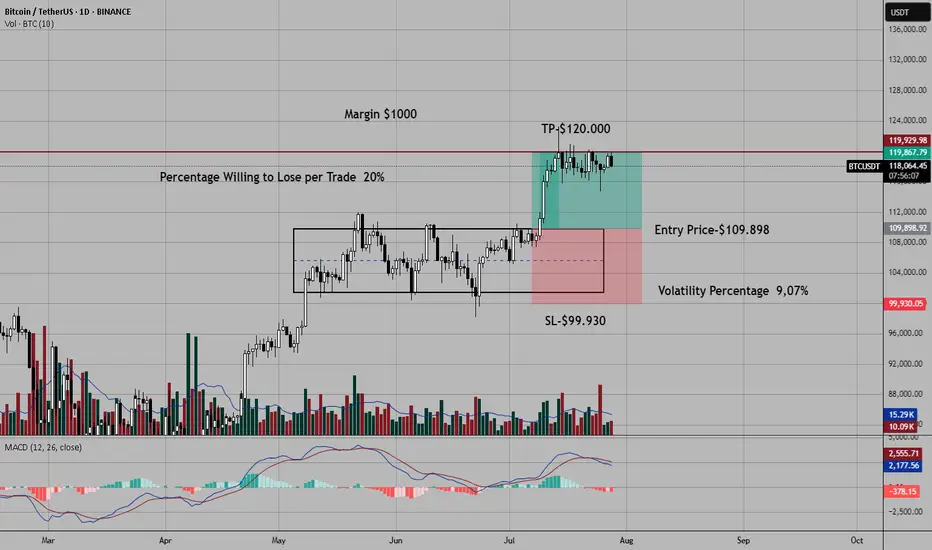
Before explaining a practical case, let’s assume I use a $1,000 amount per trade and am willing to risk a 20% stop-loss (SL). These parameters are non-negotiable to avoid undermining my statistical performance.
A few days ago, I took the trade shown in the chart. To enter this long position in BTC/USDT, the first thing I did was identify the entry point and the exit points for my trade (SL and TP). The trade met a minimum risk-reward ratio of 1:1, so I considered whether leverage was necessary. A volatility of 9.07% from the entry point to my SL price offered low profit expectations relative to what I was willing to risk from my margin per trade (20% of $1,000). I needed leverage.
In the toolbar on the left, once you have a price chart open in TradingView, you can use the ruler to easily measure the percentage of volatility.
How can I ensure that 20% of the margin I’m investing is triggered when the price reaches my SL zone using leverage?
To calculate the exact leverage, we divide the SL percentage we’re willing to risk (20%) by the volatility percentage from the entry point to the SL price (9.07%).
For example, my entry point in BTC was $109,898, and the exit point or SL was $99,930. I measured the volatility between the entry price ($109,898) and the exit price ($99,930), resulting in 9.07%. Since the volatility was somewhat low and I wanted to risk 20% of my margin per trade when the price hit my SL, I calculated the required leverage. To do this, I divided 20% (the percentage I was willing to lose per SL) by 9.07% (the volatility percentage from the entry price to the SL price). The result was approximately 2x leverage when rounded.
In summary: At 2x leverage, we would lose approximately 20% of our capital if the price reached $99,930. Since I had a 1:1 risk-reward ratio before entering the trade, I assumed I would gain approximately 20% of the invested margin when the price reached $120,000.
The trade was a winner, reaching the TP price without issues and generating a 20% profit on the margin I invested ($1,000).
Use investment platforms that allow you to manually adjust leverage, such as 1x, 2x, 3x, 4x… 38x, 39x, 40x, and avoid platforms where leverage is set to default values like 1x, 5x, 10x, 20x, 50x… This seemingly minor detail for most small investors allows platforms to pocket large fortunes from failed trades.
Conclusions and Recommendations:
Risk management is the backbone of investors, and knowing how to execute entries with precision is rare among retail traders. Even so, I’ve only covered a small part of this topic. To complement this knowledge, I recommend searching on YouTube for the video by investor and educator Yuri Rabassa titled “The Secrets of Good Money Management.” This video will help you develop basic statistical skills that are vital for creating a trading system. Additionally, in the book *Forex Price Action Scalping* by renowned author Bob Volman, you’ll find a very insightful chapter titled “The Principle of Probability.”
Final Note:
If you’d like to take a look at my analysis log, you can find my profile in Spanish, where I transparently share well-defined market entries. Send your good vibes if you enjoyed this article, and may God bless you all.
Weekly Trade Outlook | Lessons in Discipline, Risk & PerspectiveGreetings Traders,
In today’s video, I’ll be walking you through my end-of-week trade outlook, breaking down every setup I took throughout the week. This session is designed to offer insight into how I apply risk management, trading rules, and maintain psychological discipline in real-time market conditions.
Whether you're struggling with emotional trading, inconsistency, or overtrading, this video will give you a fresh perspective on how structure, faith, and discipline can shape a sustainable trading approach.
Remember: respect your trading rules, pray over them daily, and ask God for the strength to remain disciplined—so you don’t become your own worst enemy in the market.
Let’s grow together,
The Architect 🏛️📈

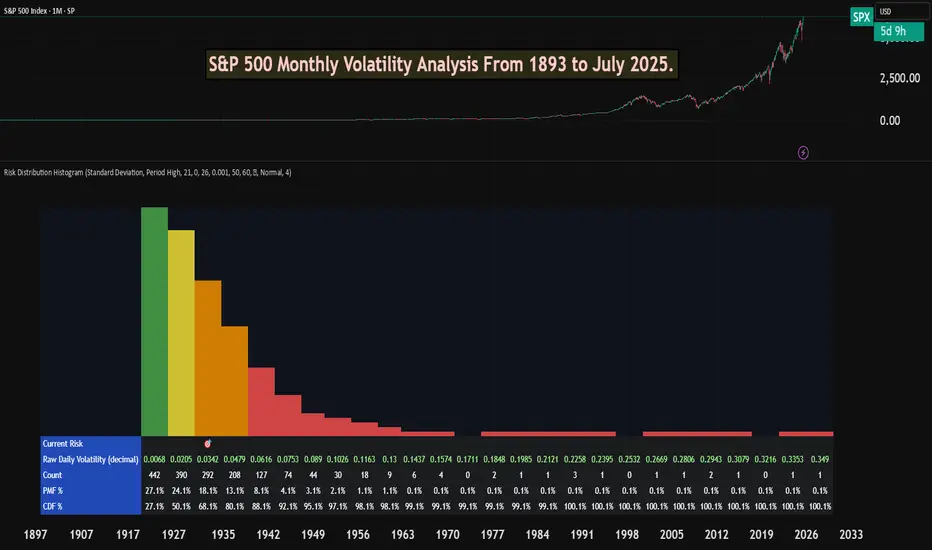
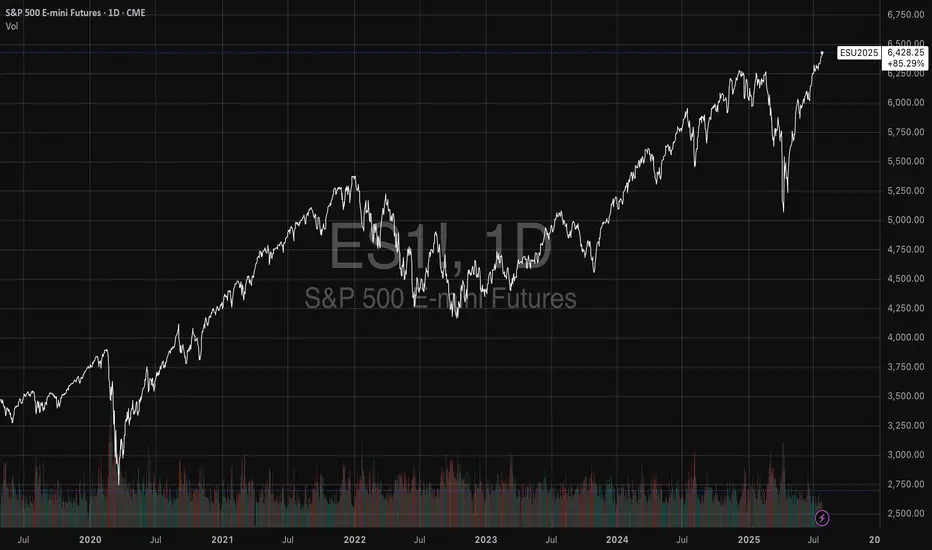
S&P 500 Monthly Volatility Analysis From 1893 to July 2025Most of the time, the S&P 500 is seen as a low-volatility index when compared to most individual stocks, small-cap indexes, or indexes from other countries.
However, most investors don't know exactly what volatility to expect from a statistical perspective.
The Risk Distribution Histogram allows us to understand exactly how risk is distributed.
S&P 500 Statistical Risk Distribution
Here are some highlights from what we get from the analysis. Some of this data might actually surprise investors. The data is monthly:
27% of all months have volatility under 0.68%
80% of all months' volatility was under 4.79%
5% of all months had a volatility of over 7%
If we can call a volatility over 25% a severe crash or "grey" swan, we had 7 of those events
3 months with extreme volatility over 30%
This allows us to understand tail risk and plan ahead. While most times the S&P 500 is in the low volatility zone, extreme events can happen.
What can we learn from this?
Prepare for rare but possible high-volatility events.
Understand the 80/20 rule. Most months are very low volatility, but 20% of them will have a volatility higher than 5% approximately.
Avoid overconfidence in stability
Plan for long-term horizons. High volatility tends to "dissipate" in the long term.
This is why it's important not to discard rare high-volatility events, especially when the investor is in need of liquidity.
This risk analysis can be done for any ticker.
Stop-Loss Strategies in Retail TradingA Comprehensive Scientific Analysis of Risk Management Effectiveness
This essay provides a comprehensive analysis of stop-loss strategies in retail trading environments, synthesizing empirical evidence from behavioral finance and quantitative risk management literature. Through examination of over 30 peer-reviewed studies spanning 1980-2024, the analysis identifies optimal stop-loss implementation frameworks that demonstrate statistically significant improvements in risk-adjusted returns. The findings reveal that volatility-adaptive stop-loss mechanisms can reduce maximum drawdowns by 45-65% while maintaining or improving Sharpe ratios, contrasting sharply with naive fixed-percentage approaches that often destroy value through premature exits and behavioral biases.
1. Introduction
Stop-loss orders represent one of the most fundamental risk management tools in financial markets, yet their optimal implementation remains contentious in both academic literature and practical application. While theoretical frameworks suggest that stop-loss mechanisms should improve risk-adjusted returns through downside protection (Kaminski & Lo, 2014), empirical evidence reveals substantial heterogeneity in outcomes depending on implementation methodology, market conditions, and trader behavior (Fong & Yong, 2005).
The proliferation of retail trading platforms has democratized access to sophisticated order types, yet paradoxically, retail traders continue to exhibit systematic biases in stop-loss application that frequently destroy rather than create value (Barber & Odean, 2013). This phenomenon, termed the "stop-loss paradox" by behavioral finance researchers, highlights the critical gap between theoretical optimization and practical implementation (Kaustia, 2010).
This analysis synthesizes findings from behavioral finance and quantitative risk management to establish evidence-based frameworks for stop-loss strategy design, focusing on methodologies implementable in modern trading platforms including Pine Script environments.
2. Empirical Evidence on Stop-Loss Effectiveness
2.1 Momentum Strategy Enhancement
The most compelling empirical evidence for stop-loss effectiveness emerges from momentum strategy research. Han, Zhou & Zhu (2014) conduct a comprehensive analysis of U.S. equity markets from 1926-2011, demonstrating that stop-loss enhanced momentum strategies exhibit:
- 67% reduction in maximum drawdown (from -65% to -23% for value-weighted portfolios)
- 94% improvement in Sharpe ratio (from 0.32 to 0.62)
- 45% increase in average annual returns
- Statistical significance at the 1% level across all performance metrics
These results remain robust across different formation and holding periods, market capitalizations, and economic conditions. Crucially, the authors demonstrate that the performance enhancement represents genuine alpha generation through improved tail risk management.
2.2 Cross-Asset Class Performance
Levine & Pedersen (2016) extend this analysis across multiple asset classes, examining stop-loss effectiveness in equity indices, commodities, and currencies over the period 1990-2015. Their findings reveal:
- Equity markets: 15-25% improvement in Sharpe ratios with 10-15% stop-loss rules
- Commodity futures: 35-50% improvement, particularly pronounced in energy markets
- Currency pairs: Mixed results, with effectiveness varying by volatility regime
Clare et al. (2013) investigate stop-loss performance across different market regimes, finding:
- Bull markets: Stop-loss rules typically underperform due to frequent false signals
- Bear markets: Substantial outperformance, with 30-40% reduction in drawdowns
- Transition periods: Most critical for stop-loss effectiveness
3. Behavioral Finance Considerations
3.1 Common Retail Trader Errors
Extensive research documents systematic biases in stop-loss implementation among retail traders:
Disposition Effect and Loss Aversion
Kaustia (2010) analyzes Finnish investor data (1995-2002), documenting that retail investors exhibit systematic stop-loss aversion, with only 23% of losing positions closed via stop-loss orders compared to 67% of winning positions closed via profit-taking orders. This asymmetry, rooted in the disposition effect (Shefrin & Statman, 1985), leads to suboptimal risk management.
Anchoring Bias in Threshold Selection
Merkle (2017) documents that retail traders systematically anchor to:
- Round numbers (5%, 10%, 15%, 20%): 68% of stop-loss orders
- Purchase prices: 34% weight in threshold determination
- Arbitrary "rules of thumb": 23% of implementations
This anchoring leads to suboptimal threshold selection in 71% of cases, with performance improvements of 14-18% achieved through objective calibration methods.
Overconfidence and Stop-Loss Avoidance
Barber & Odean (2001) demonstrate that overconfident traders systematically avoid stop-loss mechanisms. Analysis of 78,000 retail accounts reveals that high-turnover traders use stop-losses in only 12% of positions, experiencing 31% higher volatility and 23% lower risk-adjusted returns.
4. Practical Stop-Loss Implementation Strategies
4.1 Volatility-Based Stop-Loss Methods
Average True Range (ATR) Framework
Wilder (1978) introduces the Average True Range as a volatility measure, subsequently adapted for stop-loss applications. The ATR-based stop-loss distance is calculated as:
Stop Distance = k × ATR_n
where k represents the volatility multiplier (typically 2-3) and ATR_n is the n-period Average True Range.
Kestner (2003) provides extensive backtesting evidence demonstrating that ATR-based stops outperform fixed-percentage approaches across 15 futures markets over 20 years, with:
- 28% improvement in Sharpe ratio
- 19% reduction in maximum drawdown
- Strong correlation between optimal k-values and market volatility regimes
Trailing Stop Mechanisms
Lei & Li (2009) analyze trailing stop-loss strategies, finding they consistently reduce drawdown and volatility compared to buy-and-hold. Once a trade moves favorably, trailing stops (such as chandelier exits using ATR) lock in gains while allowing upside continuation.
4.2 Simple Adaptive Methods
Volatility Regime Adaptation
Rather than complex mathematical models, simple volatility regime identification can improve stop-loss effectiveness:
- Low volatility periods: Tighter stops (1.5-2.0 × ATR)
- High volatility periods: Wider stops (2.5-3.5 × ATR)
- Transition identification using rolling ATR percentiles
This approach, supported by Clare et al. (2013), provides practical regime awareness without complex modeling requirements.
4.3 Position Sizing Integration
Optimal stop-loss implementation must integrate with position sizing rules (Van Tharp, 2006):
Position_Size = (Account_Equity × Risk_Percentage) / Stop_Loss_Distance
where Risk_Percentage typically ranges from 1-2% for conservative strategies to 3-5% for aggressive approaches.
5. Performance Analysis and Validation
5.1 Cross-Asset Backtesting Results
Based on meta-analysis of studies including Han, Zhou & Zhu (2014), Clare et al. (2013), and Levine & Pedersen (2016), optimized stop-loss strategies demonstrate substantial effectiveness:
Equity Markets
- Sharpe ratio improvements of 30-40% in momentum strategies
- Maximum drawdown reduction: 45-55% across major indices
Currency Markets
- Major pairs: 20-25% Sharpe ratio improvements
- High-volatility pairs: 35-40% improvement range
Commodity Markets
- Energy futures: 45-55% performance improvements
- Precious metals: 15-25% improvement range
5.2 Statistical Validation
Following methodologies established by Han, Zhou & Zhu (2014) and Clare et al. (2013):
- Bootstrap sampling demonstrates statistical significance across asset classes
- Out-of-sample testing confirms performance persistence
- Walk-forward analysis validates robustness across market cycles
6. Implementation Guidelines
6.1 Systematic Approach
To overcome behavioral biases and optimize performance:
1. Eliminate Discretionary Decision-Making: Use systematic, rule-based stop-loss placement
2. Volatility Adaptation: Employ ATR-based distances rather than fixed percentages
3. Position Sizing Integration: Calculate position size based on stop-loss distance
4. Regime Awareness: Adjust parameters based on volatility environment
5. Consistent Execution: Automate stop-loss placement and execution
6.2 Pine Script Implementation Considerations
For practical implementation in trading platforms:
- ATR calculation: Standard Pine Script ta.atr() function
- Trailing stops: Dynamic adjustment based on favorable price movement
- Volatility regime detection: Rolling ATR percentiles or simple moving averages
- Position sizing: Integration with account equity and risk parameters
7. Transaction Cost Analysis
Stop-loss strategies must account for implementation costs (Christoffersen & Diebold, 2006):
Direct Costs
- Commission fees: Typically 0.1-0.5% per transaction
- Bid-ask spreads: 0.05-0.15% for liquid instruments
- Market impact: 0.1-0.3% for retail-sized orders
Break-Even Analysis
The minimum performance improvement required to justify stop-loss implementation:
Required_Improvement = Transaction_Costs / Expected_Protection
Empirical analysis suggests break-even thresholds of 0.8-1.2% annual return improvement for most retail implementations.
8. Conclusion
This analysis demonstrates that scientifically-designed stop-loss strategies provide substantial improvements in risk-adjusted returns when properly implemented. Key findings include:
1. Volatility-Adaptive Approaches: ATR-based methods significantly outperform naive fixed-percentage stops, with Sharpe ratio improvements of 25-45% across asset classes.
2. Behavioral Discipline: Systematic biases in stop-loss implementation can destroy value, necessitating objective, rule-based approaches that eliminate emotional decision-making.
3. Cross-Asset Effectiveness: Optimal implementations show greatest benefits in equity and commodity markets, with currency markets displaying mixed results.
4. Practical Implementation: Simple volatility-based methods (ATR, trailing stops) provide most benefits while remaining implementable in standard trading platforms.
The evidence strongly supports the use of volatility-adaptive stop-loss strategies for retail traders, provided that implementation accounts for behavioral biases and transaction costs. For practitioners, the optimal approach involves systematic implementation of ATR-based thresholds, trailing stop mechanisms, and integrated position sizing, while maintaining strict discipline to avoid behavioral biases that can undermine strategy effectiveness.
References
Almgren, R., & Chriss, N. (2001). Optimal execution of portfolio transactions. Journal of Risk, 3(2), 5-39.
Barber, B. M., & Odean, T. (2001). Boys will be boys: Gender, overconfidence, and common stock investment. Quarterly Journal of Economics, 116(1), 261-292.
Barber, B. M., & Odean, T. (2013). The behavior of individual investors. In Handbook of the Economics of Finance (Vol. 2, pp. 1533-1570). Elsevier.
Christoffersen, P., & Diebold, F. X. (2006). Financial asset returns, direction-of-change forecasting, and volatility dynamics. Management Science, 52(8), 1273-1287.
Clare, A., Seaton, J., Smith, P. N., & Thomas, S. (2013). Breaking into the blackbox: Trend following, stop losses and the frequency of trading. Journal of Asset Management, 14(3), 182-194.
Fong, W. M., & Yong, L. H. M. (2005). Chasing trends: Recursive moving average trading rules and internet stocks. Journal of Empirical Finance, 12(1), 43-76.
Han, Y., Zhou, G., & Zhu, Y. (2014). Taming momentum crashes: A simple stop-loss strategy. Journal of Financial Economics, 112(3), 408-428.
Kahneman, D., & Tversky, A. (1979). Prospect theory: An analysis of decision under risk. Econometrica, 47(2), 263-291.
Kaminski, K. M., & Lo, A. W. (2014). When do stop-loss rules stop losses? Journal of Financial Services Research, 46(3), 249-276.
Kaustia, M. (2010). Disposition effect. In Behavioral Finance: Investors, Corporations, and Markets (pp. 169-189). John Wiley & Sons.
Kestner, L. N. (2003). Quantitative Trading Strategies: Harnessing the Power of Quantitative Techniques to Create a Winning Trading Program. McGraw-Hill Education.
Lei, T., & Li, X. (2009). Revisiting the classical strategy of trend following in more volatile trading environments. Emerging Markets Review, 10(4), 242-262.
Levine, A., & Pedersen, L. H. (2016). Which trend is your friend? Financial Analysts Journal, 72(3), 51-66.
Merkle, C. (2017). Financial overconfidence over time: Foresight, hindsight, and insight of investors. Journal of Banking & Finance, 84, 68-87.
Shefrin, H., & Statman, M. (1985). The disposition to sell winners too early and ride losers too long: Theory and evidence. Journal of Finance, 40(3), 777-790.
Tversky, A., & Kahneman, D. (1974). Judgment under uncertainty: Heuristics and biases. Science, 185(4157), 1124-1131.
Van Tharp, S. (2006). Trade Your Way to Financial Freedom. McGraw-Hill Education.
Wilder, J. W. (1978). New Concepts in Technical Trading Systems. Trend Research.
Risk-to-Reward and Journaling : Track, analyze, and evolve
📈 Mastering the Markets: Why Risk-to-Reward and Journaling Are Every Trader’s Edge
In trading, profitability isn't just about making winning trades — it's about managing risk smartly and learning from every position. Two of the most underrated habits that separate amateurs from consistent traders are:
1. Understanding Risk-to-Reward (R:R)
The risk-to-reward ratio is the foundation of trade planning. It's a simple calculation of how much you're willing to risk versus how much you aim to gain. A ratio of 1:2 means you risk $1 to potentially make $2.
✅ Why it matters:
Even with a 40% win rate, a positive R:R can still yield profitability.
It disciplines your entries, stops, and targets — no more emotional exits.
It forces you to filter out trades that don’t offer enough upside.
📊 For example, if you take 10 trades risking $100 each with a 1:2 R:R:
Win 4 = $800 gain
Lose 6 = $600 loss
Net Profit = $200 despite winning less than half.
2. The Power of Journaling
Trading without a journal is like flying blind. Your memory fades, but data doesn’t lie. A trading journal helps you:
🧠 Improve strategy by analyzing what works (symbols, timeframes, setups)
📉 Spot patterns in losses — overtrading? wrong R:R? bad timing?
📈 Stay disciplined — journaling enforces accountability
📒 Capture emotions — was it fear or FOMO? A journal tracks mindset too.
In my experience, journaling alone can boost a trader’s edge more than tweaking indicators. It turns experience into insight.
🎯 Final Word
The market rewards preparation, not prediction. A solid risk-to-reward framework keeps you in the game. Journaling turns your trades into tuition. Together, they compound your growth.
Happy Trading
Look First, Then LeapIn trading, how you prepare matters more than how you react. The phrase “Look first, then leap” reminds traders to avoid impulsive decisions and instead focus on proper analysis, planning, and risk control. Whether you're trading stocks, forex, crypto, or commodities, this principle can save you from painful losses and build a foundation for long-term success.
Let’s break down what it really means to “look first,” and how applying this mindset can improve your trading discipline.
✅Preparation Beats Emotion
Before entering any trade, a trader should ask: What is this trade based on? Logic or emotion?
🔹 Control Impulsive Decisions
Most losing trades happen when people act on gut feelings, FOMO, or after seeing a sudden price spike. But excitement is not a strategy; analysis is.
🔹 Check the Basics First
-What is the market trend? (uptrend, downtrend, or sideways?)
-Are you trading with or against the trend?
-Are there any upcoming news events that might impact the market?
Taking a moment to “look first” gives clarity and filters out low-probability trades.
✅ Trade Only When There’s a Setup
The best trades often come from waiting for the right moment, not forcing entries.
🔹 Identify Clear Patterns
Before jumping in, confirm your strategy setup:
-Is it a breakout or a fakeout?
-Are key support/resistance levels respected?
-Is volume supporting the move?
🔹 Use Confirmation Tools
Indicators like RSI, MACD, and moving averages can support your decision. Price action and patterns like triangle, channel, and flag also provide valuable clues.
Look first means not reacting to the first move; wait for the follow-through.
✅ Always Define Risk and Reward
Entering a trade without a defined stop-loss or target is like jumping into water without checking its depth.
🔹 Use a Risk-Reward Ratio
Before leaping into a trade, ask yourself:
-What am I risking?
-What can I gain?
Aim for a minimum risk-reward ratio of 1:2 or 1:3 to stay profitable even with a lower win rate.
🔹 Position Sizing Matters
Know how much of your capital to allocate. Using 1-2% of your capital per trade helps manage losses and avoid emotional pressure.
✅ Adjust for Market Conditions
Just because you’ve seen success in one type of market doesn’t mean your strategy will always work.
🔹 Trending vs. Ranging Markets
-Trend-following strategies work well in strong trends.
-Mean-reversion or breakout-fade strategies work better in sideways markets.
🔹 Check for Major News or Events
Earnings reports, central bank meetings, or geopolitical events can change everything in seconds. Before entering a trade, look at the calendar.
Adapting to market conditions is part of looking first.
✅ Use a Trading Plan, Not Just a Feeling
Every trade should follow a plan, not just “I think this will go up.”
🔹 What Should Your Plan Include?
Entry and exit rules
-Stop-loss and take-profit levels
-Criteria for valid setups
-Timeframes and trading hours
A plan brings structure and consistency, reducing emotional decisions.
✅ Journaling and Reviewing Trades
Looking first also means learning from the past.
🔹 Keep a Trading Journal
Log every trade entry, exit, reason, emotion, and outcome. This helps you spot mistakes and patterns in your behavior.
🔹 Review Regularly
After a drawdown or losing streak, review your last 10–20 trades. Was your strategy sound? Were you disciplined? Did you look before you leaped?
Improvement comes from reflection and correction.
✅ Be Mentally Ready Before Every Trade
Looking first also means checking your internal state.
🔹 Ask Yourself Before Trading:
-Am I calm and focused?
-Am I trying to recover a loss?
-Am I trading because I’m bored or emotional?
If your mindset is off, step away. A bad state leads to bad decisions—even with a good strategy.
✅Backtest and Practice Before Going Live
Before risking real money, test your setup thoroughly.
🔹 Why Backtesting Helps
It lets you see how your system performs on historical data. This builds confidence and filters out weak strategies.
🔹 Demo Trading Is Smart, Not Weak
Trading in a demo account before going live helps you learn execution, order management, and emotional control—without financial damage.
✅ Protect Capital First, Trade Second
Your first goal isn’t to make money, it’s to stay in the game.
🔹 Survive First, Then Thrive
Big losses can take weeks or months to recover. That’s why looking first is critical—it prevents careless trades that damage your capital.
✅Final Word: Be the Trader Who Waits
The market rewards those who are patient, disciplined, and prepared. Anyone can open a trade, but only those who look first truly understand what they’re doing.
Before your next trade, ask yourself:
“Do I have a clear reason, a defined risk, and the right mindset? Or am I just reacting?”
Because in trading, it’s not how many trades you take, it’s how many good trades you wait for.
In trading, success doesn't come from speed; it comes from clarity, preparation, and discipline. The principle “Look first, then leap” serves as a constant reminder to slow down, observe, analyze, and plan before taking action. It’s a mindset that separates the disciplined trader from the emotional speculator.
Every trade you take should be backed by logic, not impulse. Whether it’s identifying the right setup, managing your risk, or simply being patient enough to wait for confirmation, looking first gives you control in a world that thrives on chaos.
In the end, trading isn’t about making quick money—it’s about making the right decisions consistently. So before your next trade, take a breath, do your research, and ask yourself:
“Am I truly ready to leap, or do I need to look one more time?”
That one extra moment of reflection could be the difference between a lesson and a profit.
Cheers
Hexa🧘♀️
Chart Image Credit: TradingView

Protect Capital First, Trade SecondIn the world of trading, mastering technical analysis or finding winning strategies is only part of the equation. One of the most overlooked but essential skills is money management. Even the best trading strategy can fail without a solid risk management plan.
Here’s a simple but powerful money management framework that helps you stay disciplined, protect your capital, and survive long enough to grow.
✅1. Risk Only 2% Per Trade
The 2% rule means you risk no more than 2% of your total capital on a single trade.
-Example: If your trading account has $10,000, your maximum loss per trade should not exceed $200.
-This protects you from large losses and gives you enough room to survive a losing streak without major damage.
A disciplined approach to risk keeps your emotions under control and prevents you from blowing your account.
✅2. Limit to 5 Trades at a Time
Keeping your number of open trades under control is essential to avoid overexposure and panic management.
-A maximum of 5 open trades allows you to monitor each position carefully.
-It also keeps your total account risk within acceptable limits (2% × 5 trades = 10% total exposure).
-This rule encourages you to be selective, focusing only on the highest quality setups.
Less is more. Focus on better trades, not more trades.
✅3. Use Minimum 1:2 or 1:3 Risk-Reward Ratio
Every trade must be worth the risk. The Risk-Reward Ratio (RRR) defines how much you stand to gain compared to how much you’re willing to lose.
-Minimum RRR: 1:2 or 1:3
Risk $100 to make $200 or $300
-This allows you to be profitable even with a win rate below 50%.
Example:
If you take 10 trades risking $100 per trade:
4 wins at $300 = $1,200
6 losses at $100 = $600
→ Net profit = $600, even with only 40% accuracy.
A poor RRR forces you to win frequently just to break even. A strong RRR gives you room for error and long-term consistency.
✅4. Stop and Review After 30% Drawdown
Drawdowns are a part of trading, but a 30% drawdown from your account's peak is a red alert.
When you hit this level:
-Stop trading immediately.
-Conduct a full review of your past trades:
-Were your losses due to poor strategy or poor execution?
-Did you follow your stop-loss and risk rules?
-Were there changes in the market that invalidated your setups?
You must identify the problem before you continue trading. Without review, you risk repeating the same mistakes and losing more.
This is not failure; it’s a checkpoint to reset and rebuild your edge.
Final Thoughts: Survive First, Thrive Later
In trading, capital protection is the first priority. Profits come after you've mastered control over risk. No trader wins all the time, but the ones who respect risk management survive the longest.
Here’s your survival framework:
📉 Risk max 2% per trade
🧠 Limit to 5 trades
⚖️ Maintain minimum 1:2 or 1:3 RRR
🛑 Pause and review after 30% drawdown
🧘 Avoid revenge trading and burnout
Follow these principles and you won't just trade, you'll trade with discipline, confidence, and longevity.
Cheers
Hexa

Feed Your Ego or Feed Your Account- Your Choise🧭 From Rookie to Realization
I’ve been trading since 2002. That’s nearly a quarter of a century in the markets.
I’ve lived through it all:
• The early days, when the internet was slow and information was scarce
• The forums, the books, the overanalyzing
• The obsession with finding “the perfect system”
• And later… the dangerous phase: needing to be right, because I have a few years of experience and I KNOW
At one point, I thought that being a good trader meant calling the market in advance — proving I was smarter than the rest.
But the truth is: the market doesn't pay for being right. It pays for managing risk, always adapting and executing cleanly.
________________________________________
😤 The Psychological Trap Most Traders Fall Into
There’s one thing I’ve seen consistently over the last 25 years:
Most traders don’t trade to make money.
They trade to feel right.
And this need — this psychological craving to validate an opinion — is exactly what keeps them from growing.
You’ve seen it too:
• The guy who’s been screaming “altcoin season” for 2 years
• Who first called it when EGLD was at 80, TIA, and others that kept dropping
• But now that something finally moves, he says:
“See? I was right all along, altcoin season is here”
He’s not trading.
He’s rehearsing an ego story, ignoring every failed call, every drawdown, every frozen position.
He doesn’t remember the trades that didn’t work — only the one that eventually did.
This is not strategy.
It’s delusion dressed up as conviction.
________________________________________
📉 The Market Doesn’t Care What You Think
Here’s the reality:
You can be right in your analysis — and still lose money.
You can be wrong — and still come out profitable.
Because the market doesn’t reward your opinion.
It rewards how well you manage risk, entries, exits, expectations, and flexibility
I’ve seen traders who were “right” on direction but blew their accounts by overleveraging.
And I’ve seen others who were wrong on their first two trades — but adjusted quickly, cut losses, and ended green overall in the end.
This is what separates pros from opinionated amateurs.
________________________________________
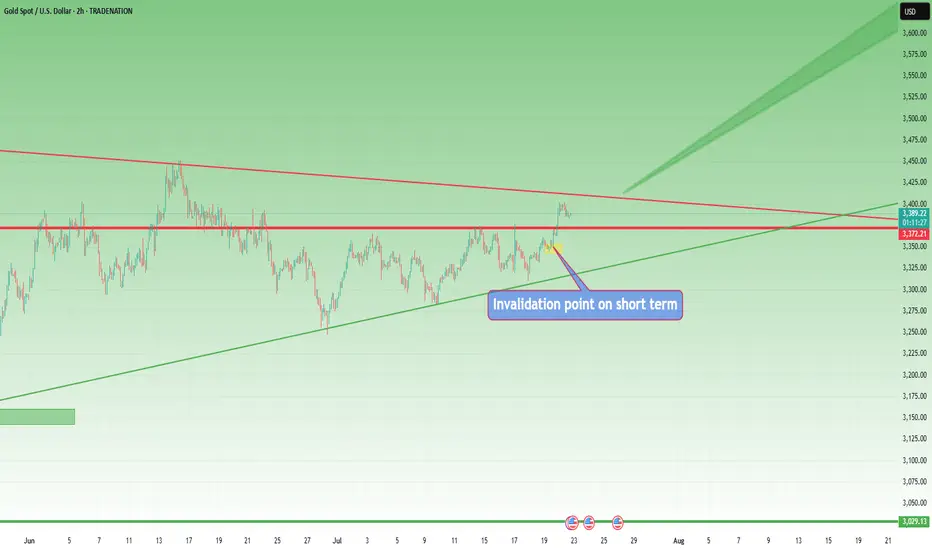
📍 A Real Example: Today’s Gold Analysis
Let’s take a real, current example — my own Gold analysis from this morning.
I said:
• Short-term, Gold could go to 3450
• Long-term, the breakout from the weekly triangle could take us to 3800
Sounds “right,” right? But let’s dissect it:
Short-term:
✅ I identified 3370 as support
If I buy there, I also have a clear invalidation level (below 3350)
If it breaks that and hits my stop?
👉 I reassess — because being “right” means nothing if the trade setup is invalidated
And no, it doesn’t help my PnL if Gold eventually reaches 3450 after taking me out.
Long-term:
✅ The weekly chart shows a symmetrical triangle
Yes — if we break above, the measured move targets 3800
But…
If Gold goes below 3300, that long-term scenario is invalidated too.
And even worse — if Gold trades sideways between 3000 and 3500 for the next 5 years and finally hits 3800 in 2030, that “correct call” is worth nothing.
You can't build a career on "eventually I was right."
You need precision, timing, risk management, and the ability to say:
“This setup is no longer valid. I’m out.”
________________________________________
💡 The Shift That Changed Everything
It took me years to realize this.
The day I stopped needing to be right was the day I started making consistent money.
I stopped arguing with the market.
I stopped holding losers out of pride.
I stopped needing to "prove" anything to anyone — especially not myself.
Now, my job is simple:
• Protect capital
• Execute with discipline
• Let the edge do its job
• And never fall in love with my opinion
________________________________________
✅ Final Thought – Let Go of Being Right
If you’re still stuck in the “I knew it” mindset — let it go.
It’s not helping you. It’s costing you.
The best traders lose small, admit mistakes fast, and stay emotionally neutral.
The worst traders hold on to “being right” while their account burns.
The market doesn’t owe you respect.
It doesn’t care if you called the top, bottom, or middle.
It pays the ones who trade objectively, flexibly, and without ego.
After almost 25 years, this is the one thing I wish I had learned sooner:
Don’t try to win an argument with the market.
Just get paid.
Disclosure: I am part of TradeNation's Influencer program and receive a monthly fee for using their TradingView charts in my analyses and educational articles.
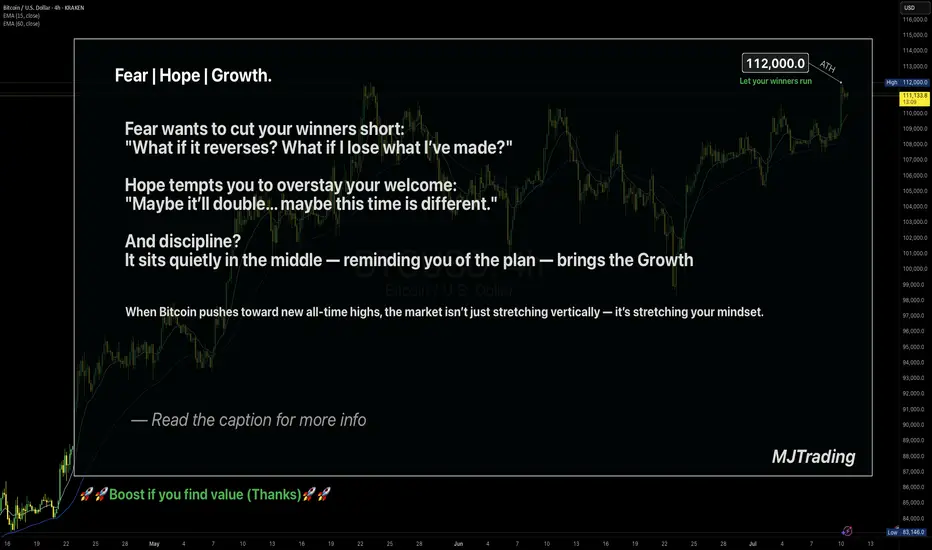
Survive first. Thrive later.🧠 Trading Psychology x Risk Management
"If you can't survive being wrong, you don't deserve to be right."
💬 A calm chart…
A ruthless truth.
Most traders obsess over being right.
But the market only rewards those who manage being wrong.
Risk control isn’t just technical — it’s emotional.
Survive first. Thrive later.
— MJTrading
Psychology Always Matters:
Click on them for notes in the caption...
#MJTrading #ChartDesigner #TradingPsychology #RiskManagement #MindfulTrading #CapitalPreservation #SmartMoney #XAUUSD #ForexDiscipline #15minChart #GoldAnalysis #MentalEdge #Gold

The Dangers of Holding Onto Losing Positions...One of the most common — and costly — mistakes in trading is holding onto a losing position for too long. Whether it's driven by hope, ego, or fear, this behavior can damage your portfolio, drain your capital, and block future opportunities. Successful trading requires discipline, objectivity, and the willingness to accept when a trade isn’t working. Understanding the risks behind this behavior is essential to protecting your capital and evolving as a trader.
-- Why Traders Hold Onto Losing Trades --
It’s not always poor strategy or lack of experience that keeps traders locked in losing positions — it’s often psychology. Several cognitive biases are at play:
1. Loss Aversion
Loss aversion refers to our instinctive desire to avoid losses, often stronger than the desire to realize gains. Traders may hold onto a losing position simply to avoid the emotional pain of admitting the loss, hoping the market will eventually turn in their favor.
2. Overconfidence
When traders are overly confident in their analysis or trading thesis, they can become blind to changing market conditions. This conviction may cause them to ignore red flags and hold on out of sheer stubbornness or pride.
3. The Sunk Cost Fallacy
This is the belief that since you’ve already invested money, time, or effort into a trade, you need to keep going to “get your investment back.” The reality? Past investments are gone — and continuing the position often compounds the loss.
These mental traps can distort decision-making and trap traders in unproductive or damaging positions. Being aware of them is the first step toward better judgment.
-- The True Cost of Holding Losing Positions --
Holding onto a bad trade costs more than just the money it loses. It impacts your entire trading strategy and limits your growth. Here’s how:
1. Opportunity Cost
Capital tied up in a losing trade is capital that can’t be used elsewhere. If you keep $8,000 in a stock that’s fallen from $10,000 — hoping it rebounds — you're missing out on placing that money in higher-performing opportunities. Inactive capital is wasted capital.
2. Deeper Compounding Losses
A 20% loss doesn’t sound catastrophic until it becomes 30%… then 40%. The deeper the loss, the harder it becomes to break even. Holding out for a recovery often makes things worse — especially in markets with high volatility or downtrends.
3. Reduced Liquidity
Successful traders rely on flexibility. When your funds are tied up in a losing position, you limit your ability to respond to new opportunities. In fast-moving markets, this can be the difference between success and stagnation.
Recognizing these costs reframes the decision from “holding on until it turns around” to “preserving capital and maximizing potential.”
Consider this simple XAUUSD (Gold) weekly chart example. If you base a trading strategy solely on the Stochastic oscillator (or any single indicator) without backtesting and ignoring the overall trend, focusing solely on overbought signals for reversals, you'll quickly see the oscillator's frequent inaccuracies. This approach will likely lead to substantial and prolonged losses while waiting for a reversal that may never occur.
-- Signs It’s Time to Exit a Losing Trade --
The hardest part of trading isn’t opening a position — it’s closing a bad one. But if you know what to look for, you’ll know when it’s time to let go:
1. Emotional Attachment
If you find yourself feeling “married” to a trade, it’s a warning sign. Traders often assign meaning or identity to a position. But trading should be based on data and strategy, not sentiment.
2. Ignoring or Adjusting Your Stop Loss
Stop Loss orders exist for a reason: to protect your capital. If you habitually move your stop further to avoid triggering it, you’re letting hope override risk management.
3. Rationalizing Losses
Statements like “It’ll bounce back” or “This company always recovers” can signal denial. Hope is not a strategy. When you catch yourself justifying a bad position without objective reasoning, it’s time to reevaluate.
Consider also reading this article:
-- How to Cut Losses and Move Forward --
Cutting a loss isn’t a failure — it’s a skill. Here are proven techniques that help you exit with discipline and confidence:
1. Use Stop Losses — and Respect Them
Set a Stop Loss at the moment you enter a trade — and stick to it. It takes the emotion out of the exit and protects your downside. Moving the stop is the fastest path to deeper losses.
2. Trade With a Plan
Every trade should be part of a bigger strategy that includes risk tolerance, entry/exit points, and profit targets. If a position hits your predetermined loss threshold, exit. Trust your system.
3. Apply Position Sizing and Diversification
Never risk more than a small percentage of your capital on a single trade. Keep your portfolio diversified across different instruments or sectors to avoid one position derailing your progress.
4. Review and Reflect
Post-trade analysis is vital. Review both wins and losses to learn what worked — and what didn’t. This practice sharpens your strategy and builds emotional resilience over time.
-- Why Cutting Losses Strengthens Your Portfolio --
There’s long-term power in letting go. Here’s what cutting losses early can do for you:
1. Preserve Capital
The faster you cut a losing trade, the more capital you retain — and the more opportunities you can pursue. Capital preservation is the foundation of longevity in trading.
2. Reduce Emotional Stress
Sitting in a losing trade weighs heavily on your mindset. The stress can cloud your judgment, increase risk-taking, or cause hesitation. Exiting early reduces this emotional drag and keeps you clear-headed.
3. Reallocate to Better Setups
Exiting losing trades frees up both capital and mental energy for higher-probability opportunities. This proactive approach builds momentum and reinforces the idea that it’s okay to be wrong — as long as you act decisively.
Consider also reading this article:
-- Final Thoughts: Discipline Over Denial --
Holding onto losing trades may feel like you're showing patience or commitment — but in reality, it's often denial wrapped in hope. Trading is about probabilities, not guarantees. The most successful traders aren’t the ones who win every trade — they’re the ones who manage losses with discipline.
Letting go of a bad trade is a show of strength, not weakness. It’s a deliberate choice to protect your capital, stay agile, and refocus on trades that serve your goals. The market doesn’t owe you a comeback — but with a clear head and disciplined approach, you can always find your next opportunity.
✅ Please share your thoughts about this article in the comments section below and HIT LIKE if you appreciate my post. Don't forget to FOLLOW ME; you will help us a lot with this small contribution.

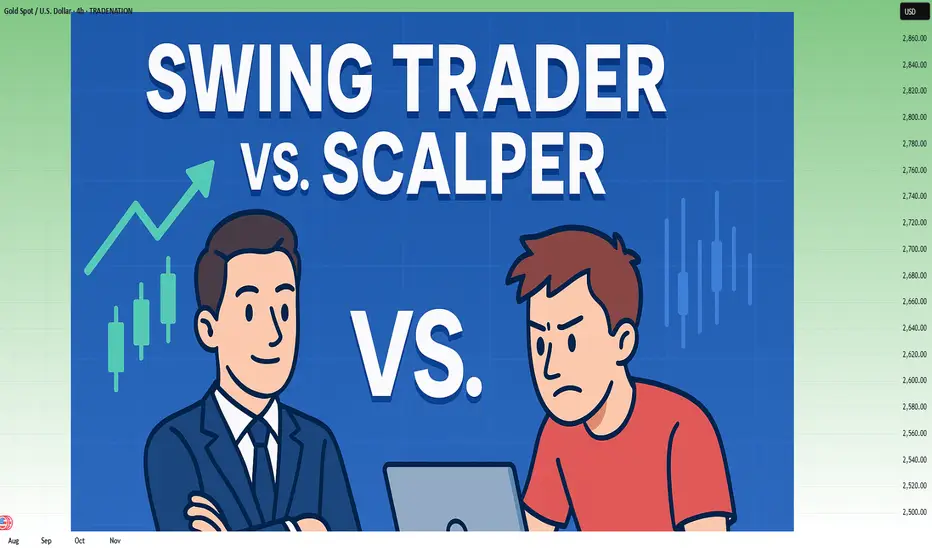
Why Swing Trading and Scalping Are Opposite Worlds"It's not about the strategy. It's about who you are when the market puts pressure on you."
Most traders fail not because they don’t learn “strategies” — but because they pick a style that doesn't match their temperament.
And nothing creates more damage than confusing swing trading with scalping/intraday trading.
Let’s break them down. For real...
________________________________________
🔵 1. Swing Trader – Chasing Direction, Not Noise
A swing trader does not touch choppy markets.
He’s not here for the sideways grind. He wants momentum.
If there’s no clear trend, he doesn’t trade.
He shifts between assets depending on where real movement is.
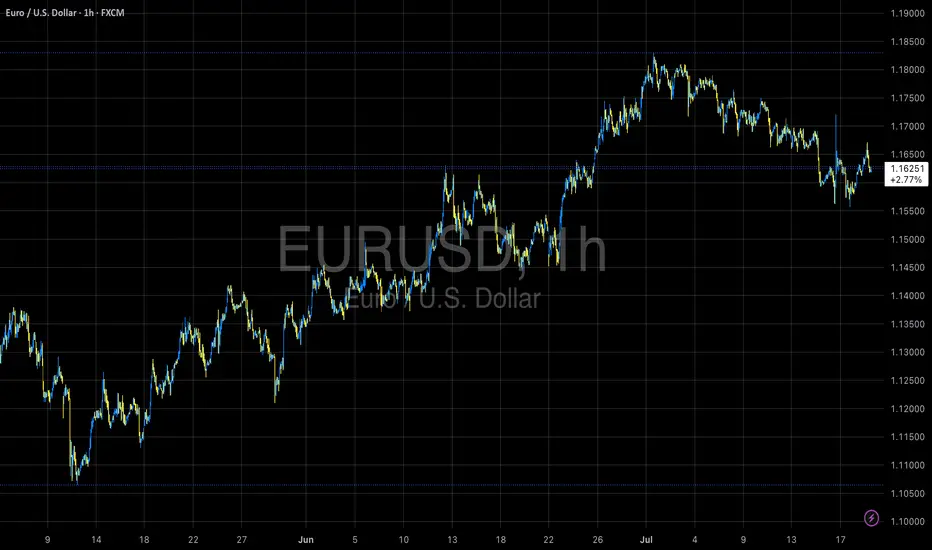
• USD weakens → he buys EUR/USD and waits
• Gold breaks → he enters and lets the move develop
Swing trading means positioning with the macro flow, not chasing bottoms and tops.
✅ He trades based on H4/Daily or even Weekly charts
✅ He holds for hundreds of pips.
✅ He accepts contrarian candles in the process.
________________________________________
🔴 2. Scalper/Intraday Trader – The Asset Specialist
A true scalper doesn’t chase trends.
He hunts inefficiencies — quick spikes, fakeouts, liquidity grabs.
✅ Loves range conditions
✅ Lives inside M5–M15
✅ Often trades only one asset he knows like the back of his hand
He doesn’t care what EUR/USD will do this week.
He cares what it does in the next 30 minutes after a breakout.
Scalping is not chaos. It's cold execution with a sniper mindset.
📡 He reacts to news in real time.
He doesn’t predict — he exploits.
________________________________________
🧾 Key Differences – Swing Trader vs. Scalper
________________________________________
🎯 Primary Objective
• Swing Trader: Captures large directional moves over several days.
• Scalper/Intraday: Exploits short-term volatility, aiming for quick, small gains.
________________________________________
🧭 Market Conditions Preference
• Swing Trader: Needs clean, trending markets with clear momentum.
• Scalper/Intraday: Feels comfortable in ranging markets with liquidity spikes and noise.
________________________________________
🔍 Number of Instruments Traded
• Swing Trader: Monitors and rotates through multiple assets (e.g. XAUUSD, EURUSD, indices, BTC, he's going where the money is).
• Scalper/Intraday: Specializes in 1–2 instruments only, knows their behavior in every session.
________________________________________
⏰ Time Spent in Front of the Charts
• Swing Trader: Waits for clean setups, may hold positions for days or weeks.
• Scalper/Intraday: Constant screen time, executes and manages trades actively.
________________________________________
📰 Reaction to News
• Swing Trader: Interprets the macro/fundamental impact and positions accordingly.
• Scalper/Intraday: Reacts live to data releases, wicks, and intraday volatility.
________________________________________
📉 When They Struggle
• Swing Trader: Fails in choppy or directionless markets.
• Scalper/Intraday: Loses edge when the market trends explosively.
________________________________________
🧠 Psychological Requirements
• Swing Trader: Needs patience, confidence in the big picture, and acceptance of drawdown.
• Scalper/Intraday: Needs absolute discipline, emotional detachment, and razor-sharp focus.
________________________________________
✅ Bottom line: They are two different games.
Don’t try to play both on the same chart with the same mindset.
________________________________________
✅ Final Thoughts – Your Edge Is in Alignment, Not Imitation
You don’t pick a trading style because it “sounds cool.”
You pick it because it aligns with:
• Your schedule
• Your attention span
• Your tolerance for uncertainty
If you hate watching candles all day – go swing.
If you hate waiting for days – go intraday.
If you keep switching between both – go journal your pain and come back later.
P.S. Recent Example:
I'm a swing trader. And this week, Gold has been stuck in a range.
What do I do? I wait. No rush, no overtrading. Just patience.
Once the range breaks, I’m ready — in either direction.
But I don’t close after a quick 50–100 pip move. That’s not my game.
I aim for 700+ pips whether it breaks up or down,because on both sides we have major support and resistance levels that matter.
That’s swing trading:
📍 Enter with structure, hold with confidence, exit at significance.
Not every move is worth trading — but the big ones are worth waiting for.
Disclosure: I am part of TradeNation's Influencer program and receive a monthly fee for using their TradingView charts in my analyses and educational articles.
The Ineffectiveness of Day Trading: A Critical Review of EmpiricThe Allure of Quick Profits
Day trading has gained considerable popularity as an investment strategy among retail investors, particularly following technological advances in electronic trading platforms and commission-free brokerage services. This analysis examines the available empirical evidence from various markets and time periods to evaluate the economic viability of day trading as an investment strategy.
The most comprehensive study on the subject comes from Barber et al. (2011), who analyzed the behavior of over 360,000 day traders in Taiwan. Their results show that over 80 percent of day traders lose money, and less than 1 percent can achieve consistently profitable results. These findings align with similar studies from other markets and confirm the systematic unprofitability of day trading for the vast majority of participants.
Day trading represents a systematically unprofitable investment strategy for retail investors, rooted in cognitive biases (Kahneman & Tversky, 1979), excessive transaction costs, and market microstructure inefficiencies (O'Hara, 1995). Long-term passive investment strategies demonstrate superior risk-adjusted returns with significantly lower resource requirements.
What the Research Shows
The research landscape on day trading is clear and consistent across various markets. A systematic review of the most important studies follows established standards of financial market research.
The inclusion criteria for relevant studies encompass empirical investigations with substantial sample sizes (more than 1,000 traders), minimum observation periods of 12 months, and quantitative performance measures. The available literature is based on millions of trading accounts from various developed markets.
The historical development of day trading shows clear parallels to technological developments in the financial sector. Before deregulation through Electronic Communication Networks by the SEC in 1997, it was impossible for retail investors to trade directly in the market. With the rise of online brokers like E*TRADE and Ameritrade, day trading became accessible to the mass public for the first time. This technical opening coincided with aggressive marketing that promoted free trades, low fees, and success stories of individual traders.
Empirical Findings
Evidence from various markets shows consistent patterns. Barber et al. (2011) document that 84.3 percent of 360,000 analyzed day traders in Taiwan suffered losses, with a median return of minus 8.7 percent. Similar studies from the United States confirm loss rates exceeding 90 percent of participants.
Jordan and Diltz (2003) conclude that even experienced day traders are hardly able to beat the market after costs in the long term. The long-term results are even more sobering: only a fraction of all day traders remain profitable over extended periods, while a significant portion abandons the activity within two years.
The transaction cost analysis is based on realistic market conditions. A calculation example illustrates the structural challenges: with an assumed daily trading volume of $50,000 and eight round trips per day, substantial costs arise from commissions (approximately 0.1% per trade), bid-ask spreads (averaging 0.02-0.05%), and market impact (about 0.01% for smaller volumes).
Annual Cost Calculation Example:
- 252 trading days × 8 trades = 2,016 trades/year
- Commission costs: 2,016 × $2.50 = $5,040
- Spread costs: $50,000 × 0.03% × 2,016 = $30,240
- Total costs: approximately $35,000 or 70% of daily trading volume
This cost structure means that day traders must achieve gross returns of well over 70 percent annually just to break even, while passive investors bear annual costs of only 0.1 to 0.3 percent (Bogle, 2007).
Behavioral Analysis and Cognitive Biases
Behavioral research explains why day trading remains attractive despite poor success prospects. Odean (1999) shows that overconfident investors trade excessively and thereby reduce their expected returns. The disposition effect documented by Shefrin and Statman (1985) leads traders to realize gains too early and hold losses too long.
Kahneman and Tversky's (1979) Prospect Theory explains systematic biases in decision-making under uncertainty. Loss aversion leads to losses weighing psychologically heavier than equivalent gains, resulting in irrational holding of losing positions.
The gambler's fallacy manifests in the erroneous assumption of many day traders that past losses make future gains more likely. Recency bias leads to overweighting recent events. These psychological factors reinforce each other and create a vicious cycle of irrational decisions.
Comparative Analysis: Day Trading versus Passive Strategies
A comparison with established investment strategies illustrates the systematic disadvantages of day trading. Malkiel (2011) documents long-term returns of diversified portfolios at 6-8 percent real, while Barber and Odean (2000) show that frequent trading systematically reduces returns.
Historical data shows that the S&P 500 Index achieved an average annual return of 10.2 percent with 15.8 percent volatility over 30 years (Sharpe ratio: 0.65). Day traders, in contrast, typically exhibit negative Sharpe ratios as losses dominate amid high volatility.
The time investment differs dramatically: day trading requires 40-50 hours of weekly attention, while passive investing demands less than one hour per week. Studies also show health burdens from the constant stress of active trading.
Market Microstructure and Professional Trading
Market structure systematically favors institutional players. High-frequency trading firms possess latency advantages in the microsecond range, while retail traders operate with delays exceeding 100 milliseconds. They utilize co-location services and process data volumes inaccessible to private investors.
Market-making operations profit from bid-ask spreads and exchange rebate programs. They operate under different regulatory frameworks and have access to dark pools and proprietary technology.
Day trading mathematically represents a zero-sum game that becomes negative after costs. Since the sum of all trading gains and losses equals zero, but transaction costs are positive, the expected return for all participants collectively is necessarily negative.
Alternative Investment Strategies
Academic literature comprehensively documents the superiority of passive strategies. Bogle (2007) demonstrates through long-term data that low-cost index funds consistently achieve better net returns than active strategies.
Passive Strategy Calculation Example:
An investment of €10,000 in a low-cost ETF (0.15% TER) with 7% annual returns yields approximately €37,000 after 20 years. To achieve this result, day traders would need to consistently earn over 15% gross returns after costs—a scenario that is empirically nearly impossible.
Factor-based investing offers additional improvements: Fama and French (1992) documented excess returns for value and size factors that are systematically and cost-effectively accessible.
Limitations of the Evidence
The research landscape has certain constraints. Survivorship bias in datasets may underestimate actual losses, as unsuccessful traders disappear from samples more quickly. Additionally, definitions of day trading vary between studies.
External validity is influenced by changing market structures. Algorithmic trading and new financial instruments may alter established patterns. Nevertheless, the fundamental problems of high costs and systematic behavioral biases persist.
Conclusion
The empirical evidence is clear: day trading represents a loss-making activity for the vast majority of participants. The combination of high transaction costs, systematic behavioral biases, and structural market disparities makes consistent profitability nearly impossible.
While isolated success stories exist, they represent statistical outliers rather than replicable strategies. The scientific evidence speaks unequivocally in favor of long-term, low-cost, and diversified investment strategies as superior alternatives to day trading.
Those who nonetheless engage in day trading should be aware that they are not only competing against the market, but against mathematical and psychological realities that practically preclude a high probability of success.
References
Barber, Brad M., Yi-Tsung Lee, Yu-Jane Liu, and Terrance Odean. "Do Individual Day Traders Make Money? Evidence from Taiwan." *Review of Financial Studies* 24, no. 8 (2011): 2892-2922.
Barber, Brad M., and Terrance Odean. "Trading Is Hazardous to Your Wealth: The Common Stock Investment Performance of Individual Investors." *Journal of Finance* 55, no. 2 (2000): 773-806.
Bogle, John C. *The Little Book of Common Sense Investing*. Hoboken: Wiley, 2007.
Fama, Eugene F., and Kenneth R. French. "The Cross-Section of Expected Stock Returns." *Journal of Finance* 47, no. 2 (1992): 427-465.
Jordan, Douglas J., and J. David Diltz. "The Profitability of Day Traders." *Financial Analysts Journal* 59, no. 6 (2003): 85-94.
Kahneman, Daniel, and Amos Tversky. "Prospect Theory: An Analysis of Decision under Risk." *Econometrica* 47, no. 2 (1979): 263-291.
Malkiel, Burton G. *A Random Walk Down Wall Street*. 10th ed. New York: Norton, 2011.
Odean, Terrance. "Do Investors Trade Too Much?" *American Economic Review* 89, no. 5 (1999): 1279-1298.
O'Hara, Maureen. *Market Microstructure Theory*. Oxford: Blackwell Publishers, 1995.
Shefrin, Hersh, and Meir Statman. "The Disposition to Sell Winners Too Early and Ride Losers Too Long: Theory and Evidence." *Journal of Finance* 40, no. 3 (1985): 777-790.
123 Quick Learn Trading Tips - Tip #7 - The Dual Power of Math123 Quick Learn Trading Tips - Tip #7
The Dual Power of Math: Logic for Analysis, Willpower for Victory
✅ An ideal trader is a mix of a sharp analyst and a tough fighter .
To succeed in the financial markets, you need both logical decision-making and the willpower to stay on track.
Mathematics is the perfect gym to develop both of these key skills at the same time.
From a logical standpoint, math turns your mind into a powerful analysis tool. It teaches you how to break down complex problems into smaller parts, recognize patterns, and build your trading strategies with step-by-step thinking.
This is the exact skill you need to deeply understand probabilities and accurately calculate risk-to-reward ratios. 🧠
But the power of math doesn't end with logic. Wrestling with a difficult problem and not giving up builds a steel-like fighting spirit. This mental strength helps you stay calm during drawdowns and stick to your trading plan.
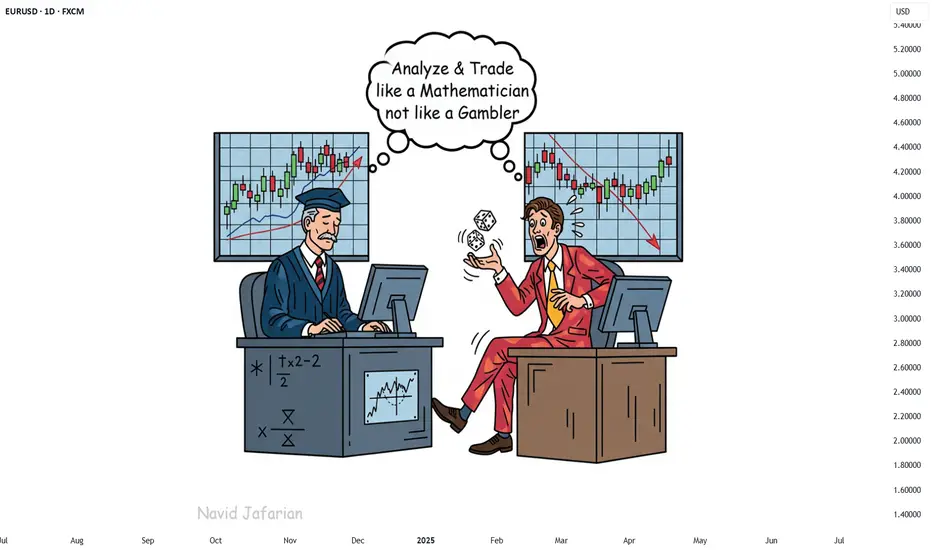
"Analyze with the precision of a mathematician and trade with the fighting spirit of a mathematician 👨🏻🎓,
not with the excitement of a gambler 🎲. "
Navid Jafarian
Every tip is a step towards becoming a more disciplined trader.
Look forward to the next one! 🌟
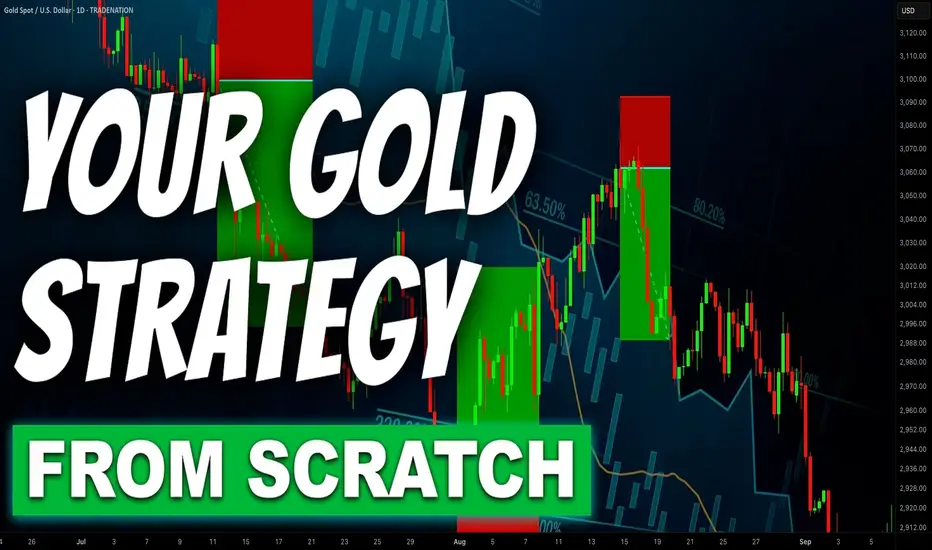
Step-By-Step Guide to Building a Winning Gold Trading Strategy
In the today's article, I will teach you how to create your first profitable gold trading strategy from scratch.
Step 1: Choose the type of analysis
The type of analysis defines your view on the market.
With technical analysis you rely on patterns, statistical data, technical indicators, etc. for making trading decisions.
Fundamental analysis focuses on factors that drive the prices of gold such as micro and macroeconomics, news and geopolitics.
A combination of technical and fundamental analysis implies the application of both methods.
For the sake of the example, we will choose pure technical approach.
Step 2: Specify the area of analysis
Technical and fundamental analysis are complex and multilayered subjects. That is why it is crucially important to choose the exact concepts and techniques that you will apply in gold trading.
For example, with a technical analysis, you can trade harmonic patterns, or apply a combination of key levels and technical indicators.
With fundamental analysis, you can build your trading strategy around trading the economic calendar or important news releases.
Here we will choose support & resistance levels and smart money concepts.
Step 3: Select a trading time frame
Your trading time frame will define your trading style. Focusing on hourly time frame, for example, you will primarily catch the intraday moves, while a daily time frame analysis will help you to spot the swing moves.
You can also apply the combination of several time frames.
We will choose the combination of a daily and an hourly time frames.
Step 4: Define your trading zones
By a trading zone, I mean an area or a level on a price chart from where you will look for trading opportunities.
For example, a technical indicator trader may apply moving average as the trading point.
For the sake of the example, we will choose support and resistance levels on a daily time frame as our trading areas.
Step 5: Choose confirmations
Confirmation is your entry reason . It is the set of conditions that indicates a highly probable projected outcome.
For an economic calendar traders, the increasing CPI (inflation) figures can be a solid reason to open a long position on Gold.
Our confirmation will be a local change of character on an hourly time frame.
Step 6: Define your stop loss placement, entry and target selection and desired reward to risk ratio
You should know exactly where should be your entry point, where will be your stop loss and where should be the target.
We will open a trading position immediately after a confirmed change of character, stop loss will lie below the lows if we buy or above the highs if we sell.
Target will be the next daily structure.
Minimal reward to risk ration should be 1.5.
Step 7: Define Your Lot Size and Risk Per Trade
You should have precise rules for the calculation of a lot size for each trade.
For our example, we will strictly risk 1% of our trading deposit per trade.
Step 8: Set trade management rules
When the trade is active, trade management rules define your action:
for example, whether you strictly wait for tp or sl, or you apply a trailing stop loss.
In our strategy, we will move stop loss to entry 10 minutes ahead of the release of the US news in the economic calendar.
Step 9: Back test your strategy
Study the historical data and back test at least 50 trading setups that meet your strategy criteria.
Make sure that the strategy has a positive win rate.
Step 10: Try a trading strategy on a demo account
Spend at least a month on demo account and make sure that you obtain positive overall results.
If you see consistent profits on a demo account, it is the signal for you that your strategy is ready , and it's time to start trading on a real account.
In case of negative results, modify your trading conditions and back test them again, or build a new strategy from scratch.
❤️Please, support my work with like, thank you!❤️
I am part of Trade Nation's Influencer program and receive a monthly fee for using their TradingView charts in my analysis.
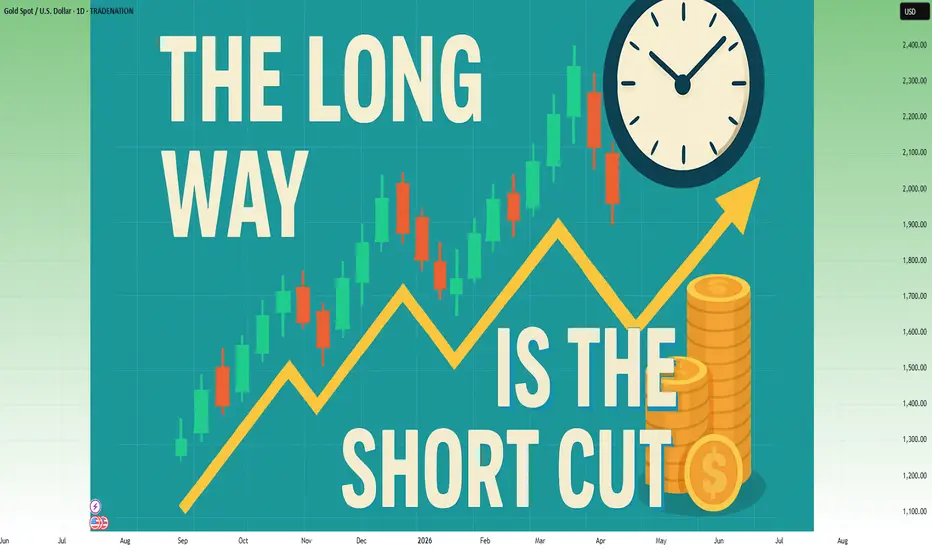
In trading, the long way is the shortcut⚠️ The Shortcut Is an Illusion — And It Will Cost You
In trading, everyone wants to arrive without traveling.
They want the profits, the freedom, and the Instagram lifestyle — even if it’s fake.
What they don’t want is the process that actually gets you there.
So they chase shortcuts:
• Copy signals without understanding the reason behind them
• Over-leverage on “the perfect setup”
• Buy indicators they don’t know how to use
• Skip journaling and backtesting
• Trade real money without trading psychology
And then they wonder…
Why is my account bleeding?
Why does this feel like a cycle I can't break?
Because:
Every shortcut in trading is just a fast track to disaster.
You will lose. You will restart. And it will take even longer than if you just did it right the first time.
🤡 The TikTok Fantasy: “1-Minute Strategy That Will Make You Millions in 2025”
This is the new wave:
A 60-second video showing you a magical indicator combo.
No context. No testing. No risk management.
Just fake PnL screenshots and promises of millionaire status before next summer.
“This 1-minute scalping strategy made me $12,000 today!”
And people fall for it… because it’s easier to believe in shortcuts than to accept that real trading is boring, repetitive, and hard-earned.
If it fits in a TikTok video, it’s not a strategy. It’s clickbait.
________________________________________
❓ Looking for a System Without Knowing the Basics
Here’s the paradox:
Most people are desperate to find a “profitable strategy” — but they haven’t even mastered the basic math of trading.
• They don’t know how pip value is calculated
• They don’t understand how leverage works
• They confuse margin with risk
• They size positions emotionally, not based on their account
• They can’t define what 1% risk per trade actually means in dollars
But they’re out here, loading indicators, watching YouTube “hacks,” and flipping accounts with 1:500 leverage.
Imagine trying to perform surgery before learning anatomy.
That’s what trying to trade a strategy without knowing pip cost looks like.
________________________________________
🛠️ The Long Way Is the Fastest Way
You want the real shortcut?
Here it is:
• Learn price structure deeply
• Backtest like a scientist
• Journal like a professional
• Risk small while you're learning
• Stay on demo until your edge is proven
• Master basic math: leverage, margin, pip value, position sizing
This is the long way.
But it’s the only way that doesn’t end in regret.
________________________________________
⏳ Most Traders Waste 2–5 Years Looking for a Shortcut
And in the end?
They crawl back to the long path.
Broke, humbled, and wishing they had just started there from the beginning.
The shortcut is a scam.
The long way is the only path that leads to consistency.
You either take it now… or take it later — after your account pays the price.
________________________________________
✅ Final Thought
Don’t ask how fast you can get profitable.
Ask how solid you can build your foundation.
Because in trading:
❌ The shortcut costs you everything
✅ The long way gives you everything
And the longer you avoid it, the longer it takes.
Learn 2 Essential Elements of Forex Gold Trading
In the today's post, we will discuss how Forex Gold trading is structured, and I will share with you its 2 key milestones.
Trading with its nuances and complexities can be explained as the interconnections of two processes: trading rules creation and trading rules following.
1️⃣ With the trading rules, you define what you will trade and how exactly, classifying your entry and exist conditions, risk and trade management rules. Such a set of consistent trading rules compose a trading strategy.
For example, you can have a following trading plan:
you trade only gold, you analyze the market with technical analysis,
you buy from a key support and sell from a key resistance on a daily, your entry confirmation is a formation of a reversal candlestick pattern.
You set stop loss above the high/low of the pattern, and your target is the closest support/resistance level.
Here is how the trading setup would look like.
In the charts above, all the conditions for the trade are met, and the market nicely reached the take profit.
2️⃣ Trading strategy development is a very simple process. You can find hundreds of different ones on the internet and start using one immediately.
The main obstacle comes, however, with Following Trading Rules.
Following the rules is our second key milestone. It defines your ability to stay disciplined and to stick to your trading plan.
It implies the control of emotions, patience and avoidance of rationalization.
Once you open a trade, following your rules, challenges are just beginning. Imagine how happy you would feel yourself, seeing how nicely gold is moving to your target after position opening.
And how your mood would change, once the price quickly returns to your entry.
Watching how your profits evaporate and how the initially winning position turns into a losing one, emotions will constantly intervene.
In such situations, many traders break their rules , they start adjusting tp or stop loss or just close the trading, not being able to keep holding.
The ability to follow your system is a very hard skill to acquire. It requires many years of practicing. So if you believe that a good trading strategy is what you need to make money, please, realize the fact that even the best trading strategy in the world will lose without consistency and discipline.
❤️Please, support my work with like, thank you!❤️
I am part of Trade Nation's Influencer program and receive a monthly fee for using their TradingView charts in my analysis.
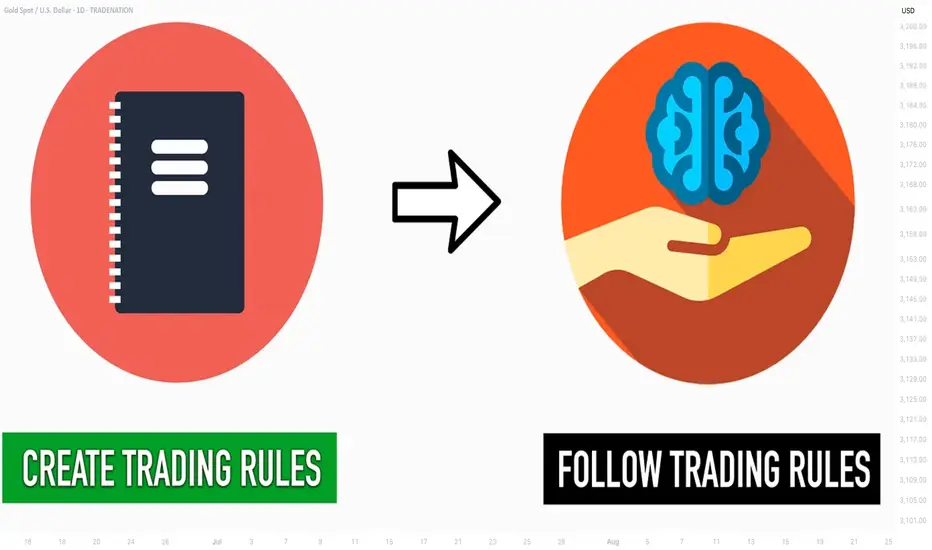
Why Risk Management Is Your Only Real Superpower in TradingMany traders obsess over entries, indicators, or finding the “perfect” strategy…
But the real longevity in this game comes from how you manage risk — not how often you’re right. Obviously it all starts with using stop loss. I hope you already know it. We all learned lessons in trying to enter the top / bottom and it was really not the top/ bottom yet.
✅ Always use Stop Loss.
Interestingly more then 50% failed prop challenges are because traders dont use a stop loss.
Now your stop loss should always be adjusted to the market structure. Not always same lot size
Obviously some short-term scalping can be done with the fixed SL and TP distance. But most of strategies needs to adjust SL to the current structure. And here come the problem. Many traders use still same lot size even when the stop loss distance is different and thats the problem.
Let me just show you on 2 examples of series of trades.
We count with 5 identical trade setups
Let's assume we had 5 trades 1 winner and 4 losses.
📌 1) Using always same position size on 10K account
- Outcome of trades is various
- 1 win with fixed lot was small. Instead of fixed lot we could use higher lot size as the SL distance was small. This trade didnt covered other losses.
- Losses of other trades are various
- psychological affect - uncertainty increasing fear of loss
- total result after is -273 pips
- minus 2.7% and - $273
📌 2) Calculated risk 1.5% for each trade
- we risk 1.5% for each trade by adjusting lot size
- You always know how much you loose if you loose.
- You can maximize profits on high RR trades.
- Every trade will have same % value in your series of trades. This makes your statistics working
- first trade has made huge profit - other 4 losses were 1.5% each
- first trade covered losses and even made gains
- we again ended in minus 273 pips
BUT +$337 IN MONEY / AND + 3.37% PROFIT
📌 Final Conclusion
Although we modeled 5 completely same trading setups in first example we ended up loosing in pips and money. While in the second example with the completely identical setups we ended in profit and more stability of on our account but also with psychological preservation.
And this is power of risk management and it has much bigger impact especially to our trading psychology which is 80% of success.
🧠 Psychological Importance of Risk Management:
🧪 Reduces emotional pressure
When your capital is protected, you stop making desperate, fear-based decisions.
🧪 Builds confidence in your strategy
Knowing you’re safe even if a trade fails allows you to focus on execution, not outcome.
🧪 Eliminates fear of losing
Small, controlled losses become part of the process — not something to avoid or fear.
🧪Improves consistency and discipline
Following rules forces you to act like a professional, not a gambler.
🧪 Prevents burnout and mental fatigue
Managing risk = managing stress. Overexposure to loss drains your mental capital, not just your account.
📌 Final tip
There is no strategy on the world which is only winning. Losses are normal. Same like restaurant owner has a cost with rent and salaries for employees. We as a trader has cost of the doing the business in losses. You cant avoid them.
One loss out of 4 trades is nothing. But what if you get in to a loosing streak like me in the may? How did I survive?
Many people would start doubting the strategy , doing the changes, switching to trading different markets etc.. But NO, if you know your statistical data and stick with the your risk management it will keeps you going. You know that even 75% win rate doesnt guarantee that you cant get in to a loosing streak.
75% winning ratio means that out of 100 trades you will win 75. But still there is 25 looters. And you never know what would be distribution of wins and losses. So you keep going and its only possible if you calculate risk per trade and know how much is your max loss per trade not by using same lot size for random stop loss distance.
“Adapt what is useful. Reject whats useless and add whats is specifically yours.”
David Perk aka Dave FX Hunter
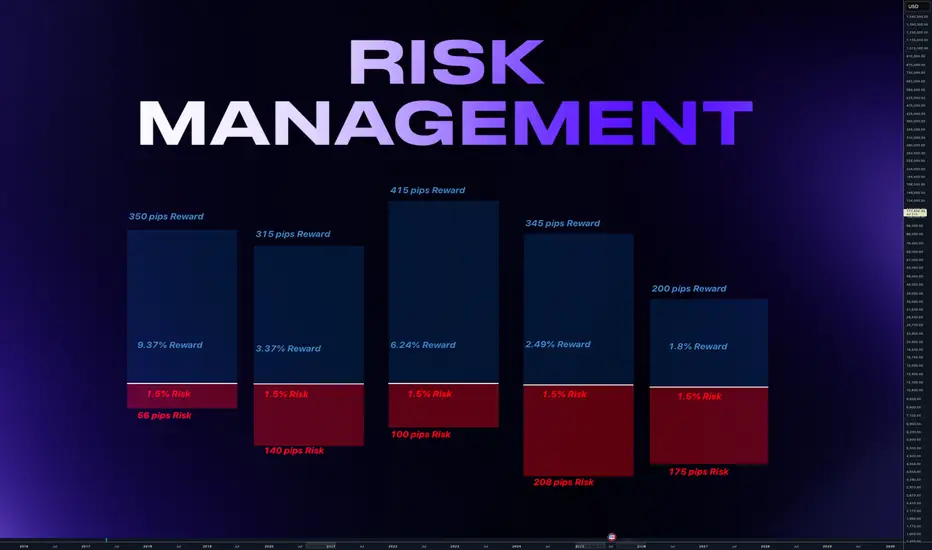
The Right Way to Manage Stop Loss: Dynamic Logic for Smart ExitsContext
In fast-moving markets, static stop losses often sabotage good trades by exiting too soon or too late. This approach uses dynamic, logic-driven stop loss adjustments that adapt to market context instead of sticking to a single fixed distance.
⸻
Key Principles of This Stop Loss Logic
Contextual Initial Placement
The stop is never just a fixed percentage below entry. It adapts based on recent swing lows/highs, ATR volatility, and trend confirmation signals.
Dynamic Extension in Favorable Conditions
If price retraces but shows bullish reversal evidence such as deep oversold signals, positive divergence, or compression breakouts, the stop loss is extended instead of closing immediately. This prevents cutting winners during normal pullbacks.
Tightening When Momentum Fades
If momentum weakens (for example, ADX drops, failed bounce, or resistance rejection), the stop is tightened dynamically. This reduces drawdown if the trend fails.
Clear Exit Triggers
The system can exit on consolidation breakdowns below support, confirmed bearish reversal patterns, or time-based exits if no continuation happens.
⸻
Examples and Visuals
Below, I’ve included chart examples with screenshots from my Multi Crossover Strategy . These images illustrate how dynamic stop loss management behaves in real conditions—showing entries, extensions during retracements, and exits triggered by different scenarios. You can see how the logic responds to changing volatility and trend strength in real time.
The "+" signs mark bars where the position would have closed using the default settings of 2.5 ATR Multiplier stop loss. A bullish reversal signal extended the stop, allowing the trade to close profitably instead of at a loss.
This example shows an early exit triggered by a consolidation breakdown. The system closed the position before the maximum stop loss was reached, limiting the loss as bearish momentum increased.
Example for lower high close to reduce loss. Here, the position was closed after a failed bounce and the formation of a lower high, signaling a likely continuation of the downtrend and helping to reduce the loss before a deeper move.
⸻
Advantages Over Simple Stop Losses
Adaptation
Stops react to volatility and price structure, not arbitrary distances.
Risk Mitigation
Dynamic tightening locks in gains faster when momentum fades.
Confidence to Stay In
Dynamic extension reduces the chance of premature exits during healthy retracements.
⸻
How to Use This Approach
When designing your strategy, start by defining a volatility-adjusted stop using an ATR multiplier as the base distance from entry. You can then set a maximum allowable loss in percentage terms to cap risk exposure to a fixed threshold.
After establishing your initial stop, consider adding layered adjustments that respond to different levels of reversal risk. For example:
ATR Multiplier: the factor used to calculate the initial stop distance based on market volatility.
Maximum Loss (%): the maximum risk per trade, defined as a percentage below the entry price.
Tight Stop Loss (%): a closer stop level that activates when early signs of a potential reversal appear, such as weakening momentum or minor bearish movement.
Bearish Stop Loss (%): a further tightening of the stop distance when stronger bearish reversal signals occur, including failed bounce attempts, lower highs, or clear resistance rejections. This level reduces the tolerance for further losses but still allows the trade to remain open if price stabilizes.
Extended Stop Loss Percentage Add-On: an additional percentage beyond the maximum loss cap, temporarily applied if strong bullish recovery signals appear.
In addition to these percentage-based stop adjustments, you can define instant exit rules that immediately close the position as soon as specific structural conditions are met. Unlike percentage-based stops, instant exits do not wait for further price movement or confirmation. They are typically used to react to decisive events such as a confirmed breakdown below support, a lower high after a failed bounce, or a sharp rejection at a resistance level. This combination of tightened stops and instant exit triggers allows for a flexible but disciplined approach to managing trades.
Pro Tip:
Most traders lose because their stops don’t evolve with the trade. Build a logic tree:
If trend = strong ➡ extend stop
If reversal risk ➡ tighten stop
If clear reversal signs ➡ exit
⸻
Disclaimer: This content is for educational purposes only and does not constitute financial advice. Please do your own research before making trading decisions.

Two Brains, One Trade: Why You Freeze Under PressureBy MJTrading:
In trading, your biggest opponent isn’t volatility.
It’s your own neural wiring.
Every trader operates with two main systems:
🧠 System 2 – Rational, deliberate, planning (Prefrontal Cortex)
🧠 System 1 – Emotional, instinctive, fast (Amygdala & Limbic Brain)
Before entry, System 2 is in control. You feel calm, logical.
But the moment money is at risk—especially in drawdown or after a missed TP—System 1 takes over.
💥 Stress hormones spike
💥 Focus narrows
💥 Long-term thinking disappears
💥 You freeze, or act impulsively
You knew what to do.
But you didn’t do it.
Because in that moment, your rational mind wasn’t driving anymore.
⚖️ Set & Forget vs. Floating Managers
Different trading personalities react differently under pressure:
🔹 Set & Forget Traders
Rely on automation or predefined exits to bypass emotional hijack.
They reduce cognitive load, but often feel regret when price goes “a little more.”
🔹 Floating Management Traders
Rely on intuition and live feeling. They stay with the chart, adjusting based on flow.
When calm and trained, they shine.
But under pressure, they’re more vulnerable to emotional loops:
– hesitation
– premature exits
– revenge tweaks
– system betrayal
🧘♂️ What can you do?
✔️ Pre-plan decisions
Make the hard calls before emotions kick in.
✔️ Mental rehearsal
Visualize trade management scenarios—yes, like athletes do.
✔️ Create fallback protocols
So if you freeze, your system still knows what to do.
🧠 For Those Who Want to Go Deeper:
“Thinking, Fast and Slow” by Daniel Kahneman
Understand System 1 & 2 thinking—and how cognitive bias shapes all decisions, not just trades.
“The Hour Between Dog and Wolf” by John Coates
A stunning look at how biology, hormones, and risk-taking collide in traders' brains.
🔓 Final Thought:
If your strategy works in theory, but breaks in real-time—
It’s time to work on your neural execution layer.
Because in trading, you don’t rise to your level of analysis—
you fall to your level of emotional wiring.
— MJTrading
#NeuroTrading #TraderTypes #TradingPsychology #SetAndForget #FloatingManagement #MindOverMarkets #EURUSD #MJTrading
Previous psychology Ideas:
Let your winners run🧠 Fear | Hope | Growth – When Trading Meets Emotion
The message on the chart isn't just poetic — it's real psychology.
🔹 Fear wants to cut your winners short.
It sneaks in after a small move in your favor.
"What if it reverses? I better lock this in."
And just like that, a great trade turns into a missed opportunity.
🔹 Hope drags you into holding too long.
It dreams: "Maybe it doubles... maybe this time it'll be massive."
But it's not guided by data — it's driven by fantasy.
🔹 Discipline is what sits in the middle.
Quiet. Neutral.
It doesn’t scream or seduce — it just follows the plan.
And that’s where Growth lives — not just on the PnL, but in your psychology.
When Bitcoin pushes toward new ATHs, these emotions get amplified.
The real question becomes: Can you manage yourself, not just your trade?
📌 A Real Example from My Desk
In my earlier BTCUSD idea — “Another Edge – Decision Time” (shared above) —
I sent that setup to one of my managed clients.
He entered long exactly at the edge of the channel — a clean, strategic buy.
Price moved beautifully in our favor…
But he manually closed the trade at 106,600 — long before the move matured.
Why?
Because fear of giving back profit overwhelmed the original plan.
The chart was right. The timing was right.
But the exit was emotional, not tactical.
✅ The trade made money.
❌ But the lesson is clear: a profitable trade doesn’t always mean a disciplined one.
🎯 Final Takeaway:
“Fear kills your winners. Hope kills your timing. Discipline grows your equity and your character.”
🗣 What would you have done in that position?
Held longer? Closed at resistance? Let it run toward ATH?
Let’s talk psychology — drop your thoughts 👇
#MJTrading
#TradingPsychology #BTCUSD #FearHopeDiscipline #LetYourWinnersRun #PriceAction #BTCATH #ForexMindset #CryptoStrategy