J值极值趋势跟随策略J-Zone & 检测3分钟周期信号
EMA 676均线上方只做多
EMA 676均线下方只做空
当J线达到极值100后,并且连续3根K线J OKX:ETHUSDT.P OKX:ETHUSDT.P 值连续上涨开始回落,开空单
当J线达到极值0后,并且连续3根K线J值连续下跌开始上涨,开多单
1. Only consider long positions when the price is above the EMA676.
2. Only consider short positions when the price is below the EMA676.
3. If the J value reaches the extreme of 100, and there are 3 consecutive candles where the J value increases, then the first downturn in J triggers a short entry.
4. If the J value reaches the extreme of 0, and there are 3 consecutive candles where the J value decreases, then the first upturn in J triggers a long entry.
Indicators and strategies

Wx2 Treasure Box – Enter like Institutional Wx2 Treasure Box – Enter like Institutional
✅ Green Treasure Box- Institutional Entry Logic
The core entry signal is based on institutional price action—detecting strong bullish or bearish momentum using custom volume and candle structure logic, revealing when smart money steps into the market.
✅ Orange Treasure Box – Missed Move Entry
Missed the main entry (Green Treasure Box- Institutional Entry Logic)?
Don't worry—this strategy intelligently marks late entry opportunities using the Orange Treasure Box, allowing you to catch high-probability trades even after the initial impulse.
• Designed for retracement-based entries
• Still offers favorable RRR (Risk-Reward Ratio)
• Ideal for traders who miss the first trigger
Note: If you miss the main move, you can enter via the Orange Treasure Box after the market confirms continuation.
🔍 Core Logic
• Identifies Institutional Entry with Institutional Bars (IBs) based on wide-body candles with high momentum
• Detects ideal entry zones where Triggers a Green / Orange Treasure Box for high-probability entries
🎯 Entry Rules
• Buy / Long entry
Plan : Above the Treasure Box (green / orange Box) and bullish candle appears
• Sell /Short entry
Plan : Below the Treasure Box (green / orange Box) and bearish candle appears
• Enter1: (2Lot Size)
Entry with 2 lots: Above Treasure Box (Green / Orange)
• Risk-to-Reward Ratio (RRR):
Target RRR of 1:2 is recommended
Stop Entries are placed using stop orders slightly above / below the Treasure Box
🎯 Add-On Entry on First Pullback
(Optional for Beginners / Compulsory for experienced)
After the first entry, the strategy allows one intelligent add-on position on the first valid pullback, defined by a color change candle followed by a continuation of the trend.
• Detects pullbacks dynamically
• Add-on only triggers once per original entry
• Improves position sizing with trend continuation
💰 Exit Strategy
o TP1 : 1:2
Exit 50% of position (1.5Lot)
Trail SL to entry
o TP2 : 1:3
50% of Remaining Quantity (0.75Lot)
Remaining 25% is trailed
Trailing Stop Loss (SL) using:
8 SMA trailing OR
Bar-by-Bar logic
(whichever is tighter, ensuring maximum profit protection without sacrificing momentum.)
✅ Use Cases
⚙ Best For:
• Scalpers and intraday traders
• Traders who follow Smart Money Concepts (SMC)
• Anyone looking to automate structured trade management
• Works well on crypto, stocks, indices, Forex.
• Works well on any time frame

🏆 UNMITIGATED LEVELS ACCUMULATIONPDH TO ATH RISK FREE
All the PDL have a buy limit which starts at 0.1 lots which will duplicate at the same time the capital incresases. All of the buy limits have TP in ATH for max reward.

Scalping Strategy2//version=6
strategy("DOGE/USDT 5X Scalping Strategy", overlay=true, margin_long=20, margin_short=0)
// === Core Parameters ===
fastEMA = input.int(5, "Fast EMA Length", minval=1, maxval=20)
slowEMA = input.int(12, "Slow EMA Length", minval=2, maxval=50)
trendEMA = input.int(55, "Trend EMA Length", minval=10, maxval=200)
atrPeriod = input.int(14, "ATR Period", minval=1, maxval=50)
tradeInterval = input.int(72, "Minutes Between Trades", minval=1, maxval=1440)
// Risk Management
slMultiplier = input.float(1.5, "Stop-Loss (ATR Multiple)", minval=0.5, maxval=5.0, step=0.1)
tpMultiplier = input.float(1.2, "Take-Profit (ATR Multiple)", minval=0.5, maxval=10.0, step=0.1)
riskPct = input.float(1.0, "Risk Per Trade (%)", minval=0.1, maxval=10.0, step=0.1)
leverage = 5.0 // Fixed 5x leverage
// === Calculate Indicators ===
fastLine = ta.ema(close, fastEMA)
slowLine = ta.ema(close, slowEMA)
trendLine = ta.ema(close, trendEMA)
atrValue = ta.atr(atrPeriod)
rsiValue = ta.rsi(close, 14)
// === Visualize Indicators ===
plot(fastLine, "Fast EMA", color=#2196F3, linewidth=2)
plot(slowLine, "Slow EMA", color=#FF9800, linewidth=2)
plot(trendLine, "Trend EMA", color=#757575, linewidth=1)
// Cross detection for visualization
crossUp = ta.crossover(fastLine, slowLine)
crossDown = ta.crossunder(fastLine, slowLine)
plotshape(crossUp, "EMA Cross Up", style=shape.triangleup, location=location.belowbar, color=color.green, size=size.small)
plotshape(crossDown, "EMA Cross Down", style=shape.triangledown, location=location.abovebar, color=color.red, size=size.small)
// === Trade Logic ===
var int lastTradeBarIndex = 0
timeElapsed = (bar_index - lastTradeBarIndex) >= tradeInterval
noActivePosition = strategy.position_size == 0
// Enhanced Entry Conditions - 80%+ win rate optimizations
emaCross = ta.crossover(fastLine, slowLine)
trendFilter = close > trendLine
priceStrength = close > open and close > close // Strong bullish momentum
rsiFilter = rsiValue > 40 and rsiValue < 68 // Avoid overbought conditions
validEntry = emaCross and trendFilter and timeElapsed and noActivePosition and priceStrength and rsiFilter
// Position sizing calculation
equity = strategy.equity
riskAmount = equity * (riskPct / 100)
stopDistance = atrValue * slMultiplier
positionSize = math.round((riskAmount / stopDistance) * leverage)
// === Strategy Execution ===
if (validEntry)
strategy.entry("Long", strategy.long, qty=positionSize)
stopPrice = close - (atrValue * slMultiplier)
targetPrice = close + (atrValue * tpMultiplier)
strategy.exit("Exit", "Long", stop=stopPrice, limit=targetPrice)
lastTradeBarIndex := bar_index
line.new(bar_index, stopPrice, bar_index+20, stopPrice, color=color.red, width=1)
line.new(bar_index, targetPrice, bar_index+20, targetPrice, color=color.green, width=1)
// Early Exit Logic
inTrade = strategy.position_size > 0
if (inTrade and rsiValue > 75) // Take profit early if RSI gets too high
strategy.close("Long", comment="RSI Exit")

TOT Strategy, The ORB Titan (Configurable)This is a strategy script adapted from Deniscr 's indicator script found here:
All feedback welcome!

XAUUSD Smart Money Sweep StrategyThis is a custom-built Smart Money Concept (SMC) strategy for XAUUSD that detects liquidity sweeps at key swing levels and confirms entries using momentum-based reversal candles. It simulates institutional behavior by entering trades only when price grabs liquidity (stop hunts above highs or below lows), then shows strong rejection in the opposite direction.
The strategy uses precise entry logic, fixed stop loss, and a customizable risk-to-reward ratio for dynamic take-profit targeting. All trades are fully backtestable using TradingView’s built-in strategy() functions.
This approach is ideal for Smart Money traders looking to exploit price inefficiencies without relying on BOS or FVG logic.
🔑 Key Features:
Liquidity Sweep Logic: Detects price sweeping above recent highs or below recent lows, simulating stop hunts and liquidity grabs.
Candle Confirmation Filter: Confirms entry only if a strong reversal candle (momentum shift) forms after the sweep, avoiding weak entries.
Full Backtest Engine: Uses TradingView's strategy.entry() and strategy.exit() to simulate trades with real SL/TP tracking.
Custom Risk Management: Adjustable stop loss (in pips) and risk-to-reward (RR) ratio allow you to shape trade outcomes and optimize strategy performance.
Non-Repainting Logic: All entries are based on closed candles, meaning the signals never repaint and are reliable for testing and execution.
⚙️ Settings:
Setting Description
Liquidity Lookback Number of candles to look back for swing highs/lows to determine sweeps
Stop Loss (pips) Distance below/above entry where SL is placed (fixed pip SL)
Risk/Reward Ratio Multiplies SL to calculate TP (e.g., 1:2 = 2x SL as TP)
Entry Logic Requires sweep + a momentum candle (e.g., bullish close after a sweep down)
📊 How It Works:
The strategy scans recent price action using a lookback range to find the highest high and lowest low (liquidity zones).
If price sweeps above the high or below the low, this triggers a potential entry condition.
A momentum candle confirmation must follow immediately:
For long trades: bullish candle (close > open, and close > previous close)
For short trades: bearish candle (close < open, and close < previous close)
If confirmed, the strategy:
Enters the trade
Places a fixed stop loss in pips
Sets a dynamic TP using the RR ratio
All trades are logged and visualized in the Strategy Tester panel for performance review.
📌 Optimized For:
XAUUSD (Gold) on 15m, 30m, and 1H timeframes
Smart Money / ICT / Liquidity-based trading styles
Traders who prefer reversal setups after liquidity raids
Systems focused on precise execution and high-RR setups
📎 Release Notes:
v1.0 – First release featuring liquidity sweep detection, candle confirmation logic, SL/TP execution, and Strategy Tester support. Clean structure designed for real-world backtesting on volatile instruments like gold.
⚠️ Disclaimer:
This script is for educational and research purposes only. It does not constitute financial advice or signal services. Always validate strategy results with manual backtesting and apply proper risk management.

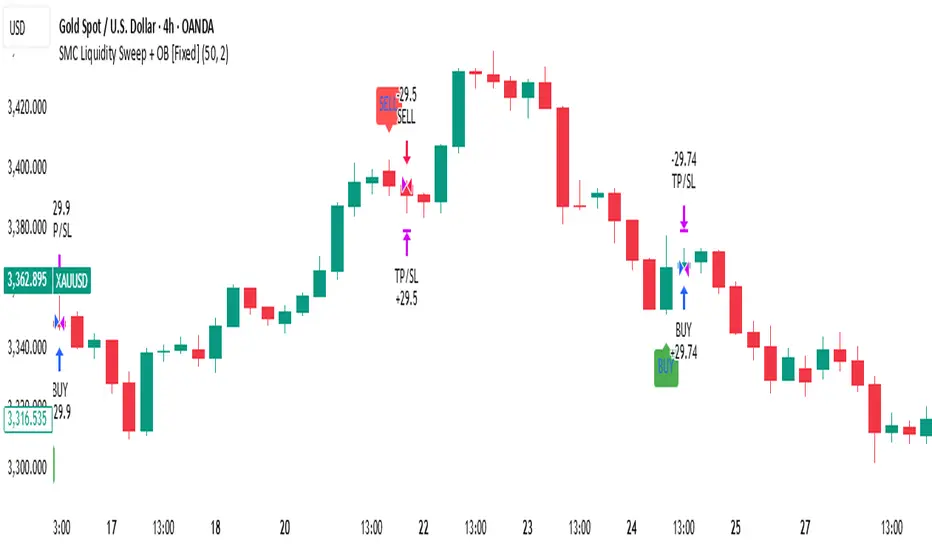
SMC Liquidity Sweep + OB [Fixed]This is a Smart Money Concept (SMC) backtest-ready strategy built to identify high-probability reversal points using two key institutional principles: liquidity sweep and order block confirmation. Designed specifically for pairs like XAUUSD, this system detects where the market sweeps resting liquidity (e.g., stop hunts above recent highs or below recent lows) and looks for a clean reversal candle (order block) to confirm the trap and trigger precise entries.
Unlike BOS or FVG-based models, this version focuses purely on stop-hunt logic and clean price action to simulate institutional behavior—ideal for Smart Money and ICT-style traders who want clear, non-repainting, high-RR setups.
🔍 How the Strategy Works
Liquidity Sweep Detection
The strategy monitors the chart for price breaking above recent swing highs or below recent swing lows (based on a customizable lookback window). This acts as a trigger for a potential trap or liquidity raid.
Order Block Confirmation
After a sweep is detected, the system waits for a confirming candle — a reversal (engulfing-type) candle that acts as an order block:
For longs: a bullish candle that closes higher than the previous bearish candle’s high
For shorts: a bearish candle that closes lower than the previous bullish candle’s low
Entry & Risk Management
Once confirmation is valid, a market entry is placed:
Stop Loss (SL): A fixed pip distance below/above the entry candle
Take Profit (TP): Calculated based on a user-defined Risk-Reward Ratio (e.g., 1:2, 1:3)
Trades are managed automatically and logged into the Strategy Tester with full visibility
🔧 Strategy Parameters
Setting Description
Stop Loss (Pips) Fixed SL distance from entry to protect capital
Risk/Reward Ratio Dynamically calculates TP relative to SL (e.g., RR 2.0 = TP 2x SL)
Liquidity Lookback How many candles back to evaluate swing highs/lows for potential sweeps
Order Block Filter Validates entry only after candle confirmation post-sweep
Direction Filter Supports both long and short signals or one-sided entry filters
📈 Use Case & Optimization
This strategy works best when applied to:
XAUUSD, NAS100, BTCUSD, US30, and high-volatility pairs
Timeframes like 5m, 15m, 1H, where sweeps and reversals are more visible
Traders who follow ICT, SMC, or price action frameworks
Reversal or continuation traders looking for clean execution after liquidity grabs
Because it uses pure price action and logical candle structures, it avoids lag and repainting found in indicator-based systems.
💡 Smart Money Concept Logic Used
Liquidity Grab: Detects stop hunts above recent highs/below lows
Order Block Entry: Entry confirmed only after strong reversal candle at sweep zone
High RR Control: SL and TP customizable to reflect real trading plans
Non-Repainting Structure: All entries are based on confirmed candle closes
📊 Built-in Backtesting Features
Plots trades visually with entry arrows and signal labels
Uses strategy.entry() and strategy.exit() for full testing accuracy
Outputs full performance metrics: win rate, profit factor, drawdown, etc.
All parameters tunable from the settings panel
📎 Release Notes
v1.0
Core SMC strategy with liquidity sweep + OB entry logic
Fully backtestable with fixed SL & dynamic TP
Plots buy/sell signals visually
Optimized for metals, indices, and crypto
⚠️ Disclaimer
This TradingView script is intended for educational and research purposes only. It is not financial advice or a live signal system. Always backtest on your own charts, confirm entries with your personal analysis, and apply strict risk management.
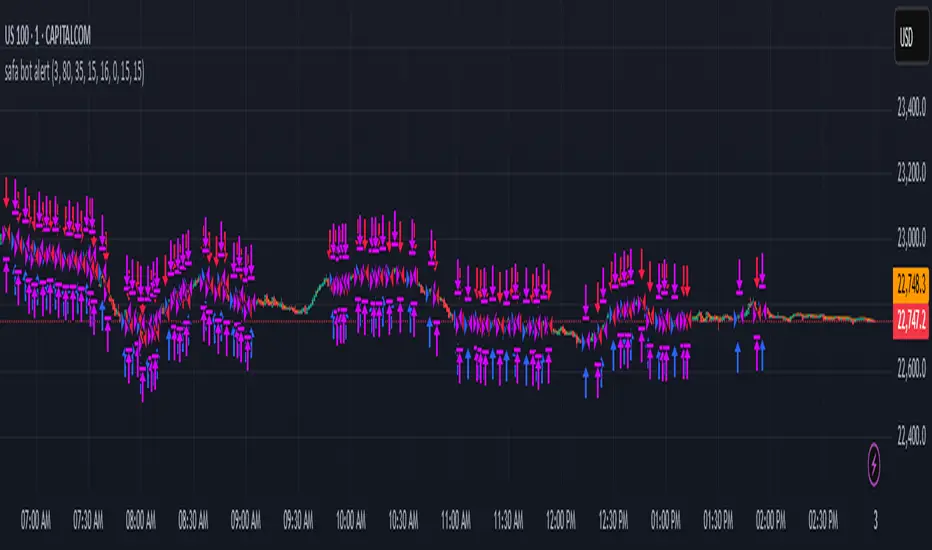
safa bot alertGood trading for everying and stuff that very gfood and stuff please let me puibisjertpa 9uihthsi fuckitgn code
Linear Mean Reversion Strategy📘 Strategy Introduction: Linear Mean Reversion with Fixed Stop
This strategy implements a simple yet powerful mean reversion model that assumes price tends to oscillate around a dynamic average over time. It identifies statistically significant deviations from the moving average using a z-score, and enters trades expecting a return to the mean.
🧠 Core Logic:
A z-score is calculated by comparing the current price to its moving average, normalized by standard deviation, over a user-defined half-life window.
Trades are entered when the z-score crosses a threshold (e.g., ±1), signaling overbought or oversold conditions.
The strategy exits positions either when price reverts back near the mean (z-score close to 0), or if a fixed stop loss of 100 points is hit, whichever comes first.
⚙️ Key Features:
Dynamic mean and volatility estimation using moving average and standard deviation
Configurable z-score thresholds for entry and exit
Position size scaling based on z-score magnitude
Fixed stop loss to control risk and avoid prolonged drawdowns
🧪 Use Case:
Ideal for range-bound markets or assets that exhibit stationary behavior around a mean, this strategy is especially useful on assets with mean-reverting characteristics like currency pairs, ETFs, or large-cap stocks. It is best suited for traders looking for short-term reversions rather than long-term trends.

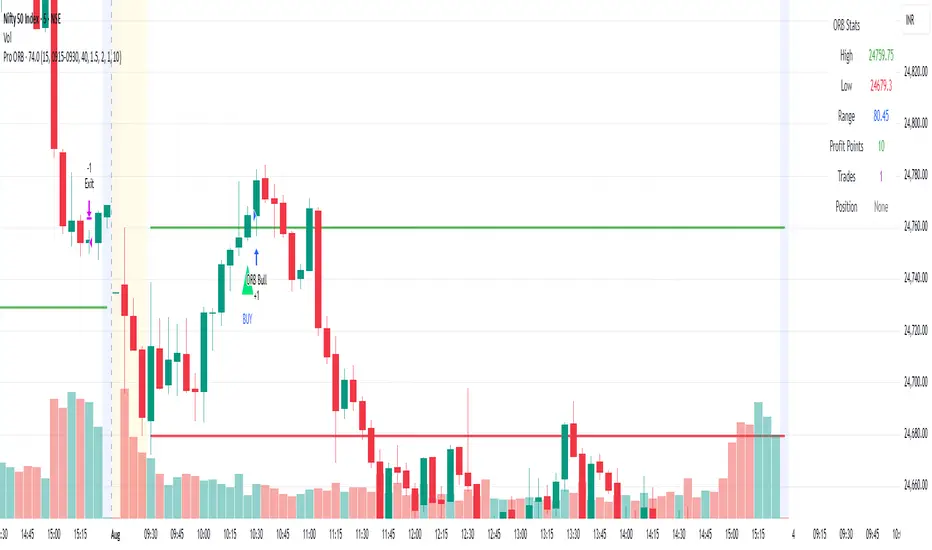
Professional ORB Strategy - BUY & Sell signal- Ganesh SelvarayarORB 15 mins strategy buy and sell signal, with point system for your target
BTC 1m Chop Top/Bottom Reversal (Stable Entries)Strategy Description: BTC 5m Chop Top/Bottom Reversal (Stable Entries)
This strategy is engineered to capture precise reversal points during Bitcoin’s choppy or sideways price action on the 5-minute timeframe. It identifies short-term tops and bottoms using a confluence of volatility bands, momentum indicators, and price structure, optimized for high-probability scalping and intraday reversals.
Core Logic:
Volatility Filter: Uses an EMA with ATR bands to define overextended price zones.
Momentum Divergence: Confirms reversals using RSI and MACD histogram shifts.
Price Action Filter: Requires candle confirmation in the direction of the trade.
Locked Signal Logic: Prevents repaints and disappearing trades by confirming signals only once per bar.
Trade Parameters:
Short Entry: Above upper band + overbought RSI + weakening MACD + bearish candle
Long Entry: Below lower band + oversold RSI + strengthening MACD + bullish candle
Take Profit: ±0.75%
Stop Loss: ±0.4%
This setup is tuned for traders using tight risk control and leverage, where execution precision and minimal drawdown tolerance are critical.

EMA Trend-box Strategy with Heikin Ashi Option📈 EMA Trend-box Strategy with Heikin Ashi Option 🟦🟢🔴
Description:
This strategy uses an Exponential Moving Average (EMA) combined with dynamic slope angle analysis to detect trend direction and transitions with precision. Its main objective is to minimize false signals by clearly identifying three market states: uptrend, downtrend, and sideways consolidation.
It also includes optional internal Heikin Ashi logic, which helps filter out market noise and improves signal reliability in volatile environments.
🔍 How It Works:
The market is classified into three modes based on:
The slope angle of the EMA (positive, negative, or flat).
The price position relative to the EMA (above/below).
Based on this, candle colors are assigned:
🟢 Green: Price is above EMA and slope is positive (bullish trend).
🔴 Red: Price is below EMA and slope is negative (bearish trend).
🟦 Blue: Sideways market (slope near zero or price and slope not aligned).
🧠 Signal Logic:
The strategy detects entry opportunities using two transition types:
✅ Classic transition from sideways to trending (blue → green/red).
⚡ Direct transition without a blue candle (green to red or red to green).
This dual-layer logic provides fast reaction to trend changes while preserving a filter based on EMA slope and price position.
🧪 Backtesting Settings (used in script defaults):
💰 Position size: 5% of equity per trade (modifiable).
💼 Commission and slippage: Recommended to include for realistic testing.
📊 Suggested timeframe: Performs best on 15m to 1h, but scalable across timeframes.
📈 Trade volume: Produces 100+ trades on most volatile instruments (e.g., BTCUSD, EURUSD, XAUUSD).
🧠 Heikin Ashi Option:
This strategy includes an internal option to use Heikin Ashi price logic even when viewing regular candles. This helps:
✔️ Filter out false signals in choppy markets.
✔️ Smooth out trend detection.
✔️ Combine Heikin Ashi for entry filtering with regular candles for precise execution and management.
⚙️ Parameters:
EMA Length: The period for the EMA (default: 21).
Use Heikin Ashi: Enables internal use of Heikin Ashi close for logic calculations.
📌 Notes:
This strategy works well as a standalone trend-following system, but also serves as a robust filter for multi-indicator setups. It can be extended with stop loss/take profit rules, trailing stops, multi-timeframe logic, or risk control modules.
📜 Published by: Aleksandar Aleksin
🔁 Version: 1.0
📎 License: Open source for educational and experimental use.
📅 Date: 08/03/2025

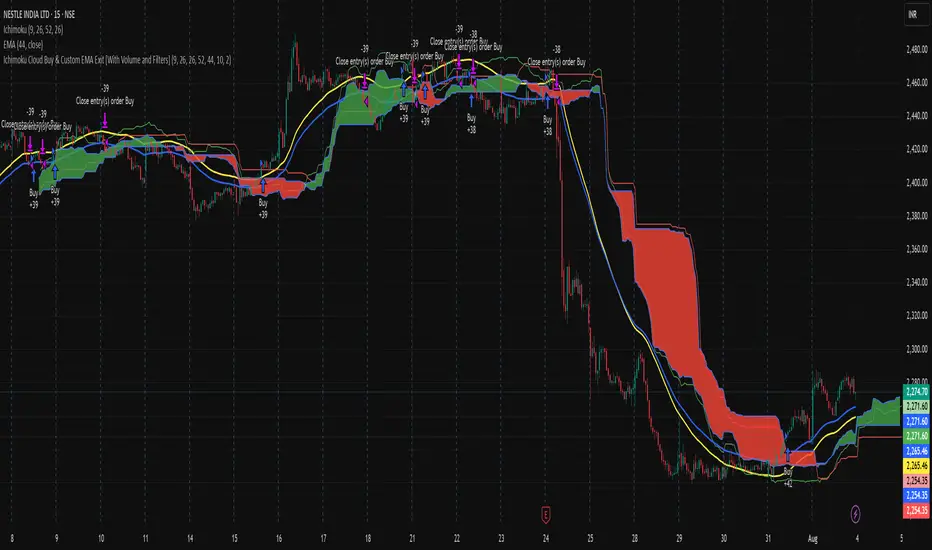
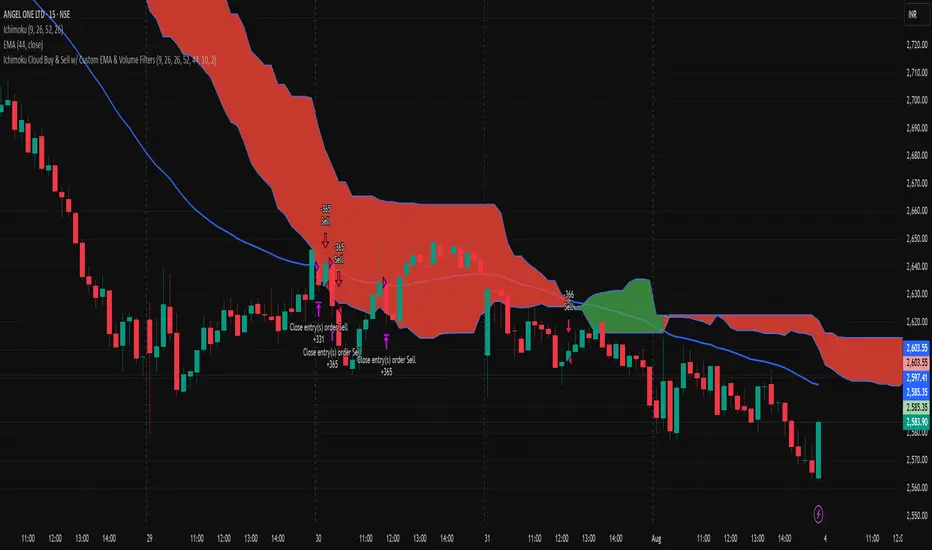
Ichimoku Cloud Buy & Custom EMA Exit [With Volume and Filters]1BUY STRATEGY USING ICHIMOKU CLOUD, Ichimoku Cloud Buy with good risk reward ratio
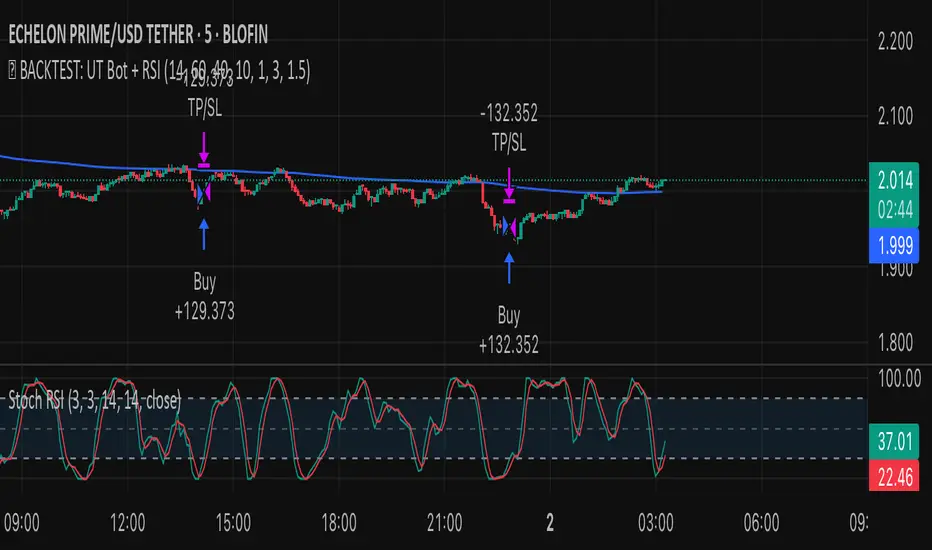
✅ BACKTEST: UT Bot + RSIRSI levels widened (60/40) — more signals.
Removed ATR volatility filter (to let trades fire).
Added inputs for TP and SL using ATR — fully dynamic.
Cleaned up conditions to ensure alignment with market structure.
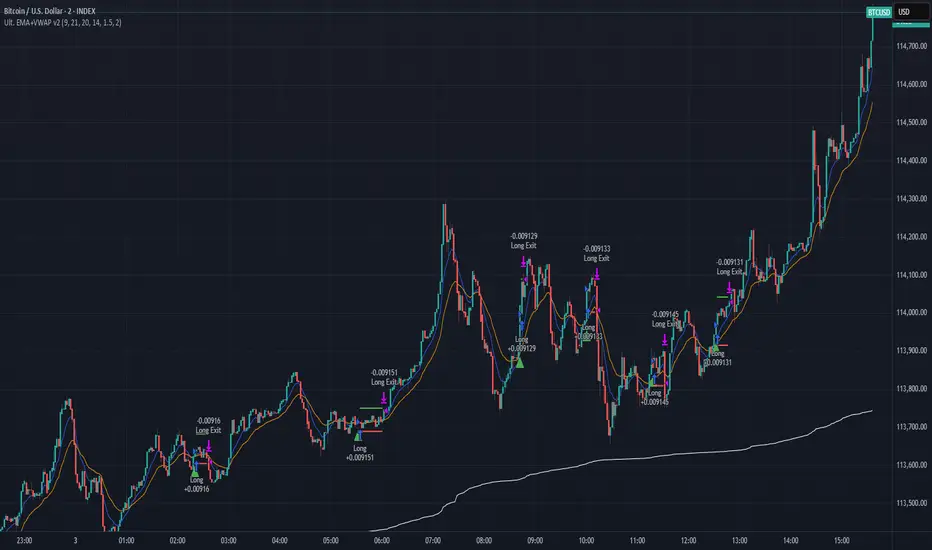
Ultimate Scalping Strategy v2Strategy Overview
This is a versatile scalping strategy designed primarily for low timeframes (like 1-min, 3-min, or 5-min charts). Its core logic is based on a classic EMA (Exponential Moving Average) crossover system, which is then filtered by the VWAP (Volume-Weighted Average Price) to confirm the trade's direction in alignment with the market's current intraday sentiment.
The strategy is highly customizable, allowing traders to add layers of confirmation, control trade direction, and manage exits with precision.
Core Strategy Logic
The strategy's entry signals are generated when two primary conditions are met simultaneously:
Momentum Shift (EMA Crossover): It looks for a crossover between a fast EMA (default length 9) and a slow EMA (default length 21).
Buy Signal: The fast EMA crosses above the slow EMA, indicating a potential shift to bullish momentum.
Sell Signal: The fast EMA crosses below the slow EMA, indicating a potential shift to bearish momentum.
Trend/Sentiment Filter (VWAP): The crossover signal is only considered valid if the price is on the "correct" side of the VWAP.
For a Buy Signal: The price must be trading above the VWAP. This confirms that, on average, buyers are in control for the day.
For a Sell Signal: The price must be trading below the VWAP. This confirms that sellers are generally in control.
Confirmation Filters (Optional)
To increase the reliability of the signals and reduce false entries, the strategy includes two optional confirmation filters:
Price Action Filter (Engulfing Candle): If enabled (Use Price Action), the entry signal is only valid if the crossover candle is also an "engulfing" candle.
A Bullish Engulfing candle is a large green candle that completely "engulfs" the body of the previous smaller red candle, signaling strong buying pressure.
A Bearish Engulfing candle is a large red candle that engulfs the previous smaller green candle, signaling strong selling pressure.
Volume Filter (Volume Spike): If enabled (Use Volume Confirmation), the entry signal must be accompanied by a surge in volume. This is confirmed if the volume of the entry candle is greater than its recent moving average (default 20 periods). This ensures the move has strong participation behind it.
Exit Strategy
A position can be closed in one of three ways, creating a comprehensive exit plan:
Stop Loss (SL): A fixed stop loss is set at a level determined by a multiple of the Average True Range (ATR). For example, a 1.5 multiplier places the stop 1.5 times the current ATR value away from the entry price. This makes the stop dynamic, adapting to market volatility.
Take Profit (TP): A fixed take profit is also set using an ATR multiplier. By setting the TP multiplier higher than the SL multiplier (e.g., 2.0 for TP vs. 1.5 for SL), the strategy aims for a positive risk-to-reward ratio on each trade.
Exit on Opposite Signal (Reversal): If enabled, an open position will be closed automatically if a valid entry signal in the opposite direction appears. For example, if you are in a long trade and a valid short signal occurs, the strategy will exit the long position immediately. This feature turns the strategy into more of a reversal system.
Key Features & Customization
Trade Direction Control: You can enable or disable long and short trades independently using the Allow Longs and Allow Shorts toggles. This is useful for trading in harmony with a higher-timeframe trend (e.g., only allowing longs in a bull market).
Visual Plots: The strategy plots the Fast EMA, Slow EMA, and VWAP on the chart for easy visualization of the setup. It also plots up/down arrows to mark where valid buy and sell signals occurred.
Dynamic SL/TP Line Plotting: A standout feature is that the strategy automatically draws the exact Stop Loss and Take Profit price lines on the chart for every active trade. These lines appear when a trade is entered and disappear as soon as it is closed, providing a clear visual of your risk and reward targets.
Alerts: The script includes built-in alertcondition calls. This allows you to create alerts in TradingView that can notify you on your phone or execute trades automatically via a webhook when a long or short signal is generated.
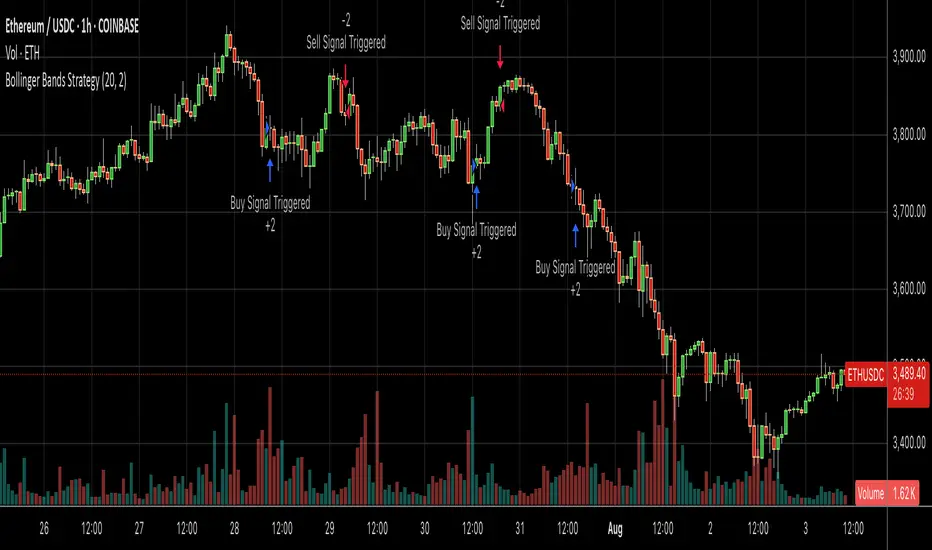
Bollinger Bands SMA 20_2 StrategyMean reversion strategy using Bollinger Bands (20-period SMA with 2.0 standard deviation bands).
Trade Triggers:
🟢 BUY SIGNAL:
When: Price crosses above the lower Bollinger Band
Logic: Price has hit oversold territory and is bouncing back
Action: Places a long position with stop at the lower band
🔴 SELL SIGNAL:
When: Price crosses below the upper Bollinger Band
Logic: Price has hit overbought territory and is pulling back
Action: Places a short position with stop at the upper band
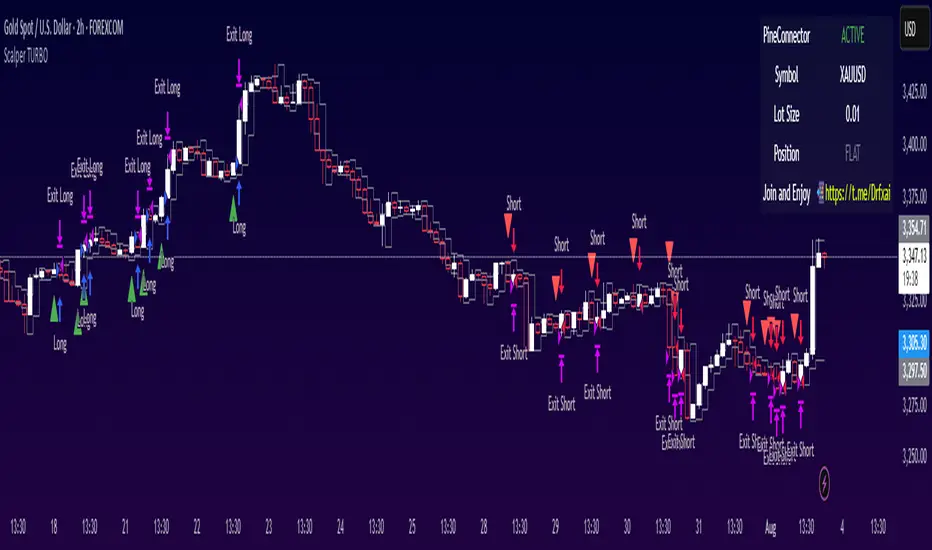
GOD Scalper TURBO Pattern Recognition & Price Action🚀 Introducing: 👑Scalper TURBO👑 – Your Ultimate TradingView Companion for High-Speed Scalping & Auto-Trading!
Trade Smarter. Trade Faster. Trade Automated.
The world's fastest scalper robot with the ability to analyze and trade in second-by-second time frames with an incredible 900% monthly profitability.
🔥 What is 👑Scalper TURBO👑?
Scalper TURBO is a high-performance Pine Script 5 strategy designed for aggressive and intelligent scalping on TradingView. It combines breakout detection, multi-indicator confirmation, time-based filtering, and full PineConnector integration for automated live trading with MetaTrader 5 (MT5). Whether you want to backtest, trade manually, or connect with MT5 via PineConnector – this tool is your edge.
⚙️ Key Features
✅ Fast Execution Logic — Uses real-time tick data with calc_on_every_tick=true
✅ EMA, SMA, RSI & ATR Filters — Combines trend, momentum, and volatility in one strategy
✅ Breakout Strategy — Trades breakouts above resistance or below support
✅ Multi-Time Filter Zones — 4 customizable intraday trading windows to avoid choppy hours
✅ PineConnector-Ready — Seamless alerts for auto-trading with MT5, customizable lot sizes
✅ Dynamic Stop Loss / Take Profit — Based on ATR multipliers for adaptable risk
✅ Trail Stop Support — Optional trailing stop-loss system
✅ Built-in Risk Labels — Live performance and signal info right on the chart
✅ Minimal Resource Usage — Pre-computed constants and cached indicators for speed
✅ Recommended Use Cases:
XAUUSD / Gold scalping (default)
1m to 5m charts (for high-frequency setups)
Live auto-trading via PineConnector
Backtesting and optimization with historical data
🧠 Pro Tips
For best results, run it during high-volume market hours (enable time filters like London/NY session).
Use trailing stop in volatile assets for maximizing gains.
Integrate with PineConnector Pro for seamless MT5 execution.
Combine with your own overlays or confirmation tools.
📣 Join the Movement
💬 Created by @DrFXAi – follow on TradingView for updates, improvements, and more elite scripts.
🚀 Ready to Automate Your Edge?
📌 Add 👑Scalper TURBO👑 to your chart today and take control of your scalping game with automation, speed, and intelligence!
💬 Need help with access, backtesting, or have any questions about our indicators?
Our support team is available 24/7 on Telegram.
Just reach out through the link below: 👉 t.me
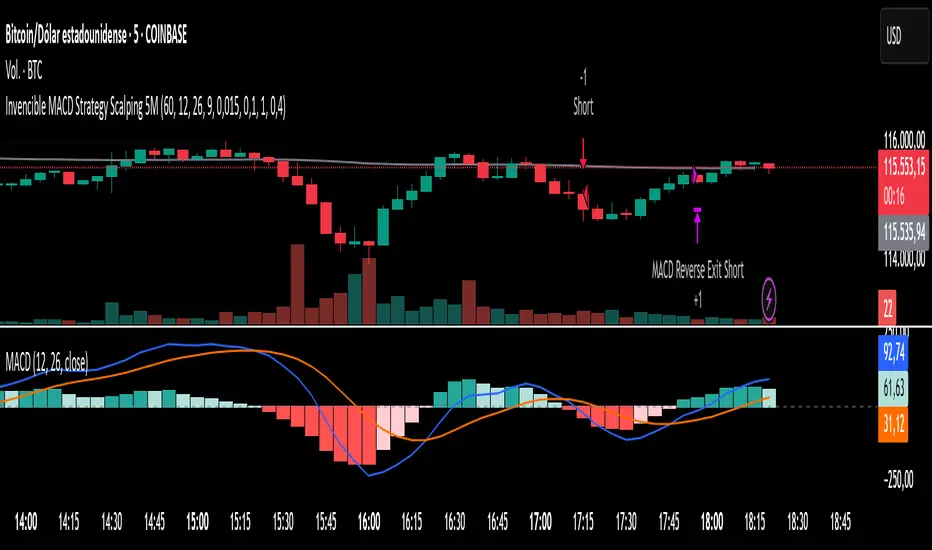
Invencible MACD Strategy Scalping 5MInvencible MACD Strategy Scalping 5M
The Invencible MACD Strategy is a precision scalping system designed for short-term traders who want to capture fast and effective entries on trending moves.
This strategy uses a multi-timeframe MACD combined with a histogram impulse filter, ATR-based volatility filter, and optional EMA200 trend confirmation to identify high-probability trade setups.
Entry Conditions:
Long Entry: When MACD crosses above Signal Line, histogram rises with sufficient impulse, ATR confirms volatility, and price is above EMA200 (optional).
Short Entry : When MACD crosses below Signal Line, histogram falls with sufficient impulse, ATR confirms volatility, and price is below EMA200 (optional).
Exit Conditions:
Take Profit and Stop Loss are calculated as fixed percentages.
A position is also closed immediately if MACD reverses and crosses in the opposite direction.
The strategy does not use trailing stops, allowing trades to fully reach their target when conditions are favorable.
Recommended use:
This strategy is optimized for 5-minute charts and works particularly well with:
XAUUSD (Gold)
BTCUSD (Bitcoin)
If you find this strategy helpful, please share it, leave a comment, and drop a like. Scalpers, give it a try and let us know how it works for you.
Los 7 Capitales
EMA Crossover with Volume + Stacked TP & Trailing SLI am relatively new here. Here is my humble contribution to the community. Simple does it! Ema 21,55 with volume. Surprisingly high win rates and good profit factors on USDJPY, EURJPY, BTCUSD, XAGUSD,XAUUSD, USOIL, USDCAD, EURGBP and AUDNZD. I cannot write a single line of code. I used Copilot for this.
Invencible MACD Strategy Scalping)Invencible MACD Strategy
The Invencible MACD Strategy is a refined scalping system designed to deliver consistent profitability by optimizing the classic MACD indicator with trend and volatility filters. This strategy is built for short-term traders looking for precision entries and favorable risk-to-reward conditions on any asset and lower timeframes such as 1m, 5m, or 15m.
Core Logic
This strategy uses a multi-timeframe (MTF) approach to calculate the MACD, Signal Line, and Histogram. Trades are executed when all of the following conditions are met:
Long Entry:
The MACD crosses above the Signal Line.
The Histogram is rising with a defined impulse threshold.
Price is above the 200 EMA, confirming an uptrend.
Volatility, measured by ATR, is above a configurable minimum.
Short Entry:
The MACD crosses below the Signal Line.
The Histogram is falling with a defined impulse threshold.
Price is below the 200 EMA, confirming a downtrend.
ATR confirms sufficient volatility.
Risk Management
Take Profit is set higher than Stop Loss to ensure that the average winning trade is greater than the average losing trade.
Trailing stop is optional and can be disabled to allow full profit capture on strong moves.
Trade size is fixed to 1 contract, suitable for scalping with low exposure.
Customizable Parameters
MACD Fast, Slow, and Signal EMAs
Histogram impulse threshold
Minimum ATR filter
Take Profit and Stop Loss percentage
Trailing Stop activation and size
Timeframe resolution (can be customized or synced with chart)
Visual Aids
MACD and Signal Line are plotted below price.
Histogram bars help visualize momentum strength.
200 EMA is plotted on the main chart to show trend direction.
This strategy was designed to prioritize quality over quantity, avoiding weak signals and improving both the win rate and profit factor. It is especially effective on assets like gold (XAUUSD), indices, cryptocurrencies, and high-liquidity stocks.
Feel free to test and optimize parameters based on your trading instrument and timeframe.
Los 7 Capitales

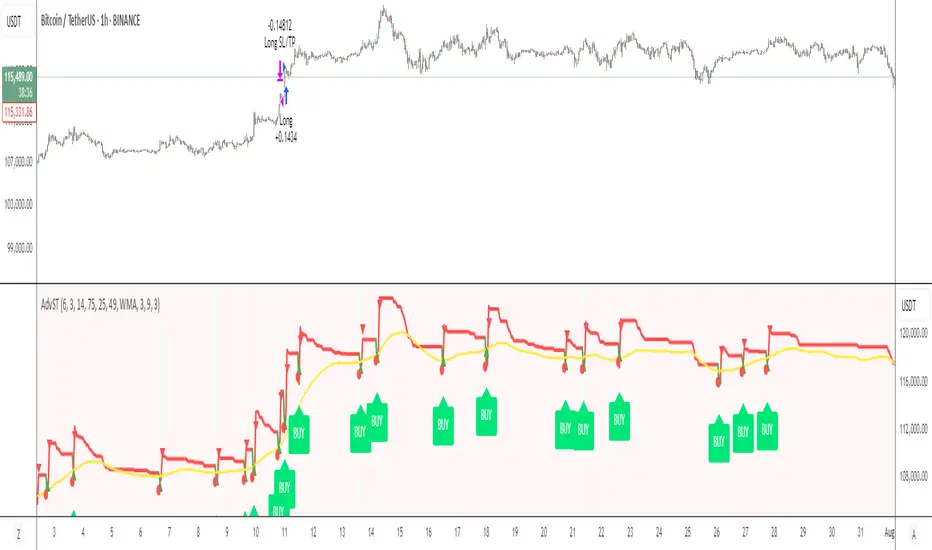
Advanced Supertrend StrategyA comprehensive Pine Script v5 strategy featuring an enhanced Supertrend indicator with multiple technical filters, risk management, and advanced signal confirmation for automated trading on TradingView.
## Features
- **Enhanced Supertrend**: Configurable ATR-based trend following with improved accuracy
- **RSI Filter**: Optional RSI-based signal filtering to avoid overbought/oversold conditions
- **Moving Average Filter**: Trend confirmation using SMA/EMA/WMA with customizable periods
- **Risk Management**: Built-in stop-loss and take-profit based on ATR multiples
- **Trend Strength Analysis**: Filters weak signals by requiring minimum trend duration
- **Breakout Confirmation**: Optional price breakout validation for stronger signals
- **Visual Interface**: Comprehensive chart plotting with multiple indicator overlays
- **Advanced Alerts**: Multiple alert conditions with detailed signal information
- **Backtesting**: Full strategy backtesting with commission and realistic execution