Indicators and strategies

DAYTRADE GPT StrategyThis is the DAYTRADE GPT Strategy — built for disciplined intraday traders aiming to grow small capital into serious gains through calculated, high-probability trades.
🔍 Strategy Overview:
- Combines Bollinger Bands, RSI, Stochastic RSI, and Volume Spike detection for precise entries.
- Auto-detects optimal LONG and SHORT positions.
- Built-in Stop Loss and Take Profit using a configurable Risk/Reward ratio (default 1:2).
- Includes dynamic trailing stop logic to scale and protect profits once in the green.
🎯 Designed for:
- Scalping and short-term trades on crypto or highly liquid assets.
- Traders who scale positions as profits increase.
- High-frequency setups backed by volume confirmation.
💡 How It Works:
- Long when price is outside lower BB, RSI < 40, Stoch RSI oversold, and volume spike detected.
- Short when price is outside upper BB, RSI > 60, Stoch RSI overbought, and volume spike detected.
- Uses trailing stop once profitable to lock in gains as price climbs.
- Fully customizable: risk ratio, trailing %, and indicator sensitivity.
📈 Goal: Turn consistent setups into strategic wins. Ideal for those growing accounts from $100 toward $100K by December through disciplined trade management.
Let the algorithm handle entry/exit while you focus on execution. Adjust settings for your market.
#Crypto #DayTrading #Scalping #PineScript #Strategy
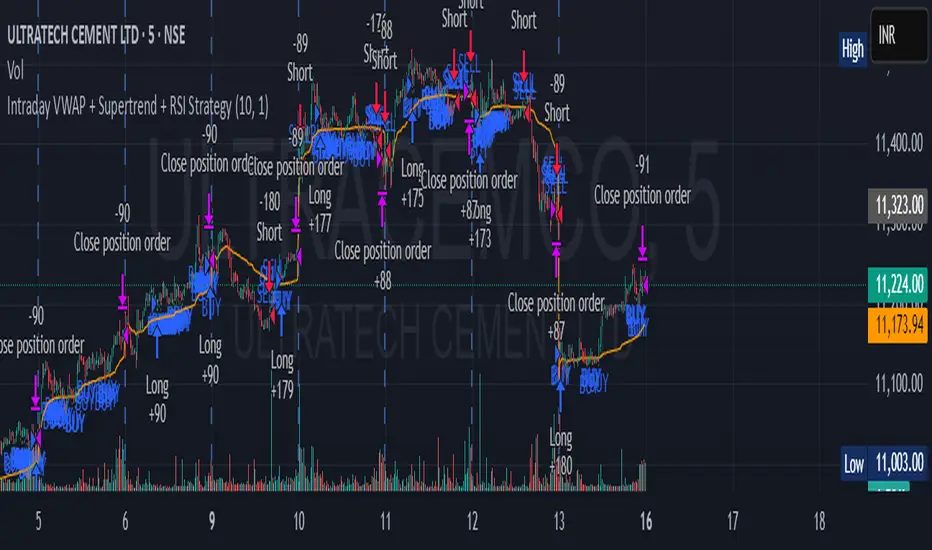
Intraday VWAP + Supertrend + RSI StrategyBased on Intraday VWAP + Supertrend + RSI Strategy
works fine

Squeeze Momentum Long-Only Strategy v5This strategy is a refined long-only version of the popular Squeeze Momentum Indicator by LazyBear, enhanced with modern multi-filter techniques for improved precision and robustness.
📈 Core Idea
The strategy aims to capture explosive upside moves after periods of low volatility ("squeeze") — confirmed by breakout momentum, strong volume, macro trend alignment, and market context. Trades are entered only long, making it suitable for bullish assets or trending environments like crypto.
🔍 How It Works
1. Squeeze Detection
Detects a "squeeze" condition when Bollinger Bands (BB) contract inside Keltner Channels (KC).
A squeeze releases (entry signal) when BB expand outside KC — implying a potential breakout.
text
Copy
Edit
sqzOff → Squeeze released → Price may expand directionally
2. Momentum Filter (Modified Squeeze Histogram)
Uses a custom linear regression-based histogram (val) to gauge price momentum.
Only enters long when:
val > 0 (bullish momentum)
val is rising for two consecutive bars (to avoid false starts)
val exceeds a configurable threshold
3. Volume Filter
Confirms strength of breakout by requiring:
text
Copy
Edit
Current volume > Volume Moving Average × Multiplier
This ensures that breakouts are backed by real participation, reducing weak or manipulated moves.
4. Trend Filter (HTF SMA)
Uses a higher timeframe (e.g., Daily) Simple Moving Average to define trend bias.
Only takes long trades if price is above the selected trend SMA (e.g., 50-period SMA on D timeframe).
Helps avoid countertrend trades during bear phases or consolidations.
5. Volatility Filter
Uses ATR to measure recent volatility.
Filters out periods of low ATR to avoid trading in choppy, compressed markets.
🎯 Entry Conditions (All Must Be True):
Squeeze releases upward (sqzOff)
Momentum (val) is positive and rising (2-bar confirmation)
Momentum exceeds a minimum strength threshold
Volume spikes above average
Price is above HTF trend SMA
ATR is above its moving average (indicating active market)
🏁 Exit Condition
Closes the trade only when val < 0 → Momentum flips bearish.
(Optional extensions like trailing stops or take-profit rules can be added.)
⚙️ Customization Options
Momentum strength threshold
Volume multiplier
ATR length & filter threshold
HTF trend timeframe (e.g., "D", "3D", "W")
Trend SMA length
KC/BB settings for squeeze tuning
📊 Best Use Cases
Crypto (BTC, ETH, altcoins in uptrends)
Equities in trending sectors
Avoid in sideways, illiquid, or heavily news-driven markets
✅ Benefits
High precision due to multi-layered confirmation
Avoids overtrading in poor conditions
Focuses on clean, high-quality breakout trades
Flexible for risk management add-ons

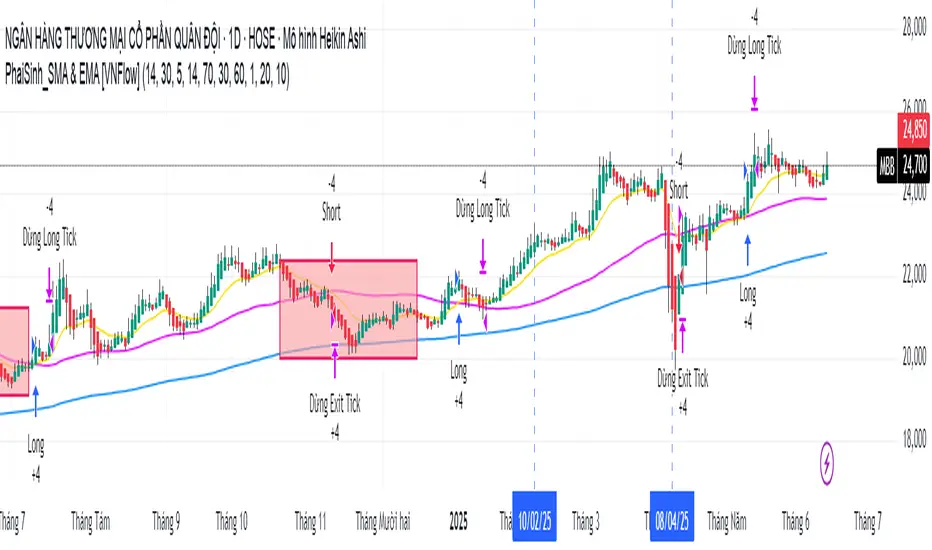
Swing Trend: 200 EMA + ATR (Long Only)🧠 Strategy Concept:
This swing trading strategy is designed specifically for Ethereum (ETH) on timeframes like 4H or Daily, but it is flexible enough to work across other volatile assets or timeframes with some tuning.
The system combines trend confirmation via a 200-period Exponential Moving Average (EMA) with volatility filtering using the Average True Range (ATR). It aims to capture medium-term bullish swings while avoiding weak or sideways markets.
📈 Entry Logic:
A long position is opened only when both of the following conditions are true:
Price is above the 200 EMA
→ This confirms a longer-term uptrend.
Price is also greater than (EMA + ATR × Multiplier)
→ This volatility buffer ensures we only enter after strong directional moves and avoid minor pullbacks or choppy price action.
The ATR multiplier is customizable (default = 1.5).
ATR length defaults to 14 periods.
✅ This double filter helps reduce false positives and ensures that entries happen only in strong bullish momentum.
💡 Exit Logic:
The exit rule is simple:
Close the position when the price crosses below the 200 EMA, indicating a potential trend reversal or weakening trend.
This approach:
Protects gains by exiting early during trend breakdowns.
Avoids unnecessary complexity like static stop-loss or take-profit.
You can manually add SL/TP logic if desired.
⚙️ Strategy Settings:
EMA Length = 200
ATR Length = 14
ATR Multiplier = 1.5
Position Sizing = 10% of equity per trade (adjustable in strategy settings)
📊 Use Case:
Optimized for swing traders who prefer long-only positions in bull markets.
Particularly effective on ETHUSDT, but applicable to BTC, SOL, etc.
Best used during periods of trending market behavior — avoid sideways or range-bound conditions.
🛠️ Customization Tips:
Timeframe: Works best on 4H or 1D charts; avoid low timeframes unless volatility filtering is adjusted.
EMA Length: Increase to 300–400 for more conservative filtering.
ATR Multiplier: Raise to 2–2.5 to reduce frequency of entries and increase selectivity.
Stop-loss / Take-profit: You can add static or trailing SL/TP for tighter risk control if desired.
📌 Strategy Summary:
Feature Setting
Trend Filter 200 EMA
Volatility Gate ATR (×1.5)
Entry Type Long only
Exit Trigger Close < EMA
Style Trend-following Swing Strategy

VWAP Divergence | Flux ChartsVWAP Divergence indicator by FluxCharts turned strategy, with trailing stop-loss capabilities. Will give entry signals for Divergences'. Also has calculations for positions.

Smart Composite Strategy {Darkoexe}This strategy is a multi-confirmation trend-based system that combines several powerful community concepts into a cohesive trade automation framework. It’s designed to help identify high-probability directional trades with built-in dynamic exits, take-profits, and intelligent trend filters.
🧩 What Makes It Unique
Rather than relying on a single signal or open-source indicator, this strategy blends three well-established concepts:
G-Trend Reversal Detection – A trailing ATR-based trend switch logic to determine core market direction.
Bull/Bear Candle Momentum Filter – Counts candle colors over a lookback period to evaluate directional conviction.
Multi-timeframe CCI Rider & Ultimate RSI – Uses smoothed momentum values to confirm continuation and strength.
Trades are only entered when all modules are in agreement — filtering out noisy entries and aligning with prevailing momentum.
⚙️ Strategy Components
Entry Triggers:
A confirmed trend switch via G-Trend logic.
Favorable bullish or bearish candle momentum.
Multi-timeframe momentum alignment using:
CCI EMA
Augmented RSI signal line
Exits:
Optional G-Trend signal reversal exit.
Configurable stop-loss and take-profit levels, based on percentages.
Partial TP1-based exit, with dynamic stop-loss movement to entry upon trigger.
Customization:
Backtesting window control (start/end date).
Toggle for stop loss, take profit, TP1 percent, and SL trail logic.
Toggle to use or skip trend-based exit logic.
🎯 Use Case
This strategy is best suited for:
Swing traders or intraday trend-followers.
Users wanting layered confirmation rather than single-indicator entries.
Markets with clear institutional flows or trending behavior.
⚠️ Notes & Limitations
This strategy uses components from other publicly available indicators, including:
G-Trend
CCI Rider by Stefan Loosli
Ultimate RSI by LuxAlgo
All code has been integrated and adapted into a unified logic tree.
The strategy operates using historical price data and may not account for real-time slippage or fees.
Always forward test in live or paper environments before relying on performance.
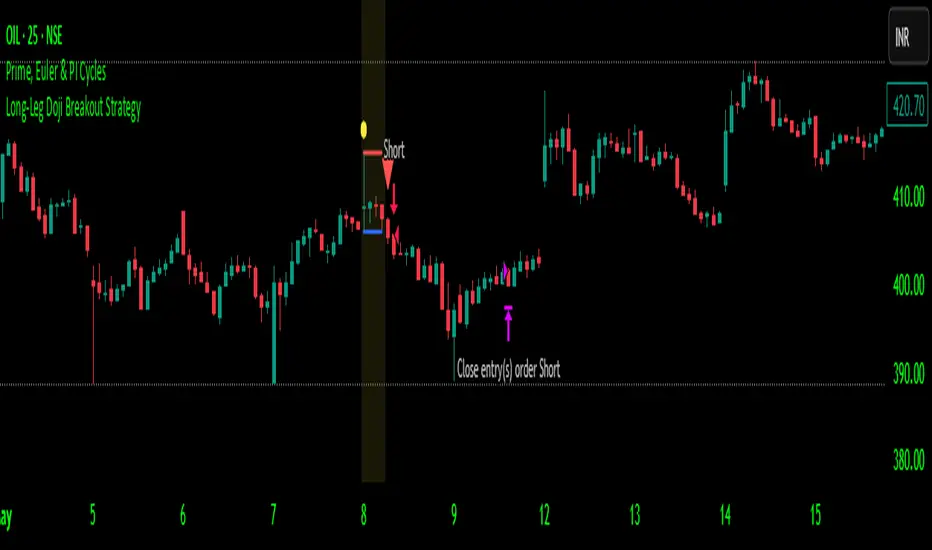
Long-Leg Doji Breakout StrategyThe Long-Leg Doji Breakout Strategy is a sophisticated technical analysis approach that capitalizes on market psychology and price action patterns.
Core Concept: The strategy identifies Long-Leg Doji candlestick patterns, which represent periods of extreme market indecision where buyers and sellers are in equilibrium. These patterns often precede significant price movements as the market resolves this indecision.
Pattern Recognition: The algorithm uses strict mathematical criteria to identify authentic Long-Leg Doji patterns. It requires the candle body to be extremely small (≤0.1% of the total range) while having long wicks on both sides (at least 2x the body size). An ATR filter ensures the pattern is significant relative to recent volatility.
Trading Logic: Once a Long-Leg Doji is identified, the strategy enters a "waiting mode," monitoring for a breakout above the doji's high (long signal) or below its low (short signal). This confirmation approach reduces false signals by ensuring the market has chosen a direction.
Risk Management: The strategy allocates 10% of equity per trade and uses a simple moving average crossover for exits. Visual indicators help traders understand the pattern identification and trade execution process.
Psychological Foundation: The strategy exploits the natural market cycle where uncertainty (represented by the doji) gives way to conviction (the breakout), creating high-probability trading opportunities.
The strength of this approach lies in its ability to identify moments when market sentiment shifts from confusion to clarity, providing traders with well-defined entry and exit points while maintaining proper risk management protocols.
How It Works
The strategy operates on a simple yet powerful principle: identify periods of market indecision, then trade the subsequent breakout when the market chooses direction.
Step 1: Pattern Detection
The algorithm scans for Long-Leg Doji candles, which have three key characteristics:
Tiny body (open and close prices nearly equal)
Long upper wick (significant rejection of higher prices)
Long lower wick (significant rejection of lower prices)
Step 2: Confirmation Wait
Once a doji is detected, the strategy doesn't immediately trade. Instead, it marks the high and low of that candle and waits for a definitive breakout.
Step 3: Trade Execution
Long Entry: When price closes above the doji's high
Short Entry: When price closes below the doji's low
Step 4: Exit Strategy
Positions are closed when price crosses back through a 20-period moving average, indicating potential trend reversal.
Market Psychology Behind It
A Long-Leg Doji represents a battlefield between bulls and bears that ends in a stalemate. The long wicks show that both sides tried to push price in their favor but failed. This creates a coiled spring effect - when one side finally gains control, the move can be explosive as trapped traders rush to exit and momentum traders jump aboard.
Key Parameters
Doji Body Threshold (0.1%): Ensures the body is truly small relative to the candle's range
Wick Ratio (2.0): Both wicks must be at least twice the body size
ATR Filter: Uses Average True Range to ensure the pattern is significant in current market conditions
Position Size: 10% of equity per trade for balanced risk management
Pros:
High Probability Setups: Doji patterns at key levels often lead to significant moves as they represent genuine shifts in market sentiment.
Clear Rules: Objective criteria for entry and exit eliminate emotional decision-making and provide consistent execution.
Risk Management: Built-in position sizing and exit rules help protect capital during losing trades.
Market Neutral: Works equally well for long and short positions, adapting to market direction rather than fighting it.
Visual Confirmation: The strategy provides clear visual cues, making it easy to understand when patterns are forming and trades are triggered.
Cons:
False Breakouts: In choppy or ranging markets, price may break the doji levels only to quickly reverse, creating whipsaws.
Patience Required: Traders must wait for both pattern formation and breakout confirmation, which can test discipline during active market periods.
Simple Exit Logic: The moving average exit may be too simplistic, potentially cutting profits short during strong trends or holding losers too long during reversals.
Volatility Dependent: The strategy relies on sufficient volatility to create meaningful doji patterns - it may underperform in extremely quiet markets.
Lagging Entries: Waiting for breakout confirmation means missing the very beginning of moves, reducing potential profit margins.
Best Market Conditions
The strategy performs optimally during periods of moderate volatility when markets are making genuine directional decisions rather than just random noise. It works particularly well around key support/resistance levels where the market's indecision is most meaningful.
Optimization Considerations
Consider combining with additional confluence factors like volume analysis, support/resistance levels, or other technical indicators to improve signal quality. The exit strategy could also be enhanced with trailing stops or multiple profit targets to better capture extended moves while protecting gains.
Best for Index option,
Enjoy !!
Canuck Trading Trader StrategyCanuck Trading Trader Strategy
Overview
The Canuck Trading Trader Strategy is a powerful, trend-following trading system designed for day traders seeking high-probability setups on volatile stocks like Tesla (NASDAQ:TSLA). Built for the 15-minute timeframe, this strategy combines momentum, volume, price action, VWAP, and Smart Money Concepts (SMC) to identify optimal entry and exit points. With a sleek, minimalist visual design, it delivers clear buy/sell signals and dynamic trend columns, making it easy to spot market opportunities. The Canuck Trader spin offers a unique blend of precision and style.
Key Features
The strategy leverages a T3-smoothed trend oscillator, combining fast (3-period) and slow (15-period) EMAs with RSI to detect momentum shifts. Entries are triggered when the trend rises above its 10-bar SMA, supported by VWAP alignment, optional SMC value zones, high volume, and price action patterns (HH/HL for buys, LH/LL for sells). Exits use dynamic ATR-based stops and take-profits, with a trailing stop to capture extended moves.
Usage Instructions
Watch for buy and sell signals, plotted at trade entry points.
Customize inputs (e.g., volume_threshold, atr_multiplier_sl/tp) via the settings panel to tweak trade frequency or risk.
Set alerts for "Buy Signal" or "Sell Signal" to catch real-time opportunities.
For best results, use a premium TradingView plan for full intraday data access.
Customization
Adjust momentum_ema_fast/slow for faster or slower trend detection.
Modify volume_threshold (default 0.7) to filter volume spikes.
Tweak atr_multiplier_sl (1.2) and atr_multiplier_tp (1.5) for risk/reward preferences.
Change column/signal colors in the Style tab for your preferred look.
Notes
Born from relentless iteration and a passion for precision, the Canuck Trading Trader Strategy blends cutting-edge technicals with a bold, minimalist design. Whether you’re scalping TSLA’s intraday swings or riding multi-bar trends, this strategy delivers the edge you need with a distinctly Canadian flair. Trade smart, trade Canuck!
Feedback
If you encounter issues (e.g., label overlap, projection mismatches), please share your timeframe, settings, or a screenshot. Suggestions for enhancements (e.g., additional filters, visual tweaks) are welcome!
Disclaimer
The Canuck Trading Projection Indicator is provided for educational and informational purposes only. It is not financial advice. Trading involves significant risks, and past performance is not indicative of future results. Always perform your own due diligence and consult a qualified financial advisor before making trading decisions.

R2 Breakout Simple StrategyStrategy working with R2 level from Pivot Points indicador in order to detect strenght on bullish direction and enter once the price crosses the level.
Working on EURUSD and other Forex pairs.

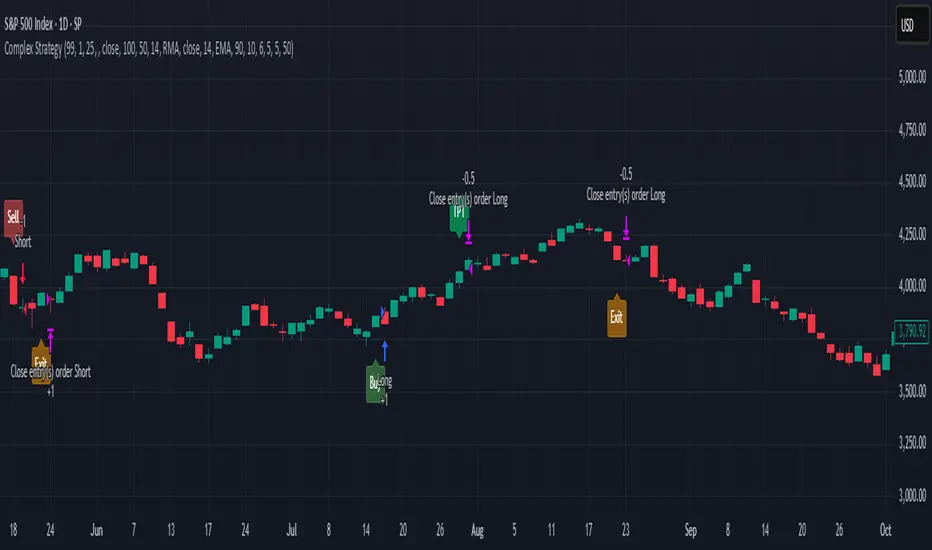
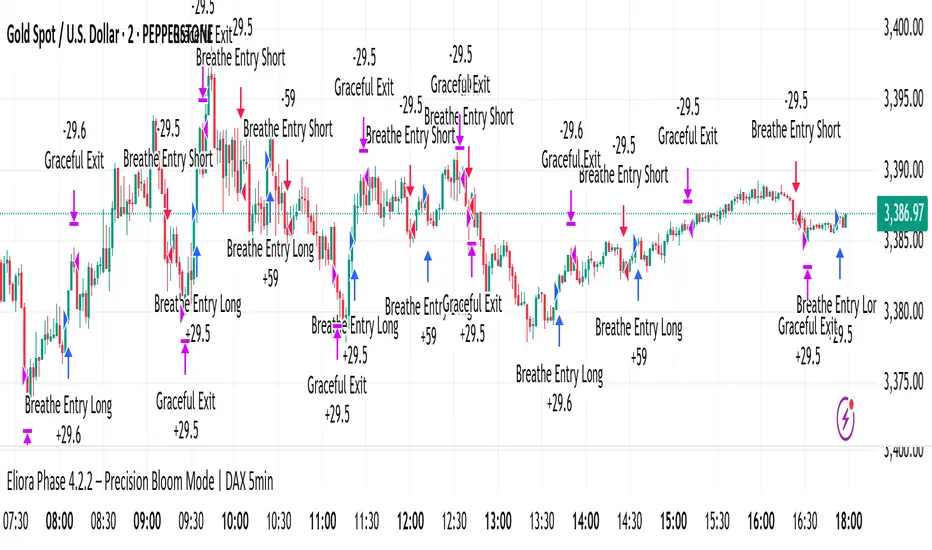
Eliora Phase 4.2.2 – Precision Bloom Mode | DAX 5minPhase shifts and market cohesion using math. Sure! Let’s break down the **simple trading bot concept** for **TradingView** step by step, focusing on the logic, purpose, and key elements of the strategy. This bot uses a **trend-following strategy** combined with **risk management** to automate trades based on moving averages and the RSI indicator.
---
### **Trading Bot Concept:**
#### **Objective:**
The primary objective of this bot is to **identify trends** and **execute buy and sell orders** based on those trends, while also ensuring **risk management** through stop-loss and take-profit levels.
The bot uses two **core indicators**:
* **Exponential Moving Averages (EMAs)**: To identify the trend direction.
* **Relative Strength Index (RSI)**: To filter out overbought and oversold conditions, helping avoid entering trades during extreme market conditions.
---
### **Key Components:**
#### 1. **Exponential Moving Averages (EMA)**
* **50-period EMA** (Short-Term Trend): Tracks the price's movement in the recent past, offering more weight to recent prices. This helps the bot react quicker to short-term market shifts.
* **200-period EMA** (Long-Term Trend): Represents the broader market trend, helping the bot assess the overall market direction.
**Buy Signal**:
* A buy signal is triggered when the **50-period EMA crosses above** the **200-period EMA** (a **bullish crossover**), suggesting that the market is entering an uptrend.
**Sell Signal**:
* A sell signal is triggered when the **50-period EMA crosses below** the **200-period EMA** (a **bearish crossover**), indicating that the market might be reversing into a downtrend.
#### 2. **Relative Strength Index (RSI)**
* **RSI** is a momentum oscillator that measures the speed and change of price movements, indicating whether an asset is overbought or oversold.
* **Buy Condition**: The bot only takes buy trades if the **RSI is above 30**. This ensures that the market isn't in an **oversold** condition, which could indicate a potential reversal.
* **Sell Condition**: The bot will only take sell actions if the **RSI is below 70**, avoiding trades during **overbought** conditions where prices might be excessively high.
---
### **How the Bot Works:**
1. **Buy Signal Conditions:**
* The **50-period EMA** crosses **above** the **200-period EMA** (bullish crossover), indicating the potential start of an uptrend.
* The **RSI is above 30**, ensuring that the market isn’t oversold and a reversal isn’t imminent.
* If both of these conditions are true, the bot will **enter a long (buy) position**.
2. **Sell Signal Conditions:**
* The **50-period EMA** crosses **below** the **200-period EMA** (bearish crossover), signaling that the market might be transitioning into a downtrend.
* The **RSI is below 70**, meaning the market isn’t in an overbought state and the sell-off is not due to excessive bullish momentum.
* If both of these conditions are met, the bot will **exit** any long position (i.e., sell).
---
### **Risk Management:**
To protect against significant losses, the bot includes two essential features of **risk management**:
1. **Stop-Loss**:
* The bot will automatically **exit the trade if the price moves against it by 2%** (or another user-defined percentage). This minimizes potential losses in case the market moves unfavorably after entry.
2. **Take-Profit**:
* The bot will automatically **exit the trade once it reaches a profit of 5%** (or another user-defined percentage). This locks in profits if the market moves favorably.
---
### **Script Breakdown:**
Here’s the **key flow** of the Pine Script:
1. **Define Parameters**: The script begins by defining input values for the **EMA periods** and **RSI length**. It also defines the **RSI overbought (70)** and **RSI oversold (30)** levels.
2. **Calculate the EMAs and RSI**:
* The 50-period and 200-period **EMAs** are calculated using the `ta.ema()` function.
* The **RSI** is calculated using `ta.rsi()`, and it helps determine if the asset is overbought or oversold.
3. **Trading Conditions**:
* A buy signal is generated when the **short-term EMA crosses above** the **long-term EMA** and the RSI is **above 30**.
* A sell signal is triggered when the **short-term EMA crosses below** the **long-term EMA** and the RSI is **below 70**.
4. **Strategy Execution**:
* When the buy condition is met, the bot **enters a long position** using `strategy.entry()`.
* When the sell condition is met, the bot **closes the position** using `strategy.close()`.
5. **Risk Management**:
* The `strategy.exit()` function is used to set **stop-loss** and **take-profit** values. If the price moves **2% against** the trade, the bot will exit. If it moves **5% in favor**, it will lock in profits.
---
### **Visual Elements**:
1. **EMAs**:
* The **50-period EMA** is plotted in **green**.
* The **200-period EMA** is plotted in **red**.
2. **RSI**:
* The **RSI line** is plotted in **blue** on a separate pane below the main chart.
* Horizontal lines mark the **overbought** (70) and **oversold** (30) levels, helping visualize potential reversal zones.
3. **Buy and Sell Signals**:
* When the bot triggers a buy, a **green arrow** appears on the chart.
* When it triggers a sell, a **red arrow** appears on the chart.
---
### **How to Use the Bot on TradingView:**
1. **Go to TradingView** and open a chart of the asset you want to trade.
2. **Click on the "Pine Editor"** tab at the bottom.
3. **Paste the script** provided into the editor.
4. **Click "Add to Chart"** to see the strategy in action.
5. The bot will begin executing trades based on the logic described and display buy/sell signals directly on the chart.
---
### **Advantages of This Strategy**:
* **Trend-Following**: This bot is based on the classic moving average crossover strategy, which is effective in trending markets.
* **Simple and Clear**: The logic is easy to follow and understand, making it beginner-friendly.
* **Built-in Risk Management**: The stop-loss and take-profit functionality ensures that the bot limits potential losses and locks in profits automatically.
* **Customizable**: You can easily tweak the parameters (e.g., EMA periods, RSI levels, stop-loss, take-profit) to fit different timeframes or market conditions.
---
### **Limitations**:
* **Sideways Markets**: The bot might struggle in flat or sideways markets because moving average crossovers can produce false signals.
* **No Advanced Features**: It doesn’t incorporate more advanced strategies like **momentum indicators**, **news sentiment**, or **machine learning models** for decision-making.
---
### **In Conclusion:**
This is a **basic but effective trend-following trading bot** that you can deploy on TradingView with minimal effort. It provides a great foundation for traders who want to automate a simple strategy with **risk management**, while offering plenty of room for customization and improvement.
Let me know if you want to explore more complex features or strategies, or if you need help tweaking the bot for specific assets or markets!
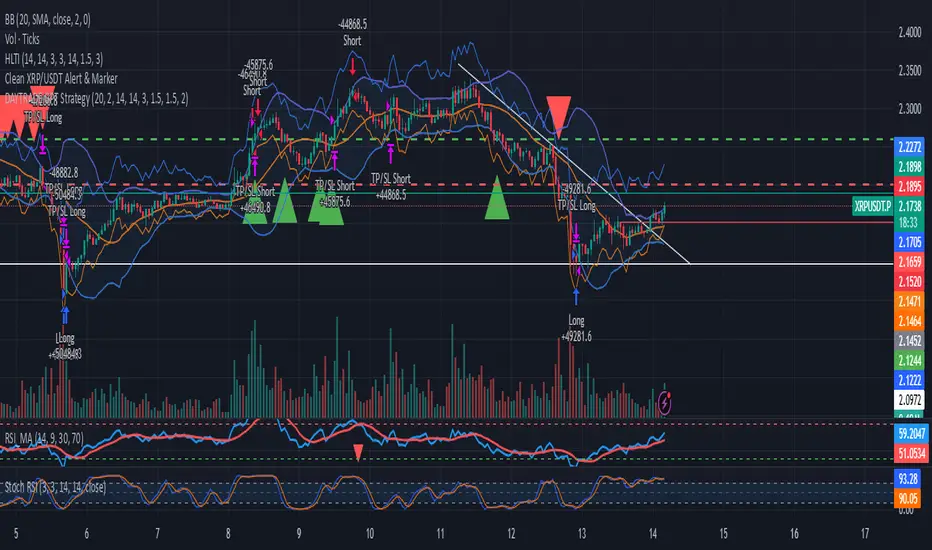
RSI Divergence StrategyOverview
The RSI Divergence Strategy Indicator is a trading tool that uses the RSI and divergences created to generate high-probability buy and sell signals.
I have provided the best formula of numbers to use for BTC on a 30 minute timeframe.
You can change where on RSI you enter and exit both long or short trades. This way you can experiment on different tokens using different entry/exit points. Can use on multiple timeframes.
This strategy is designed to open and close long or short trades based on the levels you provide it. You can then check on the RSI where the best levels are for each token you want to trade and amend it as required to generate a profitable strategy.
How It Works
The RSI Divergence Strategy Indicator uses bear and bull divergences in conjuction with a level you have input on the RSI.
RSI for Overbought/Oversold:
• Input variables for entry and exit levels and when the entry levels combine with a bear or bull divergence signal, a trade is alerted.
RSI Divergence:
• Buy and sell signals are confirmed when the RSI creates bearish or bullish divergences and these divergences are in the same area as your levels you input for entry to short or long.
After 7 years of experience and testing I have calculated the exact numbers required and produced a formula to calculate the exact input variables for a 30 minute Bitcoin chart.
Key Features
1️⃣ Divergence Identification – Ensures trades are taken only when a bull or bear divergence has formed.
2️⃣ Overbought/Oversold Input Filtering – Set up your own variables on the RSI for different markets after identifying patterns on the RSI in relation to a bearish or bullish divergence.
3️⃣ Works on any chart – Suitable for all markets and timeframes once you input the correct variables for entry and exit levels.
How to Use
🟢 Basic Trading:
• Use on any timeframe.
• Enter trade only when alert has fired off. Close when it says to exit.
• Change entry and exit levels in the properties of the strategy indicator.
• Make entry and exit levels coincide with bearish or bullish divergences on the RSI.
Check the strategy tester to see backtesting so you know if the indicator is profitable or not for that market and timeframe as each crypto token is different and so is the timeframe you choose.
📢 Webhook Automation:
• Set up TradingView Alerts to auto-execute trades via Webhook-compatible platforms.
Key additions for divergence visualization:
Divergence Arrows:
Bullish divergence: Green label with white 'bull ' text
Bearish divergence: Red label with white 'bear' text
Positioned at the pivot point
Divergence Lines:
Connects consecutive RSI pivot points
Automatically drawn between consecutive pivot points
Enhanced RSI Coloring:
Overbought zone: Red
Oversold zone: Green
Neutral zone: Gray
The visualization helps you instantly spot:
Where divergences are forming on the RSI
The pattern of higher lows (bullish) or lower highs (bearish)
Contextual coloring of RSI relative to standard levels
All divergence markers appear at the correct historical pivot points, making it easy to visually confirm divergence patterns as they develop.
Strategy levels and background zones also shown to help visual look.
Why This Combination?
This indicator is just a simple RSI tool.
It is designed to filter out weak trades and only execute trades that have:
✅ RSI Divergence
✅ Overbought or Oversold Conditions
It does not calculate downtrends or bear markets so care is recommended taking long trades during these times.
Why It’s Worth Using?
📈 Open Source – Free to use and learn from.
📉 Long or Short Term Trading Style – Entry/Exit parameters options are designed for both short or long term trades allowing you to experiment until you find a profitable strategy for that market you want to trade.
📢 Seamless Webhook Automation – Execute trades automatically with TradingView alerts.
💲 Ready to trade smarter?
✅ Add the RSI Divergence Strategy Indicator to your TradingView chart.

Adaptive Momentum Scalper (AMS) - ADX/RSI Filters Fixed### 📘 Strategy Description: **Adaptive Momentum Scalper (AMS) – Prop Firm Edition**
The **Adaptive Momentum Scalper (AMS)** is a breakout-based trend-following strategy designed with **prop firm trading rules and risk management** in mind. It combines volatility, momentum, and trend filters with dynamic sizing to manage risk across changing market conditions.
#### ✅ Core Features:
* **Breakout Logic**: Enters long or short when price breaks above/below a short-term range.
* **Momentum Filter**: Confirms breakouts with ATR-based price momentum.
* **Trend Filter**: Uses EMA(20) to ensure directional bias.
* **Volatility Filter**: Requires ATR > ATR average to avoid choppy zones.
* **ADX Filter (Optional)**: Confirms strength of trend (default ADX > 20).
* **RSI Zone Filter (Optional)**: Limits long trades to RSI > 50, shorts to RSI < 50.
* **Dynamic Position Sizing**: Risk-based lot sizing tied to ATR and account equity.
* **Hard SL/TP or Time-Based Exit**: Trades close by target, stop, or max bars in trade.
* **Session Filtering**: Trade only within configured hours (to avoid high spread periods).
* **Prop Firm Safety-Oriented**: Configurable to stay within max drawdown rules.
---
### ⚙️ Settings:
* **Risk per Trade** (% of equity)
* **ATR multipliers** for stop loss and take profit
* **Trading hours** (e.g. 1 AM to 10 PM EST)
* **Max bars in trade before exit**
* **Enable/disable**:
* ADX filter
* RSI filter
---
### 🎯 Ideal Use:
* Scalping on **Gold (XAUUSD)** or other volatile assets.
* Forward testing under prop firm conditions (3% daily / 6% max drawdown).
* Identifying breakout opportunities with strong trend and momentum backing.

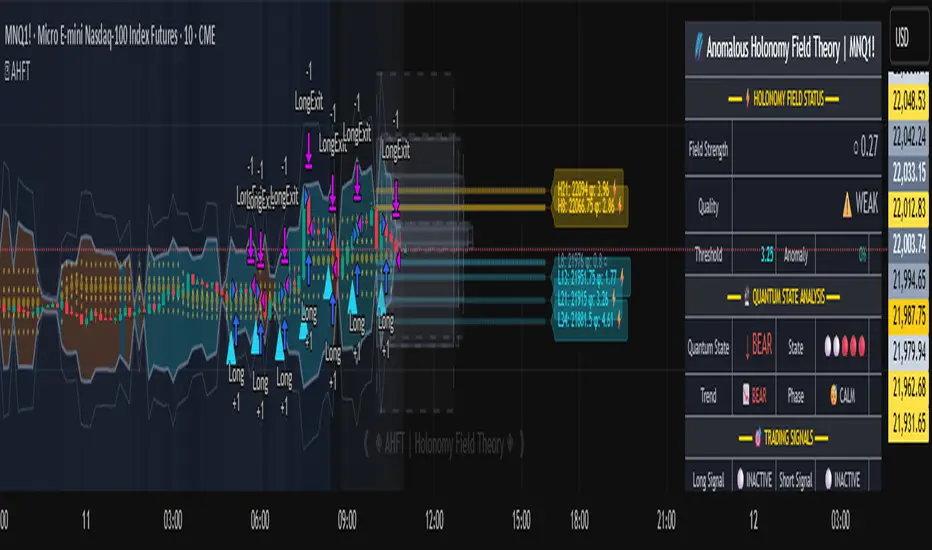
Anomalous Holonomy Field Theory🌌 Anomalous Holonomy Field Theory (AHFT) - Revolutionary Quantum Market Analysis
Where Theoretical Physics Meets Trading Reality
A Groundbreaking Synthesis of Differential Geometry, Quantum Field Theory, and Market Dynamics
🔬 THEORETICAL FOUNDATION - THE MATHEMATICS OF MARKET REALITY
The Anomalous Holonomy Field Theory represents an unprecedented fusion of advanced mathematical physics with practical market analysis. This isn't merely another indicator repackaging old concepts - it's a fundamentally new lens through which to view and understand market structure .
1. HOLONOMY GROUPS (Differential Geometry)
In differential geometry, holonomy measures how vectors change when parallel transported around closed loops in curved space. Applied to markets:
Mathematical Formula:
H = P exp(∮_C A_μ dx^μ)
Where:
P = Path ordering operator
A_μ = Market connection (price-volume gauge field)
C = Closed price path
Market Implementation:
The holonomy calculation measures how price "remembers" its journey through market space. When price returns to a previous level, the holonomy captures what has changed in the market's internal geometry. This reveals:
Hidden curvature in the market manifold
Topological obstructions to arbitrage
Geometric phase accumulated during price cycles
2. ANOMALY DETECTION (Quantum Field Theory)
Drawing from the Adler-Bell-Jackiw anomaly in quantum field theory:
Mathematical Formula:
∂_μ j^μ = (e²/16π²)F_μν F̃^μν
Where:
j^μ = Market current (order flow)
F_μν = Field strength tensor (volatility structure)
F̃^μν = Dual field strength
Market Application:
Anomalies represent symmetry breaking in market structure - moments when normal patterns fail and extraordinary opportunities arise. The system detects:
Spontaneous symmetry breaking (trend reversals)
Vacuum fluctuations (volatility clusters)
Non-perturbative effects (market crashes/melt-ups)
3. GAUGE THEORY (Theoretical Physics)
Markets exhibit gauge invariance - the fundamental physics remains unchanged under certain transformations:
Mathematical Formula:
A'_μ = A_μ + ∂_μΛ
This ensures our signals are gauge-invariant observables , immune to arbitrary market "coordinate changes" like gaps or reference point shifts.
4. TOPOLOGICAL DATA ANALYSIS
Using persistent homology and Morse theory:
Mathematical Formula:
β_k = dim(H_k(X))
Where β_k are the Betti numbers describing topological features that persist across scales.
🎯 REVOLUTIONARY SIGNAL CONFIGURATION
Signal Sensitivity (0.5-12.0, default 2.5)
Controls the responsiveness of holonomy field calculations to market conditions. This parameter directly affects the threshold for detecting quantum phase transitions in price action.
Optimization by Timeframe:
Scalping (1-5min): 1.5-3.0 for rapid signal generation
Day Trading (15min-1H): 2.5-5.0 for balanced sensitivity
Swing Trading (4H-1D): 5.0-8.0 for high-quality signals only
Score Amplifier (10-200, default 50)
Scales the raw holonomy field strength to produce meaningful signal values. Higher values amplify weak signals in low-volatility environments.
Signal Confirmation Toggle
When enabled, enforces additional technical filters (EMA and RSI alignment) to reduce false positives. Essential for conservative strategies.
Minimum Bars Between Signals (1-20, default 5)
Prevents overtrading by enforcing quantum decoherence time between signals. Higher values reduce whipsaws in choppy markets.
👑 ELITE EXECUTION SYSTEM
Execution Modes:
Conservative Mode:
Stricter signal criteria
Higher quality thresholds
Ideal for stable market conditions
Adaptive Mode:
Self-adjusting parameters
Balances signal frequency with quality
Recommended for most traders
Aggressive Mode:
Maximum signal sensitivity
Captures rapid market moves
Best for experienced traders in volatile conditions
Dynamic Position Sizing:
When enabled, the system scales position size based on:
Holonomy field strength
Current volatility regime
Recent performance metrics
Advanced Exit Management:
Implements trailing stops based on ATR and signal strength, with mode-specific multipliers for optimal profit capture.
🧠 ADAPTIVE INTELLIGENCE ENGINE
Self-Learning System:
The strategy analyzes recent trade outcomes and adjusts:
Risk multipliers based on win/loss ratios
Signal weights according to performance
Market regime detection for environmental adaptation
Learning Speed (0.05-0.3):
Controls adaptation rate. Higher values = faster learning but potentially unstable. Lower values = stable but slower adaptation.
Performance Window (20-100 trades):
Number of recent trades analyzed for adaptation. Longer windows provide stability, shorter windows increase responsiveness.
🎨 REVOLUTIONARY VISUAL SYSTEM
1. Holonomy Field Visualization
What it shows: Multi-layer quantum field bands representing market resonance zones
How to interpret:
Blue/Purple bands = Primary holonomy field (strongest resonance)
Band width = Field strength and volatility
Price within bands = Normal quantum state
Price breaking bands = Quantum phase transition
Trading application: Trade reversals at band extremes, breakouts on band violations with strong signals.
2. Quantum Portals
What they show: Entry signals with recursive depth patterns indicating momentum strength
How to interpret:
Upward triangles with portals = Long entry signals
Downward triangles with portals = Short entry signals
Portal depth = Signal strength and expected momentum
Color intensity = Probability of success
Trading application: Enter on portal appearance, with size proportional to portal depth.
3. Field Resonance Bands
What they show: Fibonacci-based harmonic price zones where quantum resonance occurs
How to interpret:
Dotted circles = Minor resonance levels
Solid circles = Major resonance levels
Color coding = Resonance strength
Trading application: Use as dynamic support/resistance, expect reactions at resonance zones.
4. Anomaly Detection Grid
What it shows: Fractal-based support/resistance with anomaly strength calculations
How to interpret:
Triple-layer lines = Major fractal levels with high anomaly probability
Labels show: Period (H8-H55), Price, and Anomaly strength (φ)
⚡ symbol = Extreme anomaly detected
● symbol = Strong anomaly
○ symbol = Normal conditions
Trading application: Expect major moves when price approaches high anomaly levels. Use for precise entry/exit timing.
5. Phase Space Flow
What it shows: Background heatmap revealing market topology and energy
How to interpret:
Dark background = Low market energy, range-bound
Purple glow = Building energy, trend developing
Bright intensity = High energy, strong directional move
Trading application: Trade aggressively in bright phases, reduce activity in dark phases.
📊 PROFESSIONAL DASHBOARD METRICS
Holonomy Field Strength (-100 to +100)
What it measures: The Wilson loop integral around price paths
>70: Strong positive curvature (bullish vortex)
<-70: Strong negative curvature (bearish collapse)
Near 0: Flat connection (range-bound)
Anomaly Level (0-100%)
What it measures: Quantum vacuum expectation deviation
>70%: Major anomaly (phase transition imminent)
30-70%: Moderate anomaly (elevated volatility)
<30%: Normal quantum fluctuations
Quantum State (-1, 0, +1)
What it measures: Market wave function collapse
+1: Bullish eigenstate |↑⟩
0: Superposition (uncertain)
-1: Bearish eigenstate |↓⟩
Signal Quality Ratings
LEGENDARY: All quantum fields aligned, maximum probability
EXCEPTIONAL: Strong holonomy with anomaly confirmation
STRONG: Good field strength, moderate anomaly
MODERATE: Decent signals, some uncertainty
WEAK: Minimal edge, high quantum noise
Performance Metrics
Win Rate: Rolling performance with emoji indicators
Daily P&L: Real-time profit tracking
Adaptive Risk: Current risk multiplier status
Market Regime: Bull/Bear classification
🏆 WHY THIS CHANGES EVERYTHING
Traditional technical analysis operates on 100-year-old principles - moving averages, support/resistance, and pattern recognition. These work because many traders use them, creating self-fulfilling prophecies.
AHFT transcends this limitation by analyzing markets through the lens of fundamental physics:
Markets have geometry - The holonomy calculations reveal this hidden structure
Price has memory - The geometric phase captures path-dependent effects
Anomalies are predictable - Quantum field theory identifies symmetry breaking
Everything is connected - Gauge theory unifies disparate market phenomena
This isn't just a new indicator - it's a new way of thinking about markets . Just as Einstein's relativity revolutionized physics beyond Newton's mechanics, AHFT revolutionizes technical analysis beyond traditional methods.
🔧 OPTIMAL SETTINGS FOR MNQ 10-MINUTE
For the Micro E-mini Nasdaq-100 on 10-minute timeframe:
Signal Sensitivity: 2.5-3.5
Score Amplifier: 50-70
Execution Mode: Adaptive
Min Bars Between: 3-5
Theme: Quantum Nebula or Dark Matter
💭 THE JOURNEY - FROM IMPOSSIBLE THEORY TO TRADING REALITY
Creating AHFT was a mathematical odyssey that pushed the boundaries of what's possible in Pine Script. The journey began with a seemingly impossible question: Could the profound mathematical structures of theoretical physics be translated into practical trading tools?
The Theoretical Challenge:
Months were spent diving deep into differential geometry textbooks, studying the works of Chern, Simons, and Witten. The mathematics of holonomy groups and gauge theory had never been applied to financial markets. Translating abstract mathematical concepts like parallel transport and fiber bundles into discrete price calculations required novel approaches and countless failed attempts.
The Computational Nightmare:
Pine Script wasn't designed for quantum field theory calculations. Implementing the Wilson loop integral, managing complex array structures for anomaly detection, and maintaining computational efficiency while calculating geometric phases pushed the language to its limits. There were moments when the entire project seemed impossible - the script would timeout, produce nonsensical results, or simply refuse to compile.
The Breakthrough Moments:
After countless sleepless nights and thousands of lines of code, breakthrough came through elegant simplifications. The realization that market anomalies follow patterns similar to quantum vacuum fluctuations led to the revolutionary anomaly detection system. The discovery that price paths exhibit holonomic memory unlocked the geometric phase calculations.
The Visual Revolution:
Creating visualizations that could represent 4-dimensional quantum fields on a 2D chart required innovative approaches. The multi-layer holonomy field, recursive quantum portals, and phase space flow representations went through dozens of iterations before achieving the perfect balance of beauty and functionality.
The Balancing Act:
Perhaps the greatest challenge was maintaining mathematical rigor while ensuring practical trading utility. Every formula had to be both theoretically sound and computationally efficient. Every visual had to be both aesthetically pleasing and information-rich.
The result is more than a strategy - it's a synthesis of pure mathematics and market reality that reveals the hidden order within apparent chaos.
📚 INTEGRATED DOCUMENTATION
Once applied to your chart, AHFT includes comprehensive tooltips on every input parameter. The source code contains detailed explanations of the mathematical theory, practical applications, and optimization guidelines. This published description provides the overview - the indicator itself is a complete educational resource.
⚠️ RISK DISCLAIMER
While AHFT employs advanced mathematical models derived from theoretical physics, markets remain inherently unpredictable. No mathematical model, regardless of sophistication, can guarantee future results. This strategy uses realistic commission ($0.62 per contract) and slippage (1 tick) in all calculations. Past performance does not guarantee future results. Always use appropriate risk management and never risk more than you can afford to lose.
🌟 CONCLUSION
The Anomalous Holonomy Field Theory represents a quantum leap in technical analysis - literally. By applying the profound insights of differential geometry, quantum field theory, and gauge theory to market analysis, AHFT reveals structure and opportunities invisible to traditional methods.
From the holonomy calculations that capture market memory to the anomaly detection that identifies phase transitions, from the adaptive intelligence that learns and evolves to the stunning visualizations that make the invisible visible, every component works in mathematical harmony.
This is more than a trading strategy. It's a new lens through which to view market reality.
Trade with the precision of physics. Trade with the power of mathematics. Trade with AHFT.
I hope this serves as a good replacement for Quantum Edge Pro - Adaptive AI until I'm able to fix it.
— Dskyz, Trade with insight. Trade with anticipation.
Pionex Signal Bot (Single/Multi Position)Guide: Integrating Your TradingView Strategy with a Signal Bot
This guide provides step-by-step instructions for connecting a TradingView strategy script with a compatible signal bot platform for automated execution, such as Pionex.
This script is based on DCA strategy execution, with the capability of customizable signal indicators by modifying the script section for modularity with minimal adjustments to adapt other source code. The default indicator is the moving average.
You will need an account on a compatible bot execution platform to execute the trades.
You will need a TradingView account with at least an Essential subscription for Alert and Webhook URL access.
A desktop browser is required to access the TradingView Pinescript Editor and the Signal bot configuration page on the execution platform.
1. Configuring the “Signal” on the Bot Execution Platform
Log in to your bot execution platform account (e.g., Pionex).
Navigate to the Futures → Futures Bot → Signal Bot section.
Click on the “Add signal” button and set the name and description for this signal, then click “Confirm.”
Once the signal has been created, directly click on the “I have completed the configuration” and “I have created the alert” buttons on the bot platform.
Signal setup on the bot execution platform has been completed.
2. Add a Strategy Script to the TradingView Chart
Log in to your TradingView account.
Choose the desired trading pair on your integrated exchange, and click the “ Launch chart “ button.
Click “Indicators”, select the Signal bot script you want to use.
Click the “Gear” icon to open the strategy settings, on the “Input” tab, copy the “Message” provided by your bot execution platform into the “Pionex Message” (or equivalent) textbox within the script's inputs.
On the “Properties” settings, refer to the recommended settings as follows:
• Initial capital: Keep this value at "100".
• Base currency: Keep this value at “Default”.
• Order size: 1 ~ 100 USDT. Keep the value within 1 to 100 USDT. 50 USDT may be translated as 50% fund utilization on the execution platform, such as Pionex .
• Pyramiding: 1 ~ any value. This value is for multi-position entry settings.
• Margin for long positions: Keep this value at "0".
• Margin for short positions: Keep this value at "0".
• Other parameters can be ignored as they do not impact the core configuration.
Strategy configuration in the TradingView chart has been completed.
3. Configuring the Strategy Alert on TradingView for Bot Connection
Log in to your TradingView account.
Click on the “Alarm” icon in the upper right corner, and click the “+” icon to create a new alert.
In the “Settings” tab, choose the desired strategy from the list.
Note: The latest configuration will typically be at the bottom of the list and may need to be updated every time there are changes to the strategy “Input” configuration.
In the “Message” tab, keep the value unchanged as the default content.
Note: This variable will produce the necessary JSON code for the trading instruction.
In the “Notification” tab, enable the “Webhook URL” and paste the Webhook URL obtained from your bot execution platform into the “Webhook URL” field in TradingView.
Click the “Create” button to complete the setup, and the alert will appear in the “Alert” list.
Strategy Alert configuration in the TradingView chart has been completed.
4. Creating the Signal Bot on the Execution Platform with the Linked Strategy
Log in to your bot execution platform account (e.g., Pionex).
Navigate to Futures → Futures Bot → Signal Bot.
On the “Signal Bot” page, click the “Automate signal” button to configure the bot settings, and then click the “Create the bot.”
The Signal bot creation on the execution platform has been completed.
5. Checking Signal Transmission Between TradingView and Bot Platform
Log in to your TradingView account.
Click on the “Alarm” icon in the upper right corner, and click the “Log” tab to check the alert history.
Log in to your bot execution platform account (e.g., Pionex).
Click on “Details” for your bot and then navigate to the “Signal Log” tab.
Compare the TradingView Alert log with the bot execution platform's Signal Log to ensure the signals are received properly.
To understand the raw Message content, manual interpretation or platform-specific tools may be required.
6. How to Add Other Indicator into the Strategy Script for the Signal Bot
Log in to your TradingView account.
Obtain the open-source indicator, such as “RSI”, into the TradingView chart, and copy its Pine Script™ source code.
Open the Signal bot strategy script in the Pine Script™ Editor. This script is typically optimized for integration with the bot execution platform.
Paste the custom indicator source code into the specific designated section for custom indicators within the Signal bot strategy script.
Define the conditions for “Long” (buy) and “Short” (sell) entries from your custom indicator into the pre-defined “longCondition” and “shortCondition” variables within the script.
Click the “Add to chart” or “Update on chart” button to complete the script configuration and apply changes to your chart.
Integrating a custom indicator into the strategy script has been completed.

Adaptive Momentum Scalper (AMS) - Prop Firm Safe**This has only been used in TV strategy testing and has not been used by me on a live account yet.**
This is a strategy is a quick momentum trading with a close stop loss. This scalping strategy looks for big candles and momentum and enters a quick trade. SL and TP are ATR based and the duration of open time is limited to the number of candles entered in the settings.
Please take a look and let me know your thoughts. If anyone can collect some solid data on forward testing please let me know.

NQHARP with Scalingthis is something ive developed over years of backtesting based on ATR vales and FIB measurements measured is as well. enjoy

EMA Trend (Long Only) - ATR Stop, No TrailingThis strategy is designed to capture medium- and long-term uptrends in Bitcoin on the 1-day timeframe. It uses a combination of moving average crossovers, momentum confirmation, and trend strength filters to identify high-quality long entries, while controlling risk with a dynamic stop-loss.
⚙️ How It Works:
Long Entry Conditions:
✅ 20 EMA crosses above 50 EMA — trend trigger
✅ +DI > -DI — directional strength
✅ RSI > 40 — confirms bullish momentum
✅ ADX > 5 — filters low-trend environments
✅ EMA separation > 0.0% — prevents flat crossovers
Exit Conditions:
❌ Manual exit when 20 EMA crosses below 50 EMA
❌ Stop-loss triggered at 4× ATR below entry price
📈 Key Features:
Focuses on high-quality trend entries
Designed for swing traders or position traders
Works best on Bitcoin 1D chart, but adaptable to other assets
🔧 Customizable Inputs:
EMA lengths
RSI threshold
ADX minimum value
ATR stop-loss multiplier
Minimum EMA separation filter
⚠️ Notes:
Long-only (no short trades)
Works best in trending markets
Filters can be adjusted to increase or reduce trade frequency

Short Env EntryStrategy To Enter the MegaCap Stocks when Price is below the SMA 200 by a certain percentage and Exit after the Price Rises to SMA200.
I am further Refining the Strategy and would try to build additional features for Back-Testing.

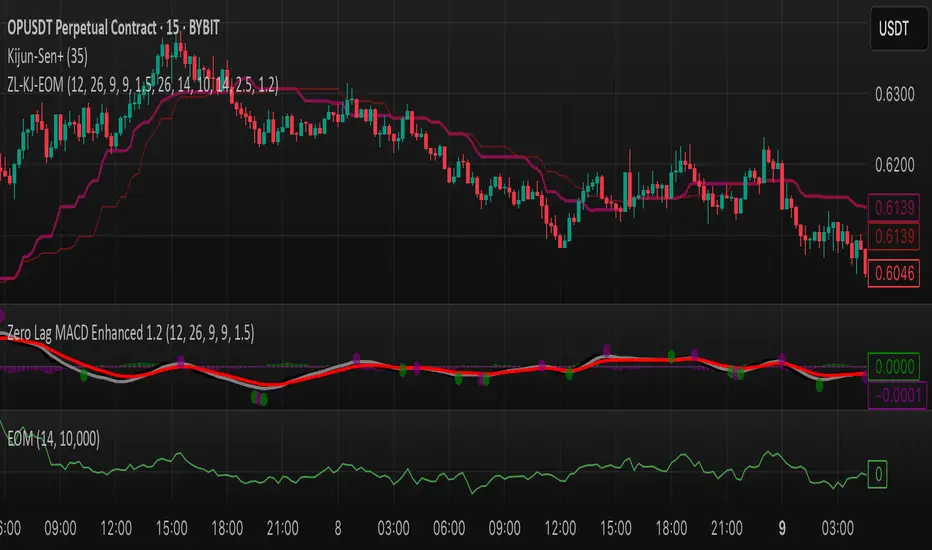
Zero Lag MACD + Kijun-sen + EOM StrategyThis strategy offers a robust approach to identifying high-probability trading opportunities in the fast-paced cryptocurrency markets, particularly on lower timeframes (e.g., 5-minute). It leverages the synergistic power of three distinct indicators to confirm entries, ensuring a disciplined approach to risk management.
Key Components:
Zero Lag MACD Enhanced Version 1.2: This core momentum indicator is used to identify precise shifts in trend and momentum, offering reduced lag compared to traditional MACD. Entry signals are filtered based on the histogram's position (below for buys, above for sells) to enhance signal reliability.
Kijun-sen (Ichimoku Cloud): Acting as a dynamic support/resistance and trend filter, the Kijun-sen line confirms the prevailing market direction. Long entries are confirmed when price is above Kijun-sen, and short entries when price is below.
Ease of Movement (EoM): This volume-based oscillator provides crucial confirmation of price movements by measuring the ease with which price changes. Positive EoM confirms buying pressure, while negative confirms selling pressure, adding an essential layer of validation to trade setups.
How it Works:
The strategy generates entry signals only when all three indicators align simultaneously:
For Long Entries: A Zero Lag MACD buy signal (crossover below histogram) must coincide with price trading above the Kijun-sen, and the Ease of Movement indicator being above its zero line.
For Short Entries: A Zero Lag MACD sell signal (crossover above histogram) must coincide with price trading below the Kijun-sen, and the Ease of Movement indicator being below its zero line.
Entries are executed at the open of the candle immediately following the signal confirmation.
Risk Management:
Disciplined risk management is paramount to this strategy:
Dynamic Stop-Loss: An Average True Range (ATR) based stop-loss is implemented, set at 2.5 times the current ATR. This adapts the stop-loss distance to market volatility, ensuring sensible risk sizing.
Fixed Take-Profit: A consistent Risk-to-Reward (R:R) ratio of 1:1.2 is applied for all trades, promoting stable profit realization.
Customization & Optimization:
The strategy is built with fully customizable input parameters for each indicator (MACD lengths, Kijun-sen period, ATR period, ATR multiplier, and Risk-to-Reward ratio). This allows users to fine-tune the strategy for different assets, timeframes, and market conditions, facilitating robust backtesting and optimization.
Disclaimer: Trading involves substantial risk and is not suitable for all investors. Past performance is not indicative of future results. This strategy is provided for educational and informational purposes only. Always use proper risk management and conduct your own due diligence.
GStrategy 1000Pepe 15mTrend Following Candlestick Strategy with EMA Filter and Exit Delay
Strategy Concept
This strategy combines candlestick patterns with EMA trend filtering to identify high-probability trade entries, featuring:
Entry Signals: Hammer and Engulfing patterns confirmed by EMA trend
Trend Filter: Fast EMA (20) vs Slow EMA (50) crossover system
Risk Management: 5% stop-loss + 1% trailing stop
Smart Exit: 2-bar delay after exit signals to avoid whipsaws
Key Components
Trend Identification:
Uptrend: Fast EMA > Slow EMA AND rising
Downtrend: Fast EMA < Slow EMA AND falling
Entry Conditions:
pinescript
// Bullish Entry (Long)
longCondition = (Hammer OR Bullish Engulfing)
AND Uptrend
AND no existing position
// Bearish Entry (Short)
shortCondition = Bearish Engulfing
AND Downtrend
AND no existing position
Exit Mechanics:
Primary Exit: EMA crossover (Fast crosses Slow)
Delayed Execution: Waits 2 full candles after signal
Emergency Exits:
5% fixed stop-loss
1% trailing stop
Visual Dashboard:
Colored EMA lines (Blue=Fast, Red=Slow)
Annotated candlestick patterns
Background highlighting for signals
Distinct markers for entries/exits
Unique Features
Pattern Recognition:
Enhanced Hammer detection (strict body/wick ratios)
Multi-candle engulfing confirmation
Trend-Confirmation:
Requires price and EMA alignment
Filters counter-trend patterns
Exit Optimization:
pinescript
// Delay implementation
if exit_signal_triggered
counter := 2 // Start countdown
else if counter > 0
counter -= 1 // Decrement each bar
exit_trade = (counter == 1) // Execute on final bar
Risk Parameters
Parameter Value Description
Stop Loss 5% Fixed risk per trade
Trailing Stop 1% Locks in profits
Exit Delay 2 bars Reduces false exits
Position Size 100% No pyramiding
Visualization Examples
🟢 Green Triangle: Bullish entry
🔴 Red Triangle: Bearish entry
⬇️ Blue X: Long exit (after delay)
⬆️ Green X: Short exit (after delay)
🎯 Pattern Labels: Identifies hammer/engulfing
Recommended Use
Timeframes: 1H-4H (reduces noise)
Markets: Trend-prone assets (FX, indices)
Best Conditions: Strong trending markets
Avoid: Choppy/Ranging markets
