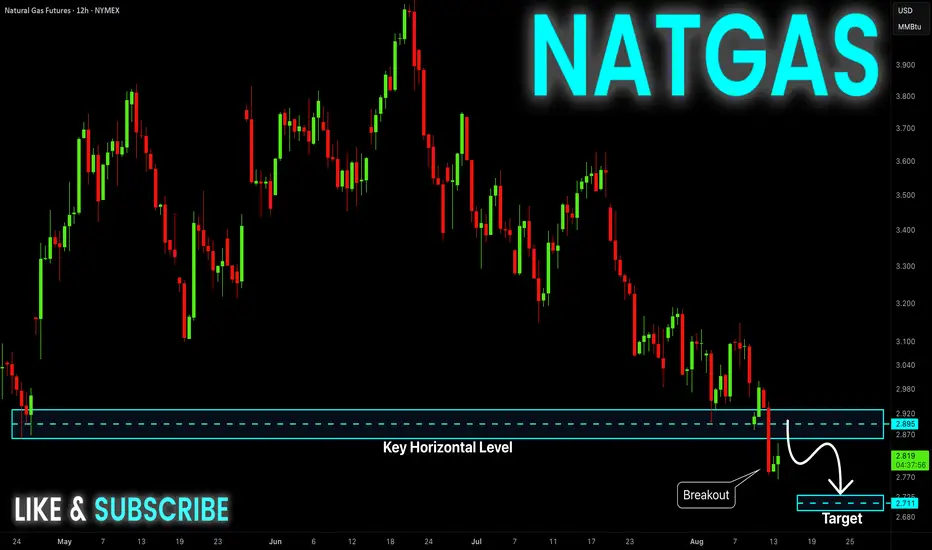
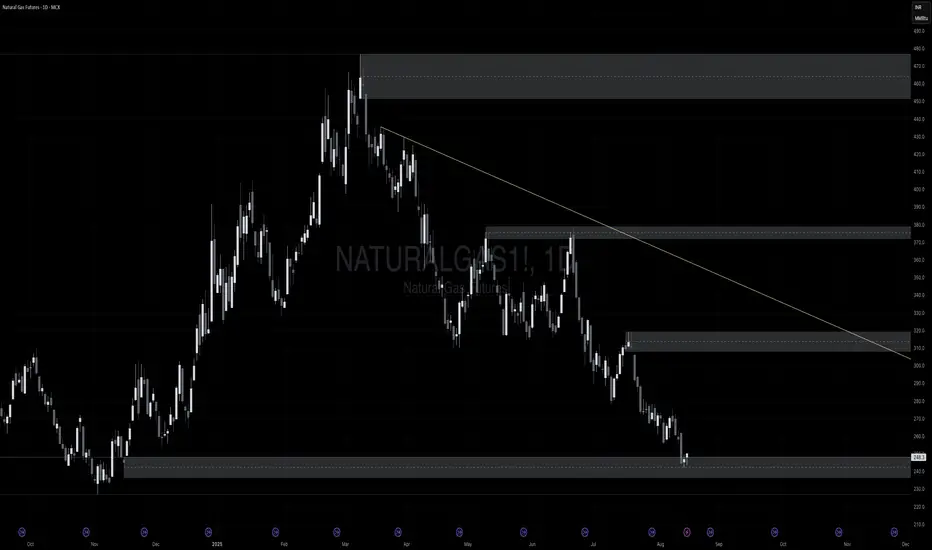
NATGAS Swing Short! Sell!
Hello,Traders!
NATGAS made a bearish
Breakout of the key horizontal
Level of 2.895$ while trading
In a downtrend so we are
Bearish biased and we will
Be expecting a further
Bearish continuation
Sell!
Comment and subscribe to help us grow!
Check out other forecasts below too!
Disclosure:
Related commodities
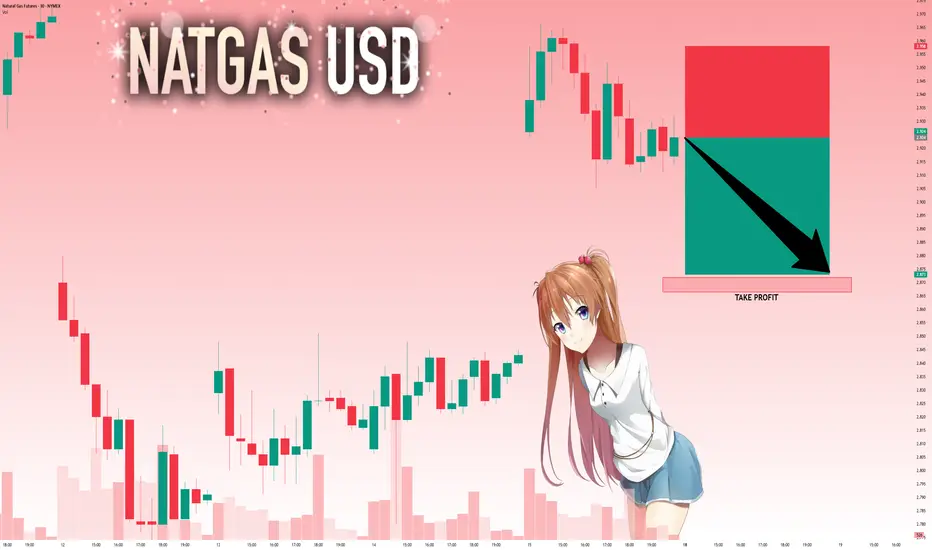
NATGAS BEARISH BREAKOUT|SHORT|
✅NATGAS is going down currently
As the price broke the key structure level of 2.90$
Which is now a resistance, and after the pullback
And retest, I think the price will go further down
SHORT🔥
✅Like and subscribe to never miss a new idea!✅

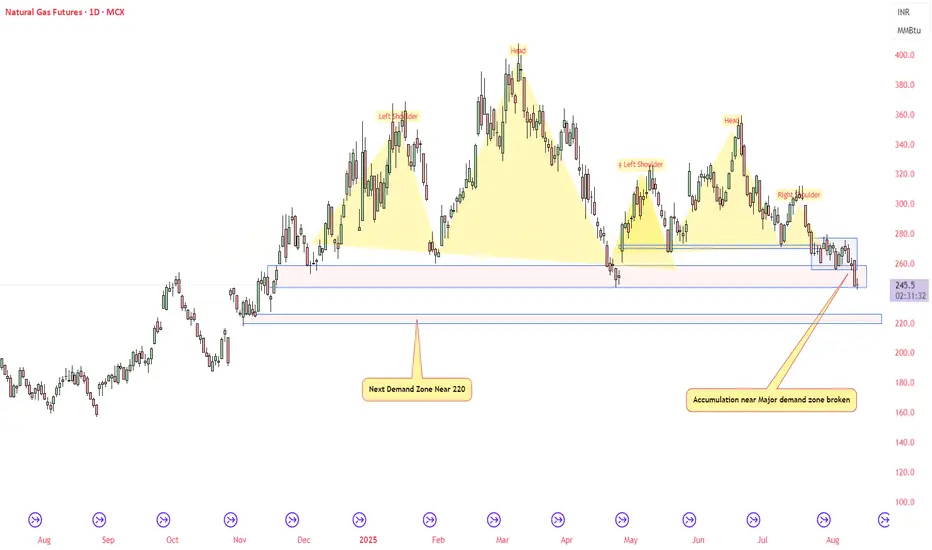
NATURAL GAS - Head and Shoulder PatternNatural Gas being in slow demand may see more bearishness near 220, fresh accumulation near major demand zone broken.
Do your own study before taking any trades
NATGAS The Target Is UP! BUY!
My dear friends,
Please, find my technical outlook for NATGAS below:
The price is coiling around a solid key level - 2.996
Bias - Bullish
Technical Indicators: Pivot Points Low anticipates a potential price reversal.
Super trend shows a clear buy, giving a perfect indicators' convergence.
Goal
Gold | Oil | Dollar | Silver | Natural Gas Price ForecastGold | Oil | Dollar | Silver | Natural Gas Price Forecast
NYMEX:NG1! NYMEX:CL1! COMEX:GC1! COMEX:SI1!

NATGAS Trading Opportunity! SELL!
My dear subscribers,
My technical analysis for NATGASis below:
The price is coiling around a solid key level - 2.923
Bias - Bearish
Technical Indicators: Pivot Points Low anticipates a potential price reversal.
Super trend shows a clear sell, giving a perfect indicators' convergence.
Goal - 2.8
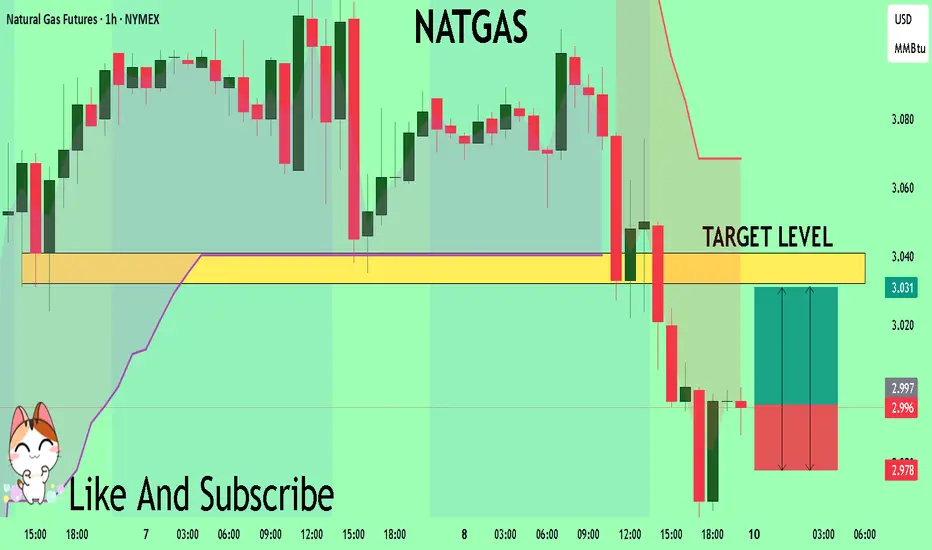
NG1! BUYERS WILL DOMINATE THE MARKET|LONG
NG1! SIGNAL
Trade Direction: long
Entry Level: 2.996
Target Level: 3.043
Stop Loss: 2.964
RISK PROFILE
Risk level: medium
Suggested risk: 1%
Timeframe: 1h
Disclosure: I am part of Trade Nation's Influencer program and receive a monthly fee for using their TradingView charts in my analysis.
✅LI

NG1!: Target Is Down! Short!
My dear friends,
Today we will analyse NG1! together☺️
The in-trend continuation seems likely as the current long-term trend appears to be strong, and price is holding below a key level of 2.924 So a bearish continuation seems plausible, targeting the next low. We should enter on confirmation
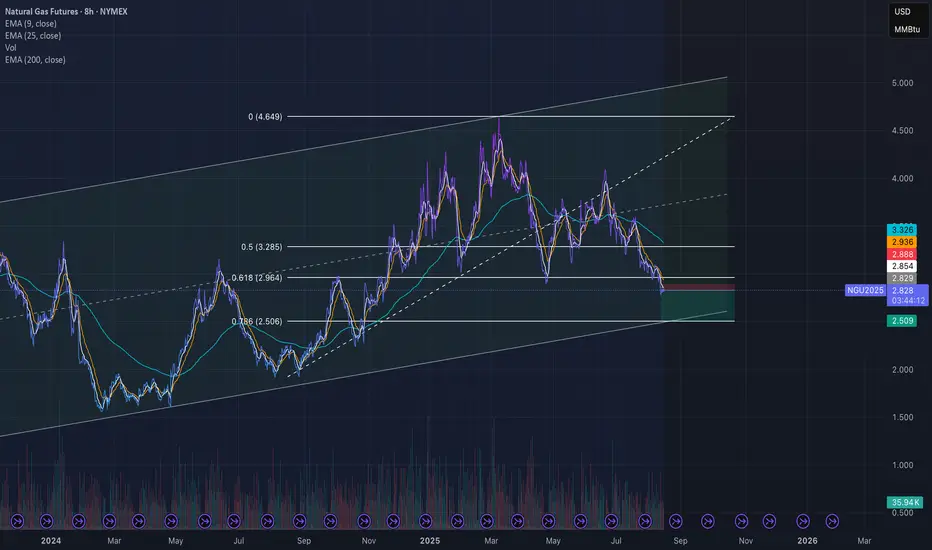
NG NG looks promising for the ride to 0.786 and then to turn back with much more promising long setup.
See all ideas
Summarizing what the indicators are suggesting.
Neutral
SellBuy
Strong sellStrong buy
Strong sellSellNeutralBuyStrong buy
Neutral
SellBuy
Strong sellStrong buy
Strong sellSellNeutralBuyStrong buy
Neutral
SellBuy
Strong sellStrong buy
Strong sellSellNeutralBuyStrong buy
A representation of what an asset is worth today and what the market thinks it will be worth in the future.
Displays a symbol's price movements over previous years to identify recurring trends.
Frequently Asked Questions
The current price of UK NBP Natural Gas Futures is 75.90 GBX — it hasn't changed in the past 24 hours. Watch UK NBP Natural Gas Futures price in more detail on the chart.
The volume of UK NBP Natural Gas Futures is 420.00. Track more important stats on the UK NBP Natural Gas Futures chart.
The nearest expiration date for UK NBP Natural Gas Futures is Apr 29, 2026.
Traders prefer to sell futures contracts when they've already made money on the investment, but still have plenty of time left before the expiration date. Thus, many consider it a good option to sell UK NBP Natural Gas Futures before Apr 29, 2026.
Open interest is the number of contracts held by traders in active positions — they're not closed or expired. For UK NBP Natural Gas Futures this number is 8.78 K. You can use it to track a prevailing market trend and adjust your own strategy: declining open interest for UK NBP Natural Gas Futures shows that traders are closing their positions, which means a weakening trend.
Buying or selling futures contracts depends on many factors: season, underlying commodity, your own trading strategy. So mostly it's up to you, but if you look for some certain calculations to take into account, you can study technical analysis for UK NBP Natural Gas Futures. Today its technical rating is strong sell, but remember that market conditions change all the time, so it's always crucial to do your own research. See more of UK NBP Natural Gas Futures technicals for a more comprehensive analysis.