RISKOMETER Based on Your Trading Style ⚠️
Hey traders,
In this educational post, we will discuss the relation of risk to your trading style.
1️⃣ High Frequency Trading (HFT)
It is a complex algorithmic approach that is used to operate on second(s) time frames.
Such a style is considered to be the riskiest one.
With a very high frequency of order execution and sophisticated strategies, it requires a very high level of experience and proper software and hardware for successful operations.
2️⃣ Scalping
It is a manual trading style with operations on minutes time frames.
With the average holding period ranging from minutes to hours, scalping requires a high degree of attention and constant charts monitoring.
Being one of the most profitable trading styles for retail traders, scalping involves an extremely high risk and mental load.
3️⃣ Day trading
The form of speculation in which the traders attempt to make profits within a single trading day.
Occasionally, however, day traders may hold their positions overnight.
Day trading is considered to be slower than scalping, with the trade execution on hourly time frames.
Slower pace drastically reduces risks also limiting the potential gains.
4️⃣ Swing trading
It is a style of trading that is aimed to make profits on swing moves, with an average holding period ranging from days to weeks.
4H time frame is the lowest time frame where swing traders usually operate, and a daily time frame is usually the highest one.
The operations on higher time frame dramatically reduces the noise and degree of manipulations, making that style of trading relatively safe.
5️⃣Investing (Position Trading)
Trading / investing style aiming to make long-term profits.
The average holding time of a position trader may expand to years.
In comparison to other trading styles, investing generally produces the smallest gain. That is, however, compensated by extremely low risks.
Correct understanding of relations between trading styles and potential risks is crucially important for a selection of an appropriate style for you.
Shorter is the holding period and operational time frames, higher is the risk, but higher are the potential gains.
You should pick the style that fits your risk-tolerance and expectation.
❤️Please, support my work with like, thank you!❤️
Trading Tools

6 Character Traits to Develop or Refine Your Day Trading Career
It may seem as if developing a career in forex day trading is about finding a strategy, practicing it regularly, and making bundles of money. Yes, it is about that. But, where are our characteristics on that list? To become a successful day trader, you need to develop specific features to implement an effective strategy that delivers results in all market conditions.
We may not be entirely aware, but we do use them daily, and maybe, at times, we notice that we should work more on developing these. These characteristics are innately a part of us. It is essential to work on developing these characteristics that guide you towards building a thriving day trading career.
It is good to know that not all successful day traders inherently have the ability to succeed without hard work. For most, it takes weeks, months, and years. By continuing to read, you will realize why you should develop the skills sooner rather than later.
1. Discipline
Discipline requires boundaries and mental acceptance. It’s one of the many characteristics used to achieve in day trading. Even though some beg to differ – they say that a well-developed trading plan was their way to success. But how disciplined are they to follow it?
Being disciplined is vital when deciding which products to trade. Thousands of products are traded throughout the day, and It is very overwhelming with infinite opportunities thrown to you at once. Devise a schedule that revolves around the best times for you to trade. Select a product to trade and stick to both the product and your plan.
2. Patience
If you haven’t started trading yet, you will soon realize that it is a “waiting game” with loads of patience needed – but with fantastic profit too. It can be challenging for beginner traders who don’t have enough patience and find it challenging to wait or watch the markets. If you enter the market at a time when nothing is happening, you may blame your luck and try to jump in or out of the tradestoo early. You may land up building resentment, and it will not suffice.
3. Adaptability
Change is a characteristic that is either always welcomed or never welcomed at all. When becoming a trader, you will accept that day trading as a career is ever-changing. To be a successful trader, you will have to work through some discomfort to adapt to fluctuations quickly. It is extremely rare to have two trading days that are the same or similar to one another, which means you must adjust to different scenarios in the market.
4. Mental Strength
Day trading is about gaining the mental strength that can withstand the losses that the market throws at you. Some days there can be no losses thrown at you, yet on other days, this is all you will see, and it can be soul-destroying. More positively, there will be times when you are on a losing streak, and it’s at this stage when the pro traders are looking for opportunities to bounce back. Do not be disheartened if you are disappointed after losing a trade or if your strategy isn’t delivering the results you expect.
5. Let Go
Preparations for your losses don’t mean that you should continue grinding it out on the market and continue to lose your capital. If your mental strength gives you the courage to walk away from the suffering of your continuous losses – do that! Walk away!
6. Independence
At the beginning of your trading career, it is a good idea to reach out to fellow traders and mentors to help you with the building blocks. These contacts will recommend trading videos, podcasts, books, forums, and articles to build your skills and confidence. However, if you want your trading career to take off smoothly, then learn some of the critical skills by yourself. Develop a sense of independence, where you do not rely on others. Having to rely on help or opinions all the time is tiresome.
Once you have developed a trading strategy that works, you should not listen to every opinion from others. Be focused on doing what works for you.
Thanks for reading bro, you are the best☺️
Like, comment and subscribe to boost your trading!
Hey traders, let me know what subject do you want to dive in in the next post

The fastest area of wealth accumulation in the world-the forexAn investment field where one opportunity is enough to change one's destiny!
A market that works miracles every day!
Entering the new century, foreign exchange, an investment tool with infinite charm, is attracting the attention of more and more people. This market full of opportunities and challenges is changing our destiny all the time, so much so that it is loved by more and more people.
Advantages of the foreign exchange market:
1.Low threshold for investment amount;
2.The investment period can be long or short, buy and sell as you go, and the liquidity is extremely high.
3.The highest return on investment, you can get more than several times the amount of investment funds.
4.The transaction procedures are quick and easy. You only need to enter the transaction procedures, which can be completed in a very short time.
5.Trading flexibility is high, and there are many profit opportunities in the dual-track of buying long and selling short.
6.The impact environment is relatively fair, the information channels are smooth, and it will not be operated by large companies. The principles of fairness, impartiality, and openness are guaranteed. There are many factors that affect it, and the relationship between supply and demand has a great impact.
7.The degree of risk is relatively high, but foreign exchange trading operations are flexible, mobile, rapid, and risks can be controlled and prevented.
How to quickly accumulate wealth with small funds:
1. Survival first, development second.
2. Only do short-term intraday trading.
3. Operate no more than 5 times a day, and try not to place orders after the daily profit exceeds US 1,000.
4. Only 2-3 varieties are made every day.
In the trading process, at the same time, establish that opportunities are available every day, and you need to maintain the concept of waiting patiently for opportunities, and overcome the impatience of eager to win; at the same time, make rational use of stop losses, establish the concept of safety in the bag, and turn floating profits into real profits in a timely manner.After trading, find the time period when you make the most profit every day, try to give full play to your advantages in this time period, and summarize your experience every day to continuously improve your tactics.
Top 10 Technical Indicators for Successful TradingTop 10 technical indicators for successful trading
Introduction:
Technical indicators are essential tools for traders to analyze market trends, identify potential trading opportunities, and manage risk. These indicators are mathematical calculations based on past price and volume data that can help traders make informed decisions about buying or selling assets. In this article, we'll discuss the top technical indicators that traders can use to enhance their trading strategies.
Moving Average:
A moving average is a widely used technical indicator that helps traders identify market trends. A moving average is calculated by averaging the price of an asset over a specific period, such as 10 days or 50 days. This indicator smooths out the price data and makes it easier for traders to identify the direction of the trend. When the price is above the moving average, it's considered a bullish trend, and when the price is below the moving average, it's considered a bearish trend.
Relative Strength Index (RSI):
The Relative Strength Index (RSI) is a momentum oscillator that measures the strength of a price trend. The RSI is calculated by comparing the average gains and losses over a specific period, typically 14 days. The RSI value ranges from 0 to 100, with values above 70 indicating an overbought market, and values below 30 indicating an oversold market. Traders can use the RSI to identify potential trend reversals and overbought or oversold conditions in the market.
Bollinger Bands:
Bollinger Bands are another widely used technical indicator that helps traders identify potential trend reversals and price volatility. Bollinger Bands consist of three lines: a moving average in the center, and two outer bands that represent the standard deviation of the price data. When the price is within the bands, it's considered normal market volatility. However, when the price reaches the outer bands, it's considered an overbought or oversold condition, and a potential reversal may be imminent.
MACD (Moving Average Convergence Divergence):
The Moving Average Convergence Divergence (MACD) is a trend-following momentum indicator that helps traders identify changes in momentum and trend reversals. The MACD is calculated by subtracting the 26-day exponential moving average (EMA) from the 12-day EMA. A signal line, which is a 9-day EMA of the MACD, is also plotted on the chart. Traders can use the MACD to identify potential buy and sell signals, as well as divergences between the MACD and the price of the asset.
Fibonacci Retracements:
Fibonacci Retracements are a popular technical indicator that helps traders identify potential support and resistance levels. Fibonacci Retracements are based on the idea that prices tend to retrace a predictable portion of a move, after which they may continue in the original direction. Traders can use Fibonacci retracements to identify potential entry and exit points, as well as stop-loss levels.
Stochastic Oscillator:
The Stochastic Oscillator is another momentum oscillator that helps traders identify overbought and oversold conditions in the market. The Stochastic Oscillator is calculated by comparing the closing price of an asset to its price range over a specific period. The Stochastic Oscillator value ranges from 0 to 100, with values above 80 indicating an overbought market, and values below 20 indicating an oversold market. Traders can use the Stochastic Oscillator to identify potential trend reversals and overbought or oversold conditions in the market.
Average True Range (ATR):
Average True Range (ATR) is a technical indicator that measures the volatility of a stock or currency. Developed by J. Welles Wilder Jr., ATR calculates the average range of price movements over a specific period, taking into account gaps in price movements. ATR is typically calculated over a period of 14 days, but traders can adjust this period to fit their specific trading strategy.
To calculate ATR, traders first calculate the true range (TR), which is the greatest of the following:
Current high minus the current low
Absolute value of the current high minus the previous close
Absolute value of the current low minus the previous close
Once the true range is calculated, traders can calculate the ATR by taking an average of the true range over a specific period.
ATR can be used to measure volatility in the market, helping traders to identify potential trading opportunities. When ATR is high, it indicates that there is a lot of volatility in the market, which can present opportunities for traders to profit. Conversely, when ATR is low, it indicates that the market is relatively stable, and traders may want to avoid entering trades at that time.
Ichimoku Cloud:
The Ichimoku Cloud, also known as Ichimoku Kinko Hyo, is a technical indicator that provides a comprehensive view of potential support and resistance levels, trend direction, and momentum. The indicator was developed by Japanese journalist Goichi Hosoda in the late 1930s and has gained popularity among traders in recent years.
The Ichimoku Cloud consists of five lines, each providing a different view of the market:
Tenkan-Sen: This line represents the average of the highest high and the lowest low over the past nine periods.
Kijun-Sen: This line represents the average of the highest high and the lowest low over the past 26 periods.
Chikou Span: This line represents the current closing price shifted back 26 periods.
Senkou Span A: This line represents the average of the Tenkan-Sen and Kijun-Sen, shifted forward 26 periods.
Senkou Span B: This line represents the average of the highest high and the lowest low over the past 52 periods, shifted forward 26 periods.
The area between Senkou Span A and Senkou Span B is referred to as the "cloud" and is used to identify potential support and resistance levels. When the price is above the cloud, it indicates a bullish trend, and when the price is below the cloud, it indicates a bearish trend.
Traders can also use the Tenkan-Sen and Kijun-Sen lines to identify potential entry and exit points, with a bullish crossover of the Tenkan-Sen above the Kijun-Sen indicating a potential buying opportunity, and a bearish crossover of the Tenkan-Sen below the Kijun-Sen indicating a potential selling opportunity.
Conclusion:
In conclusion, technical indicators are valuable tools for traders in the financial markets. The Average True Range (ATR) can be used to measure volatility in the market, while the Ichimoku Cloud provides a comprehensive view of potential support and resistance levels, trend direction, and momentum. By using these indicators in combination with other technical analysis tools and market knowledge, traders can make informed trading decisions and improve their chances of success. It's important for traders to experiment with different indicators and find the ones that work best for their trading strategy.

The Role of ChatGPT in Algorithmic TradingThe Role of ChatGPT in Algorithmic Trading
1. Introduction
In recent years, algorithmic trading has become an increasingly important aspect of the financial markets. Algorithmic trading involves using computer programs to execute trades based on predetermined rules and algorithms, with the goal of maximizing returns and minimizing risk. The use of algorithms allows traders to make rapid, data-driven decisions and respond to market conditions faster than traditional human traders.
Natural language processing (NLP) is a field of computer science that focuses on the interactions between computers and human language. In the context of algorithmic trading, NLP techniques are used to analyze vast amounts of financial news, social media, and other sources of information to identify potential trading opportunities. By analyzing this data, traders can make informed decisions and gain a competitive edge in the market.
One of the key tools used in NLP for algorithmic trading is ChatGPT, a large language model trained by OpenAI. ChatGPT is a powerful tool that can analyze vast amounts of text data and generate human-like responses. Its capabilities include natural language understanding, machine translation, text summarization, and text completion.
With its ability to analyze and understand large amounts of text data, ChatGPT is an essential tool for traders looking to gain a competitive edge in the market. For example, ChatGPT can be used to analyze financial news articles and social media posts to identify companies that are likely to experience a significant change in their stock price. By analyzing the sentiment of these articles and posts, ChatGPT can determine whether there is a positive or negative outlook for a particular company, which can be used to inform trading decisions.
In addition to sentiment analysis, ChatGPT can also be used to generate summaries of news articles, which can save traders valuable time and allow them to quickly digest important information. ChatGPT can also be used to generate text responses to customer inquiries, freeing up traders to focus on more important tasks.
Overall, the use of NLP and ChatGPT in algorithmic trading is becoming increasingly important. As the amount of data available to traders continues to grow, the ability to quickly and accurately analyze that data will become essential for achieving success in the market. With its powerful NLP capabilities, ChatGPT is poised to play a significant role in the future of algorithmic trading.
2. NLP Techniques for Algorithmic Trading
Natural language processing (NLP) is an essential tool for algorithmic trading, enabling traders to quickly and accurately analyze large volumes of text data. In this section, we'll explore some of the key NLP techniques used in algorithmic trading, including analysis of financial news and social media, sentiment analysis, and identification of potential trading opportunities.
One of the most powerful applications of NLP in algorithmic trading is the analysis of financial news and social media. By analyzing news articles and social media posts, traders can gain insight into the market sentiment and identify emerging trends or potential trading opportunities. For example, if a large number of news articles and social media posts are discussing a particular company, it may be an indication that the company is about to experience a significant change in its stock price.
Sentiment analysis is another important NLP technique in algorithmic trading. Sentiment analysis involves using NLP algorithms to determine the emotional tone of a particular piece of text. By analyzing the sentiment of news articles, social media posts, and other sources of information, traders can gain insight into the market sentiment towards a particular company or industry. This information can then be used to inform trading decisions.
Identification of potential trading opportunities using NLP is another key application of this technology. By analyzing large volumes of data, including news articles, social media posts, and other sources of information, traders can identify emerging trends or potential trading opportunities. For example, by analyzing news articles and social media posts, traders may identify a new technology that is rapidly gaining popularity, indicating a potential investment opportunity.
Overall, the use of NLP techniques in algorithmic trading is becoming increasingly important. With the amount of data available to traders continuing to grow, the ability to quickly and accurately analyze that data will be essential for achieving success in the market. NLP techniques, including the analysis of financial news and social media, sentiment analysis, and identification of potential trading opportunities, are powerful tools that can help traders gain a competitive edge and achieve success in the market.
3. Predictive Models with ChatGPT
Predictive models are an essential tool for algorithmic trading, enabling traders to identify patterns and predict future market trends. In this section, we'll explore how ChatGPT can be used to develop predictive models and the advantages of using this technology.
At its core, predictive modeling involves using historical data to identify patterns and predict future trends. This process involves analyzing large volumes of data to identify patterns and trends that can be used to inform trading decisions. With the increasing amount of data available to traders, the ability to quickly and accurately analyze that data is becoming essential for achieving success in the market.
ChatGPT is a powerful tool that can be used to analyze large datasets and identify patterns that may be missed by other analytical tools. With its ability to understand natural language, ChatGPT can analyze vast amounts of financial news, social media, and other sources of information to identify patterns and trends. This information can then be used to develop predictive models that can be used to inform trading decisions.
One of the key advantages of using ChatGPT in developing predictive models is its ability to understand the context of the data it is analyzing. Unlike other analytical tools, which may only be able to identify patterns based on simple statistical analysis, ChatGPT can analyze text data to understand the context and nuances of the information being analyzed. This allows traders to identify patterns and trends that may not be immediately apparent using other analytical tools.
Another advantage of using ChatGPT in developing predictive models is its ability to learn from new data. As more data becomes available, ChatGPT can be trained to recognize new patterns and trends, improving the accuracy of its predictions over time.
4. Machine Learning with ChatGPT
Machine learning is a critical component of algorithmic trading, allowing traders to develop sophisticated models that can identify patterns and make real-time trading decisions. In this section, we'll explore how ChatGPT can be used in machine learning models for algorithmic trading, the advantages of using this technology, and some examples of its use.
Machine learning involves using algorithms to analyze large amounts of data, identify patterns, and make predictions. This process involves training the algorithm on historical data to recognize patterns that can be used to inform trading decisions. With the increasing amount of data available to traders, the ability to quickly and accurately analyze that data is becoming essential for achieving success in the market.
ChatGPT can be used in machine learning models to analyze text data and make real-time trading decisions based on that data. For example, ChatGPT can be used to analyze financial news and social media to identify patterns that may not be immediately apparent to other analytical tools. This information can then be used to inform machine learning models that make real-time trading decisions.
One of the key advantages of using ChatGPT in machine learning models for algorithmic trading is its ability to understand natural language. Unlike other analytical tools, which may only be able to analyze structured data, ChatGPT can analyze unstructured data such as news articles and social media posts. This ability to understand the context of the data being analyzed is essential for developing accurate machine learning models.
Another advantage of using ChatGPT in machine learning models is its ability to learn from new data in real-time. As more data becomes available, ChatGPT can be trained to recognize new patterns and trends, improving the accuracy of its predictions over time. This ability to adapt to changing market conditions is essential for achieving success in the algorithmic trading market.
There are several examples of machine learning models that use ChatGPT in algorithmic trading. For example, ChatGPT can be used to analyze financial news to identify patterns and inform machine learning models that make real-time trading decisions. ChatGPT can also be used to analyze social media sentiment to inform trading decisions based on public perception of a particular stock or market.
5. Limitations and Future Directions
While ChatGPT and NLP techniques have a lot of potential in algorithmic trading, there are also limitations to their use. In this section, we'll discuss some of the challenges associated with using ChatGPT and NLP in algorithmic trading, as well as potential future directions for these technologies.
One of the main limitations of using ChatGPT and NLP in algorithmic trading is the potential for bias in the data being analyzed. NLP techniques rely on training data to identify patterns and make predictions, but if that data is biased in some way, it can lead to inaccurate predictions. For example, if a machine learning model is trained on historical data that reflects biased trading practices, it may perpetuate those biases in future trading decisions.
Another limitation of using ChatGPT and NLP in algorithmic trading is the potential for the model to be fooled by fake or misleading information. As we've seen in recent years, social media platforms can be manipulated by bad actors to spread false information or manipulate public sentiment. If ChatGPT is trained on this misleading information, it can lead to inaccurate predictions and trading decisions.
Despite these limitations, there are several potential future directions for ChatGPT and NLP in algorithmic trading. One of these is the development of more sophisticated machine learning models that can better handle unstructured data. While ChatGPT has shown promise in this area, there is still much work to be done to improve the accuracy of these models.
Another potential future direction for ChatGPT and NLP in algorithmic trading is the use of natural language generation (NLG) to create more sophisticated trading strategies. NLG involves using machine learning to generate human-like language that can be used to describe trading strategies and other complex financial concepts. This can help traders better understand the decisions being made by their machine learning models and make more informed decisions.
In conclusion, while ChatGPT and NLP techniques have a lot of potential in algorithmic trading, there are also limitations to their use. By addressing these limitations and exploring new directions for these technologies, we can continue to improve the accuracy and effectiveness of algorithmic trading models. As the amount of data available to traders continues to grow, the importance of these technologies in the trading industry will only continue to increase.
6. Conclusion
In conclusion, ChatGPT and natural language processing techniques have become increasingly important in algorithmic trading. By analyzing large amounts of unstructured data from sources such as financial news and social media, ChatGPT can help identify potential trading opportunities and provide valuable insights to traders.
One of the key advantages of using ChatGPT in algorithmic trading is its ability to analyze and understand human language. By analyzing sentiment and other linguistic patterns, ChatGPT can provide valuable insights into public opinion and market trends, which can be used to inform trading decisions.
Another advantage of ChatGPT in algorithmic trading is its ability to analyze large datasets and identify patterns that may not be immediately apparent to human traders. By using machine learning models to analyze historical data, ChatGPT can identify trends and make predictions that can help traders make more informed decisions.
Looking to the future, it's likely that ChatGPT and other NLP techniques will continue to play a significant role in algorithmic trading. As the amount of data available to traders continues to grow, the importance of these technologies in the trading industry will only continue to increase.
However, there are also potential challenges and limitations associated with using ChatGPT and NLP in algorithmic trading. It's important to be aware of these limitations and to work to address them in order to ensure that these technologies are used in a responsible and effective way.
Overall, the use of ChatGPT in algorithmic trading represents an exciting development in the field of finance. By using machine learning and natural language processing techniques to analyze large amounts of data, traders can gain new insights and make more informed decisions. With continued research and development, the potential applications of ChatGPT and other NLP techniques in algorithmic trading are sure to grow and evolve in the years to come.

howto set stoploss correctly and do a goodjob of risk managementStop loss is a necessary means to control risk, and using a good stop loss point is the only way for investors to win.
There are two types of methods for setting the stop loss point: the first type is a regular stop loss, that is, when the reasons and conditions for buying or holding disappear due to changes in market conditions, the position must be closed or stopped immediately. The second category is auxiliary stop loss. In practice, the maximum loss method, retracement stop loss, sideways stop loss, expected R multiplier stop loss, key psychological price stop loss, tangent support level stop loss, moving average stop loss, cost moving average stop loss, Bollinger band stop loss, volatility stop loss, K-line combination stop loss, chip intensive area stop loss, CDP (contrarian operation) stop loss, etc.Investors should judge based on their own risk tolerance and choose a stop loss method that suits them.
The market has been fluctuating all the time, and there are opportunities at all times, but before we make a transaction, when we look at a certain position, we also need to refer to whether the stop loss position is well set, how much profit margin can be grasped, and whether it has played a role in using small capital to fight for high returns.
The size of the stop loss: It can be set according to the resistance support in the seeking stop loss point above. The size of the stop loss we are talking about here should be set more based on the profit margin. This is the high return of small capital. When our profit margin can only be seen at 5-8 points, the stop loss can be controlled at about 3 points; The stop loss point for medium- and long-term trading can be appropriately enlarged, and when the profit point is above 30 points, the stop loss can be set to more than 8-10 points.Of course, the size of the stop loss is more of a reference factor in resistance and support.
Spread in stop loss: We all know that the cost of trading is composed of spread and commission. When we place an order, we try to find the best entry point and calculate the spread. Then the same is true when setting the stop loss. The above talked about finding the stop loss point and the size of the stop loss, then in the gold investment market, it is often a decimal point that can change the profit or loss, so we need to calculate the spread when setting the stop loss.
Several principles for setting a stop loss point:
1. Once the stop loss point is set, it is not recommended to change frequently if it is not necessary. It should be implemented decisively. Stop loss is actually a prerequisite and guarantee for profit.
2. The stop loss point should be set before each lot is traded.
3. The stop loss point can be flexibly changed, but it must not be changed day and night.
4. Before setting the stop loss point, it must be based on the current overall trend
In order to facilitate everyone to continue to follow up on my analysis and sharing, you can like and follow me; in addition, I will share the daily real-time strategy in the channel. If you can't follow up in real time, you may make operational errors.You can use the following methods to enter my channel for free to follow the latest news and follow up on market trends in real time.
judgment of technical indicators and application skills1. Simple judgment of support and resistance:
Support and resistance levels are the points in the chart that are subjected to continuous upward or downward pressure.The support level is usually the lowest point in all chart patterns (hourly, weekly, or annual), while the resistance level is the highest point (peak)in the chart.When these points show a downward trend, they are recognized as support and resistance.The best time to buy/sell is near the support/resistance level that is not easy to break.Once these levels are broken, they tend to become reverse obstacles.Therefore, in an uptrend market, the broken resistance level may become support for the upward trend; however, in a downtrend market, once the support level is broken, it will turn into resistance.
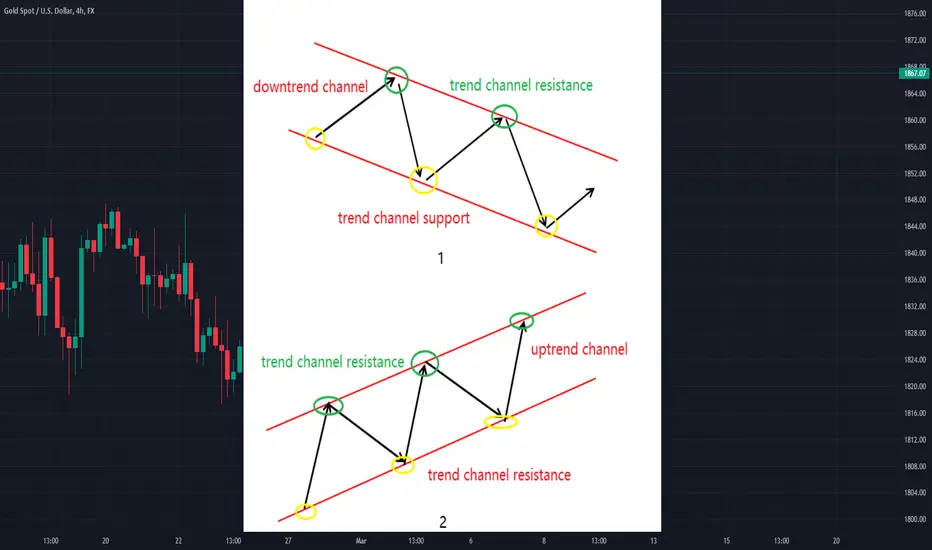
2. Understanding of lines and channels:
Trend lines are a simple and practical tool in identifying the direction of market trends.The upward straight line is formed by at least two consecutive low points connected.Naturally, the second point must be higher than the first point.The extension of a straight line helps determine the path along which the market will move.Upward trend is a specific method used to identify support lines/levels.On the contrary, the downward line is drawn by connecting two or more points.The variability of trading lines is to some extent related to the number of connection points.However, it is worth mentioning that each point does not have to be too close.A channel is defined as an upward trend line parallel to the corresponding downward trend line.Two lines can represent price upward, downward, or horizontal corridors.The common attribute of a channel that supports the connection point of a trend line should be between the two connection points of its reverse line.
3. Understanding and understanding of the average line:
If you believe in the creed of "trend is your friend" in technical analysis, then the moving average will benefit you a lot.The moving average shows the average price at a specific time in a specific period.They are called "moves" because they are measured at the same time and reflect the latest average.
One of the shortcomings of moving averages is that they lag behind the market, so they are not necessarily a sign of a trend shift.To solve this problem, using a shorter period moving average of 5 or 10 days will better reflect recent price movements than a 40 or 200-day moving average.Alternatively, the moving average can also be used by combining two average lines of different time spans.Regardless of the use of 5 and 10-day moving averages, or 40- and 200-day moving averages, buy signals are usually detected when the shorter-term average crosses the longer-term average upward.In contrast, a sell signal will be prompted when the shorter-term average crosses the longer-term average downwards.
In order to facilitate everyone to continue to follow up on my analysis and sharing, you can like and follow me; in addition, I will share the daily real-time strategy in the channel. If you can't follow up in real time, you may make operational errors.You can use the following methods to enter my channel for free to follow the latest news and follow up on market trends in real time.
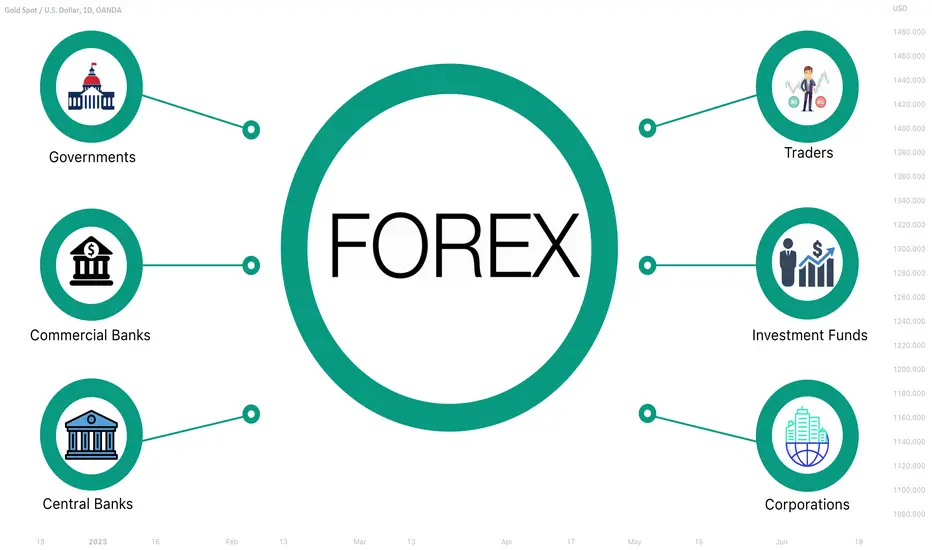
Who Moves the Forex Market | Forex Market Players
Forex is the largest market in the world, with the tremendous daily trading volumes and millions of market participants.
In this educational article, we will discuss who moves that market and who are its 6 the most significant players.
1. Governments
Governments tend to set economic goals and influence the markets with their political decision. They define the course of their nations, issuing policies and imposing regulations.
2. Central banks
Central banks implement the decisions of the governments, applying multiple instruments:
Central banks control the emission of the money, shifting the supply and demand.
They control interest rates and define the credit policies.
Central banks control the international trade and sustain the exchange rates of the national currencies by interventions and handling the foreign currencies and gold reserves.
3. Commercial banks
Commercial banks handle the international transactions.
Over 70% of total Forex Market transactions directly refers to the actives of commercial banks.
Commercial banks are also involved in speculation activities, benefiting from market fluctuations by relying on various strategies.
4. Corporations
Corporation is the business that operates in multiple countries.
With the constant capital flow between its branches and counterparts, corporations are permanently involved in a currency exchange.
Also, corporations usually hedge currency risks, storing their liquidity in particular currencies.
5. Investment funds
By investment funds, we imply the international or domestic professional money management companies. Dealing with hundreds of millions of investments, they quite often are operating on Forex market, buying foreign assets, speculating and hedging.
6. Retail traders
The main goal of retails traders and speculators is to make short terms profits from their transactions on the market.
Typically, the activities of traders constitute a relatively small portion of total trading volumes.
Knowing which forces move the forex market, you can better understand how it works. The spot prices that you see on the charts reflect the sentiment of all the above-mentioned participants.
❤️Please, support my work with like, thank you!❤️
How Leverage Really Works | Margin Trading Explained
Leveraged trading allows even small retail traders to make money trading different financial markets.
With a borrowed capital from your broker, you can empower your trading positions.
The broker gives you a multiplier x10, x50, x100 (or other) referring to the number of times your trading positions are enhanced.
Brokers offer leverage at a cost based on the amount of borrowed funds you’re using and they charge you per each day that you maintain a leveraged position open.
For example, let's take EURUSD pair.
Let's buy Euro against the Dollar with the hope that the exchange rate will rise.
Buying that on spot with 1.195 ask price and selling that on 1.23 price we can make a profit by selling the same amount of EURUSD back to the broker.
With x50 leverage, our return will be 50 times scaled.
With the leverage, we can benefit even on small price fluctuations not having a huge margin.
❗️Remember that leverage will also multiply the potential downside risk in case if the trade does not play out.
In case of a bearish continuation on EURUSD , the leveraged loss will be paid from our margin to the broker.
For that reason, it is so important to set a stop loss and calculate the risks before the trading position is opened.
Let me know, traders, what do you want to learn in the next educational post?

5 Tips For Managing Losing Trades (It Happens To Everyone)Losing trades happen. They are apart of the journey. There is simply no such thing as a trader or investor who wins all the time. All the famous investors or traders you know have LOST many times in their career. It is perfectly normal. Did you know the famed hedge fund manager Ray Dalio lost everything in his 30s? He went broke. He had to start over from scratch.
This post will address what losing trades really mean and how to deal with it.
Before we begin, let us state the obvious:
- Be careful of people who claim they don't lose.
- Avoid people who flaunt win rates or success rates that are simply not possible.
- Losing trades happen to everyone! You are not alone.
Now, let's talk about what bad trades mean and 5 tips for managing them:
Number 1: A losing trade is different from a bad trade
The most experienced traders are well aware of their risk before they ever place a trade. Each losing trade is a small component of a bigger process that relates to a system, plan or strategy that has been thoroughly tested and studied. A losing trade is a calculated event for experienced traders. They defined their risk, position size, stop loss, and profit target. 🎯
A bad trade is very different. A bad trade implies someone risked their hard earned money with no plan or process. A bad trade is reckless and indiscriminate trading. This often happens to new investors or traders who do not yet understand the time, studying, and research that goes into making a rock solid plan. Be sure to remember the difference between a calculated losing trade and a bad trade with no plan or process.
TradingView Tip: there are several ways to get started with a plan, system or process. Paper trading, backtesting and/or working with proficient traders who give valuable feedback are all ways to get started. Don't risk your money without first doing research.
Number 2: Every losing trade provides data to get better
As we've mentioned several times now, losing trades happen to everyone. But remember, losing trades are also filled with insightful information and data. You can learn a lot from analyzing losing trades. 🔍
At the end of each trading day, week or month, experienced traders will analyze their losing trades in detail. What patterns are appearing? What do they share in common? Why did they happen? With this information, a trader or investor can adjust their strategy based on what they've uncovered.
Number 3: Do not let losing trades impact your health
Your mental and physical health are just as important as your financial health. Do not let losing trades impact either of those.
If your system is breaking down or several losing trades are starting to impact your emotions, step away from the computer or phone. Turn everything off and walk away. The markets have been open for hundreds of years and are not going away. When you're ready to come back, they'll be there.
Get up, get some fresh air, and get back in the arena when you're ready.
Number 4: Share your experiences with others
Traders and investors across the globe want to learn from your stories and losing trades. These are invaluable experiences that we all share in common. Social networks allow you to chat, share, and meet people who are going through similar things. We can all learn from each other.
Sure, the temptation to share your winners or act like the best trader who ever existed is tempting 😜 - but it's clear we learn together and get better when we share lessons from the loses. This is where the deepest insights are found, and together, it's where we can grow as a community of traders all trying to outperform the market.
Share and ask for constructive feedback!
Number 5: Keep Going
Markets are a game of learning, relearning, and progressing forward. New themes, trends, and stories appear and disappear daily. The journey is long and it never stops. When implementing your trading plan or investing plan, it's important to do it with the long-term in mind. One or two losing trades in a single day or week is a small fraction of what's to come many months and years down the road. 🌎
Keep going. Keep building. Keep refining your plan. Study the data.
We hope you enjoyed this post!
We hope you learned something new or informative!
Please leave any comments below and our team will read them.
- TradingView ❤️

Algorithmic Trading: Trading StrategiesTypes of Trading Strategies
When it comes to algorithmic trading, there are various types of trading strategies that traders use to identify trading opportunities and execute trades. In this chapter, we'll provide an overview of the most popular trading strategies used by algorithmic traders.
Momentum Trading
Momentum trading is a strategy where traders buy securities that are trending upwards and sell securities that are trending downwards. The idea behind this strategy is that trends tend to persist, so a security that is currently increasing in price is likely to continue to do so. Momentum traders typically use technical indicators such as moving averages, relative strength index (RSI), and stochastics to identify securities that are exhibiting strong momentum.
Mean Reversion Trading
Mean reversion trading is a strategy where traders buy securities that are currently trading below their mean or average price and sell securities that are trading above their mean or average price. The idea behind this strategy is that prices tend to revert to their mean over time. Mean reversion traders typically use technical indicators such as Bollinger Bands, RSI, and moving averages to identify securities that are trading outside of their normal range.
Trend Following
Trend following is a strategy where traders buy securities that are trending upwards and sell securities that are trending downwards. The idea behind this strategy is that trends tend to persist, so a security that is currently increasing in price is likely to continue to do so. Trend following traders typically use technical indicators such as moving averages, RSI, and stochastics to identify securities that are exhibiting strong trends.
Fundamental Analysis
Fundamental analysis is a strategy where traders use financial and economic data to analyze the underlying value of a security. The idea behind this strategy is that the market is sometimes inefficient and misprices securities, and by analyzing the underlying fundamentals, traders can identify opportunities to buy undervalued securities and sell overvalued securities.
Technical Analysis
Technical analysis is a strategy where traders use charts and technical indicators to identify trading opportunities. The idea behind this strategy is that historical price and volume data can be used to predict future price movements. Technical analysts typically use charts, moving averages, RSI, and other technical indicators to identify patterns and trends that can be used to make trading decisions.
Backtesting and Performance Evaluation
Once traders have identified a trading strategy, they must test it using historical data to determine whether it is profitable. This process is known as backtesting. Traders typically use software platforms such as Python, MATLAB, or R to backtest their strategies. Backtesting involves simulating trades using historical data and evaluating the performance of the strategy over time.
After backtesting, traders must evaluate the performance of their strategy to determine whether it is profitable. Traders typically use metrics such as the Sharpe ratio, the Sortino ratio, and the maximum drawdown to evaluate the performance of their strategy.
Conclusion
In this chapter, we provided an overview of the most popular trading strategies used by algorithmic traders. These strategies include momentum trading, mean reversion trading, trend following, fundamental analysis, and technical analysis. We also discussed the importance of backtesting and performance evaluation in determining the profitability of a trading strategy. It is important for traders to carefully consider their trading strategy and evaluate its performance before committing capital to it.
This Pivot Point Supertrend Strategy has up to 90% Success!Traders,
I'll review the Pivot Point Supertrend Trading Strategy in this video. This strategy has up to a 90% success rate with an avg. of 80-100% profits weekly. I think it's well worth our time to review and potentially implement or even automate going forward. Enjoy.
Stew

The U.S. Dollar Index | Everything You Need to Know
The U.S. Dollar Index is a measure of the value of the U.S. dollar against six other foreign currencies. Just as a stock index measures the value of a basket of securities relative to one another, the U.S. Dollar Index expresses the value of the dollar in relation to a “basket” of currencies. As the dollar gains strength, the index goes up and vice versa.
The strength of the dollar can be considered a temperature read of U.S. economic performance, especially regarding exports. The greater the number of exports, the higher the demand for U.S. dollars to purchase American goods.
The index is a geometric weighted average of six foreign currencies. Since the economy of each country (or group of countries) is of different size, each weighting is different. The countries included and their weights are as follows:
Euro (EUR): 57.6 percent
Japanese Yen (JPY): 13.6 percent
British Pound (GBP): 11.9 percent
Canadian Dollar (CAD): 9.1 percent
Swedish Krona (SEK): 4.2 percent
Swiss Franc (CHF): 3.6 percent
The index is calculated using the following formula:
USDX = 50.14348112 × EURUSD^-0.576 × USDJPY^0.136 × GBPUSD^-0.119 × USDCAD^0.091 × USDSEK^0.042 × USDCHF^0.036
When the U.S. dollar is used as the base currency, as in the example above, the value is positive. When the U.S. dollar is the quoted currency, the value will be negative.
We constantly monitor the performance of DXY because very often it gives us great trading opportunities.
✅LIKE AND COMMENT MY IDEAS✅
Please, like this post and subscribe to our tradingview page!👍

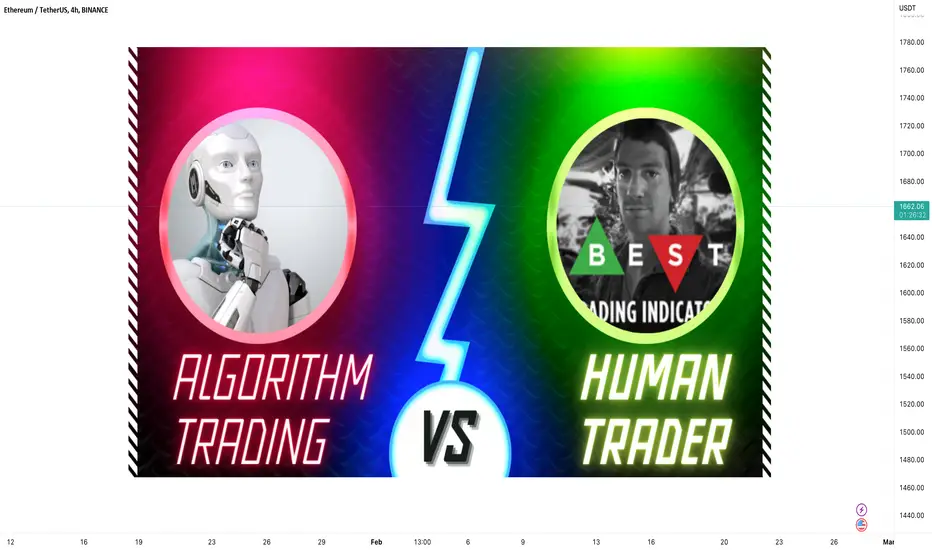
Algorithm vs Human trading | Which one is the best?Introduction
Algorithmic trading has been more popular in recent years, leading some investors to speculate that their human counterparts would soon become obsolete.
Algorithmic trading, according to some experts, provides a number of benefits over human trading, such as the capacity to examine data and make judgments more rapidly.
Nonetheless, there are many who believe that human traders still have value since computers cannot replace their expertise and intuition.
In this article, we'll take a look at the pros and cons of algorithmic trading and discuss its use in the financial markets.
Gains from Algorithmic Trading
Algorithmic trading has the benefit of being quick. Trading choices may be made by algorithms in microseconds, far quicker than by humans.
This enables investors to take advantage of opportunities that may be missed by human traders and respond swiftly to shifts in the market.
Algorithms also have the benefit of being able to trade around the clock, seven days a week, expanding the hours during which markets may be monitored and exploited.
Eliminating human emotion from trading choices is another benefit of algorithmic trading.
When human traders let their emotions cloud their judgment, the results may be disastrous.
Trading judgments made by algorithms, on the other hand, are more likely to be consistent and objective since they are based on facts and logic rather than emotion.
Last but not least, trading fees might be lowered with the use of algorithmic trading.
Algorithms eliminate the potential for human mistake and save money on transaction fees by trading automatically.
Algorithmic Trading's Drawbacks
While algorithmic trading has many benefits, it is also possible that it might have negatives.
The potential for mistakes to be made by trading algorithms is a worry. Mistakes made by algorithms might be costly if they aren't recognized right away.
In addition, losses are possible while using trading algorithms since they are pre-set to react in a predetermined way to market movements or occurrences.
Lack of human intuition is another issue that has been raised in relation to algorithmic trading.
While algorithms are programmed to process information and execute trades, they may overlook intangibles like political events and fluctuations in public opinion.
Nonetheless, human traders may be able to employ non-data factors, such as intuition and experience, while making trading judgments.
And last, algorithmic trading may amplify market volatility.
Algorithms' ability to rapidly respond to market shifts may both benefit traders and contribute to more volatility.
How Humans Fit Into Algorithmic Markets
Even if there are benefits to using algorithms to trade, human traders are still vital to the market.
A major benefit of human traders is that they may utilize their expertise and instincts while making trading judgments.
Those in the trading industry may account for intangibles like public sentiment and political events while making trades.
Human traders have the benefit of being able to quickly adjust to new market conditions.
Algorithms are designed to make trades based on predetermined parameters, but they may not be able to adapt to sudden shifts in the market.
But, human traders may be better able to adjust to these shifts thanks to their expertise and intuition, allowing them to make non-data-driven trading judgments.
At long last, human traders may supplement automated risk-control measures.
Although risk management algorithms may be set to minimize losses in theory, human traders may be able to see threats that the software misses.
Conclusion
Although there are benefits to using an algorithm for trading, it is not yet eliminating the need for human traders.
Experienced human traders still play a crucial role in the market because machines cannot replicate their wisdom, insight, and responsiveness to sudden shifts.
5 New Algorithmic Trading StrategiesAlgorithmic trading has transformed the financial markets in recent years, enabling traders to make better-informed investment decisions and execute trades more quickly and accurately than ever before. As technology continues to evolve, new algorithmic trading strategies and techniques are emerging that promise to revolutionize the way that financial instruments are traded. In this article, we will discuss five new algorithmic trading strategies and techniques that are gaining popularity among traders.
Machine Learning-Based Trading
Machine learning is a branch of artificial intelligence that allows algorithms to learn from data and improve their performance over time. Machine learning-based trading is a strategy that uses algorithms to identify patterns in financial data and make predictions about future market movements. These algorithms can learn from both historical data and real-time market information to make trading decisions that are informed by a deep understanding of the underlying trends and patterns in the market.
High-Frequency Trading
High-frequency trading (HFT) is a strategy that uses algorithms to execute trades at lightning-fast speeds, often in milliseconds or microseconds. This strategy requires sophisticated algorithms and high-speed networks to be effective, and it is typically used by institutional investors and large trading firms. HFT is often associated with controversial practices such as front-running and flash crashes, but it can also be used to improve market liquidity and reduce trading costs for investors.
Sentiment Analysis
Sentiment analysis is a technique that uses natural language processing algorithms to analyze the tone and sentiment of news articles, social media posts, and other sources of public information. This technique can be used to identify trends and patterns in public sentiment that may affect the price of financial instruments. For example, if a news article about a company is overwhelmingly positive, sentiment analysis algorithms may predict that the stock price of that company will rise in the short term.
Multi-Asset Trading
Multi-asset trading is a strategy that involves trading multiple financial instruments across different markets and asset classes. This strategy requires algorithms that can analyze a wide range of data sources, including market news, economic indicators, and social media sentiment, to make informed decisions about which assets to trade and when to enter or exit positions. Multi-asset trading is often used by institutional investors and hedge funds to diversify their portfolios and hedge against market risk.
Quantum Computing-Based Trading
Quantum computing is a cutting-edge technology that promises to revolutionize many fields, including finance. Quantum computing-based trading is a strategy that uses algorithms that run on quantum computers to analyze complex financial data and make trading decisions. Quantum computing algorithms are able to analyze a much larger amount of data than classical computing algorithms, which can enable traders to identify hidden patterns and relationships in financial data that are difficult to detect using traditional techniques.
In conclusion, algorithmic trading is an exciting and rapidly evolving field that is transforming the financial markets. The five strategies and techniques discussed in this article represent some of the most promising developments in the field, and they are likely to play a major role in the future of trading. As technology continues to advance, it is important for traders to stay informed about the latest developments in algorithmic trading and adopt new strategies and techniques to stay ahead of the curve.

Algorithmic Trading / Robo-TradingAlgorithmic Trading: Automating Financial Markets for Greater Efficiency and Profitability
Explanation
Algorithmic trading, also known as robo trading, is a process of using computer programs to execute trades automatically based on pre-defined rules or algorithms. It has revolutionized the way financial markets operate, making them more efficient, faster, and less prone to errors caused by human emotions.
Advantages
The advantages of algorithmic trading are numerous. Firstly, it enables traders to analyze vast amounts of data and execute trades with incredible speed and precision, resulting in improved profitability. It eliminates human error and bias, which are significant sources of trading losses. Secondly, algorithmic trading allows for 24/7 trading, regardless of the trader's location or time zone, which makes it possible to take advantage of global market movements. Finally, algorithmic trading also provides a level of transparency and accountability, as trades are executed automatically, and the outcomes are recorded in real-time.
History
The history of algorithmic trading dates back to the 1970s when the first computerized trading system was developed by the NYSE to automate the execution of large trades. The system was based on the principle of matching buyers and sellers electronically, and it soon became the norm for trading in the US equity markets. However, it was not until the 1990s that algorithmic trading began to gain traction in other financial markets.
As computing power increased and access to market data improved, algorithmic trading systems became more sophisticated, enabling traders to execute trades with greater precision and accuracy. With the introduction of low-latency trading platforms in the 2000s, algorithmic trading became even faster and more efficient, allowing traders to take advantage of even the smallest market movements.
Today, algorithmic trading is used in almost every financial market, including stocks, bonds, currencies, and commodities. It is estimated that more than 80% of all trades in the US equity markets are executed by algorithms, and the trend is growing in other financial markets worldwide.
In conclusion, algorithmic trading has transformed the financial markets by improving their efficiency, speed, and profitability. It is a powerful tool for traders and investors, providing them with the ability to analyze vast amounts of data, execute trades with incredible speed and accuracy, and eliminate the emotional biases that often lead to trading losses. As technology continues to evolve, we can expect algorithmic trading to become even more sophisticated, providing traders with even greater opportunities to profit from the global financial markets.

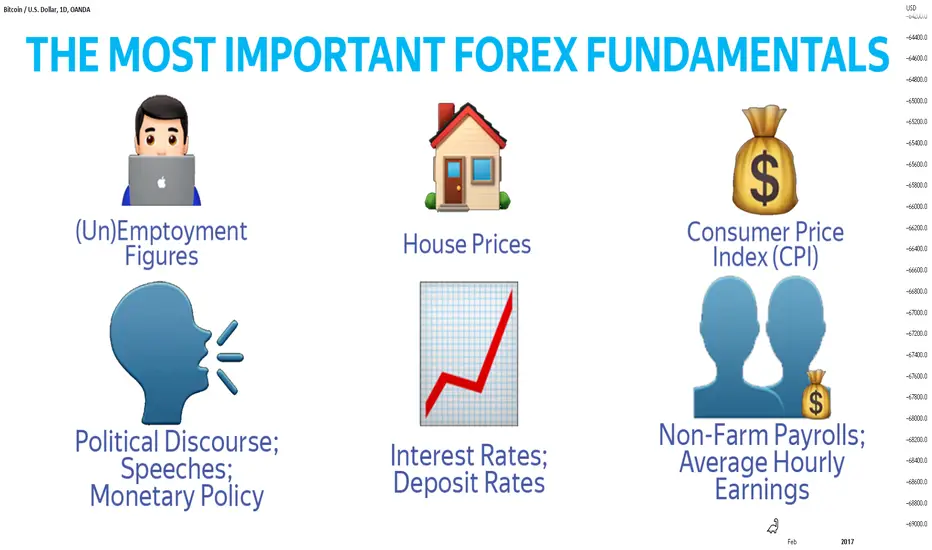
What News to Follow | Top 5 Forex Fundamentals
Economic indicators and announcements are an essential part of fundamental analysis. Even if you’re not planning on finding trades using fundamentals, it’s a good idea to pay attention to how the overall economy is performing.
Here’s a cheat sheet covering six key indicators and announcements to watch out for.
1. Non-farm payrolls (NFP)
The non-farm payrolls report estimates the net number of jobs gained in the US in the previous month – excluding those in farms, private households and non-profit organisations.
2. Consumer price index (CPI)
The chief measure of inflation is the consumer price index, which measures the changing prices of a group of consumer goods and services.
3. Central bank meetings
As we’ve seen, most traders follow economic figures so they can anticipate what a central bank might do next. So, it only makes sense that we pay attention to what happens when they actually meet and make decisions.
4. Consumer and business sentiment reports
Multiple organisations are constantly surveying consumers and business leaders to create sentiment reports. While the number of reports they produce is staggering, they all play their part in shaping the markets’ expectation for the future.
5. Purchasing manager index (PMI)
Purchasing manager indices measure the prevailing direction of economic trends in a given industry, according to the view of its purchasing managers. They are used as an indicator of the overall health of a sector.
Pay close attention to these fundamentals.
They play a crutial role in trading.
✅LIKE AND COMMENT MY IDEAS✅
Please, like this post and subscribe to our tradingview page!👍
The most common mistakes in trading
Today, I will share a practical secret that I have learned for many years. Don’t hesitate when trading. If you hesitate, then don’t trade in the short term.
Many people also have the habit of making trading plans. For example, I will enter the market at any position today, but when the opportunity really arises, I hesitate to make a decision. After the market ends, I find that I have made a profit, but I did not enter the market, and wait until the opportunity appears again. At that time, I thought to wait a little longer, but it turned out to be profitable again, and I still didn’t enter the market. Finally, I finally made up my mind that the next time I was in this position, I would definitely enter the market. As a result, when he entered the market, what he ushered in was a loss.
In fact, in the trading market, good entry opportunities are fleeting and will not come often. If frequent entry opportunities appear, it must be a trap. When you have made a plan, all you need to do is Strictly implement, if you have no confidence when you enter the market, then I suggest that you do not make any transactions in the short term, because your plan has been disrupted, and the market likes to confuse your eyes and challenge your bottom line. It's also a psychological game.
I make my trading plan every day and strictly implement it, so friends who follow me can receive my plan as soon as possible, which can be used as a reference, but I will choose to enter the market at the first time, if you hesitate, choose the second The second or third chance to enter the market, the probability of loss will increase a lot, so don’t do this, you can consult me to get the latest plan.
❤️Please, support my work with like, thank you!❤️

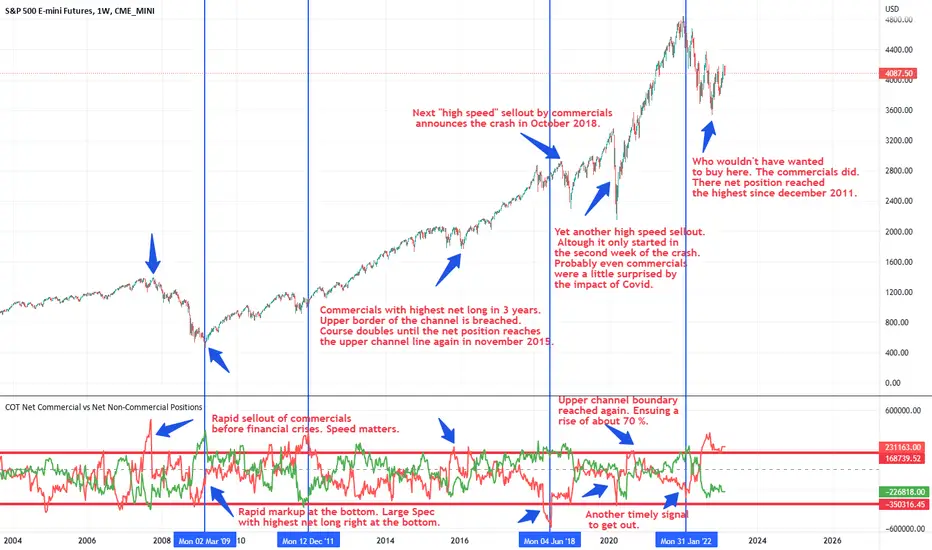
Educational: How I use the CoT-Data to verify EW countsHi guys today I want to do a short educational on how I use the CoT-data to validate longer term EW counts. Normaly I update my CoT-Spreadheets on Sunday. But since we have been waiting for the data to be released for three weeks now, I have time to show you, how useful it can be.
Unfortunately my english writing skills have detoriorated over time but I guess that my charts will make the point.
I guess most of you have already heard about the CoT-Report and know what kind of data is report. So I go right in medias res.
When looking at the CoT-Data I first calculate the net positions of the three trader categories. Here in Tradingview you find community indicators, that can do that for you.
The idea is that large speculators are skilled traders that trade the trend. So when the market trend is up the net position of the large speculators should be long and in the best case increase from week to week. Usually the large speculators carry the largest net long position, when the trend is old and nearing the top.
Commercials normaly do the opposite. They try to hedge their business (consumer) or lock in high prices (producer). In normal circumstances they mirror the position of the large speculators.
So normaly you can follow the large speculator and profit form the market trend.
The CoT-data gets interesting, when we near a turning point and the positions of the large speculators and commercials reach extreme levels. The idea here is, that large specs even though they have a large portfolio their monetary resources are limited whilst the hedging commercials have bigger pockets.
When the position of the large specs reaches new highs one expect the trend to end because they have no more ammunition to ignite a further up or down move. On the other hand the commercials how know the fundamentals of the market can now ignite a move in the opposite direction.
That is the basic idea. So what I do is to compare the net positon with historical position. Therefore I calculate an index over the last 3 years. The formula is Index = 100 * (current net position - minimum net) / (maximum net - minimum net). The index ranges from 0 = lowest net (short) position in free years and 100 highest (long) position in three years.
When the index is above 80 or below 20 the market is ripe for a change in the larger trend. Unfortunately the CoT is only seldom a great instrument to time the market. Commercials can ride against the trend over extended periods. I know for sure, cause more than one time I had to close a position. But it is great as a filter or in combinination with EW or seasonality. When in a final wave 5 in either direction you want to see those extreme Index levels.
For those interested I will continue below. But now I want to drive home one of the most important points.
SPEED MATTERS! Commercials know the fundamentals of their market. And if they hastyly sell out and turn their position something big is going to happen. You can see this in the above chart of ES.
More recent I have a chart of Bitcoin, were you can see, that commercials act swiftly if they see an opportunity.
I produce a spreadsheet every week, were I calculate the current index value and the change from the week before and over 4 weeks. I hope that I that data will be released next friday so I can update. You can download the spreadsheet at docs.google.com
In the spreadsheet you can also see the market bias. Market Bias is the net position of the large speculator minus the net position of the commercials. So if for example the large speculators are net long and the commercials are net short the net net position of the commercials will be added to the net position of the large speculator. The total balance then shows the amount of contracts in favor of the current trend. As with the index the change and speed of change is more important than the value itself.
I hope you enjoyed this and gathered some helpful information and I will come up with some new EW analysis next week. Have a great weekend.
How to complete a trading journalIn short, a trading strategy is a plan that you draw up, taking into account a huge number of factors ... Starting from trading charts - ending with what the weather is like outside today. There you also fix negative things. All that leads to losses. Well, the most important thing for which we record all this is to make a super duper analysis and clearly and clearly see what the losses are due to. Further, of course, we try to exclude them. Why is it necessary? In order not to stand in one place and finally reduce the number of negative transactions.
In order to be able to clearly identify all positive and negative factors, a trading journal is required, which should include:
1) Risk management strategy and profit taking.
2) Trading plan as you see it and tools to use in trading.
3) Psychological state when you feel greedy or fomo, from missed opportunities.
For these factors, it will take a long and dreary time to collect statistics. The more the better, for good you need at least 3 months.
In the diary of transactions, you can upload all your transactions that you opened. This is done again to collect statistics and further analysis.
What I log:
1) The opening date of the transaction before the exact time. This is done in order to find this setup in the future and completely disassemble it in order to identify all errors and inaccuracies.
2) Traded pair. You enter the ticket of the tokens you are trading, it can be Bitcoin (BTC), Ethereum (ETH), I think it's understandable.
3) The side of the position is Long or Short. In the future, you can see why you opened this side here, it might be more accurate to open it in the opposite direction. Accordingly, you can also analyze your mistake.
4) Criteria for entering a trade. This will be the most important aspect of filling out the diary, since here you must clearly describe the criteria without reference to emotions and your needs. The main thing is to describe not what you want to see, but what the chart offers. Do not confuse these concepts, from your far-fetched Wishlist and binding to some kind of opinion, but clearly argue your thoughts regarding this position. Entry criteria can be the best trading tool you use, it can be a trend trade or other factors that you used for analysis.
5) Screenshot of the trade entry. The login screenshot is needed to determine your entry, whether you entered correctly and what were the factors for this entry. After that, this transaction is analyzed by the input and the correctness of the actions.
6) Screenshot of the trade exit. An exit screenshot is necessary to understand the error, why you got a loss and how you can avoid it in the future.
7) The results of the transaction. You just write down what profit / loss you recorded. You can enter % to the deposit and PNL at will. Personally, I only use % of the deposit.
8) Notes after the transaction. Here you should fully describe which notes for the future are worth emphasizing and which you will have to return to for a detailed analysis. Again, write your thoughts without being tied to emotions and the outcome of the transaction.
Hope you enjoyed the content I created, You can support with your likes and comments this idea so more people can watch!
✅Disclaimer: Please be aware of the risks involved in trading. This idea was made for educational purposes only not for financial Investment Purposes.
---
• Look at my ideas about interesting altcoins in the related section down below ↓
• For more ideas please hit "Like" and "Follow"!
How to run your Strategy for automated cryptocurrency tradingTo run TradingView Strategy for real automatic trading at any Cryptocurrency you need:
1. Account at TradingView. (Tradingview.com)
And it can’t be a free “Basic” plan.
You must have any of available Paid packages (Pro, Pro+ or Premium).
Because for automatic trading you need the “Webhook notifications” feature, which is not available in the “Basic” plan.
2. Account at your favorite big Crypto Exchange.
You have to sign up with crypto exchange, and usually pass their verification ("KYC").
Not all exchanges are supported.
But you can use most big "CEX" on the market.
I recommend Binance (with lowest fees), Bybit, OKX, Gate.io, Bitget and some others.
3. Account at special “crypto-trading bot platforms”.
Unfortunately you can’t directly send trade orders from TradingView to Crypto Exchange.
You need an online platform which accepts Alert Notifications from TradingView and then – this platform
will generate pre-programmed trade orders and will send them to a supported Crypto Exchange via API.
There are few such crypto bot platforms which we can use.
I personally have tested 3 of them.
It’s "3commas", "Veles" and "RevenueBot".
All of them have almost the same main function – they allow you to make and run automated DCA crypto bots.
They have little different lists of supported Exchanges, different lists of additional options and features.
But all of them have main feature – they can accept Alert Notifications from TradingView!
3commas is more expensive.
RevenueBot and Veles – have the same low price – they take 20% from your trade Profit, but no more than $50 per month!
So you can easily test them without big expenses.
4. Combine everything into One Automatic System!
Once you have all accounts registered and ready – you can set up all into one system.
You have to:
1. Create on your Crypto Exchange – "API" key which will allow auto trading.
2. Create on the bot platform (3commas, RevenueBot, Veles) – new bot, with pre-programmed trading parameters. (token name, sum,
long/short, stop-loss, take-profit, amount of orders etc)
3. On TradingView configure (optimise) parameters of the strategy you want to use for trading.
4. Once it’s done and backtests show good results – you should create “Alert” on the strategy page.
You have to point this alert to “webhook url” provided to you by the crypto-bot platform (and also enter the needed “message” of the alert).
For each of the bot platforms, you can find the details on how to set them up on their official sites.
If you do not understand it and need help, please contact me.

How to create simple web-hook to send alerts to TelegramHello Traders,
In this video, I have demonstrated how to create a simple web-hook which can send your Tradingview alerts to Telegram channel or group for zero cost.
⬜ Tools Used
▶ Telegram Messenger
▶ Replit - Cloud platform for hosting small programs
▶ Postman - To test web-hooks before going live (Optional)
▶ Cronjob - To set health-check and keep bot alive
⬜ Steps
▶ Create Telegram Bot
Find BotFather and issue command /newbot
Provide bot name
Provide bot username - which should be unique and end with _bot
Once bot is created, you will get a message with token access key in it. Store the token access key.
▶ Prepare Telegram Channel
Create new telegram channel
Add the bot @username_to_id_bot to it as admin and issue /start to find chat id
Store the chat id and dismiss @username_to_id_bot from channel
Find the bot created in previous step using bot username and add it to channel as admin
▶ Setup replit
Create a free Replit account if you do not have it already.
Fork the repl - Tradingview-Telegram-Bot to your space and give a name of your choice.
Set environment variables - TOKEN and CHANNEL which are acquired from previous steps.
Run the REPL
▶ Test with postman
Use the URL on repl and create web-hook post request URL by adding /webhook to it.
Create post request on postman and send it.
You can see that messages sent via postman appearing in your telegram channel.
append ?jsonRequest=true if you are using json output from alerts.
Json request example:
▶ Set alerts from tradingview to web-hook
Use web-hook option and enter the webhook tested from postman in the web-hook URL
And that's all, the webhook for Telegram Alerts is ready!!
Thanks for watching. Hope you enjoyed the video and learned from it :)
PS: I have made use of extracts from the open github repo: github.com

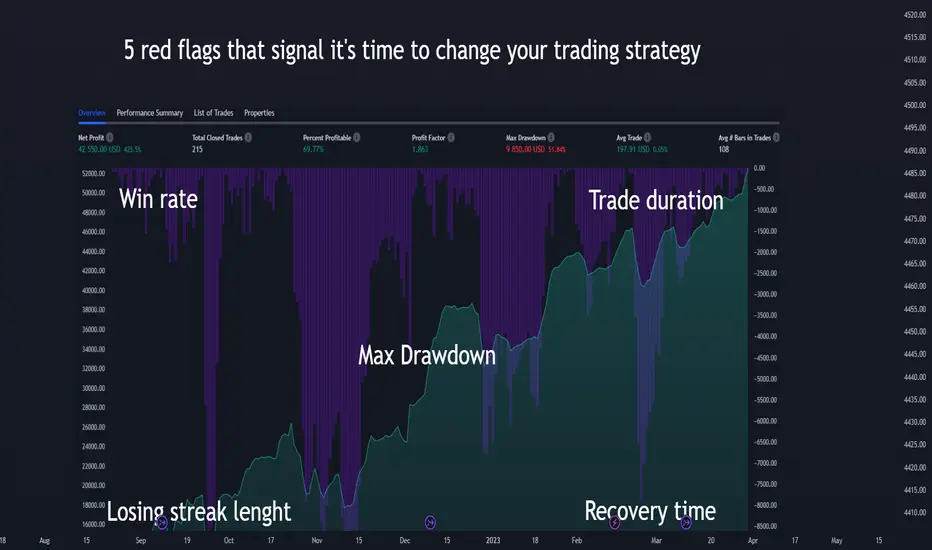
5 red flags: When to change your trading strategy?Trading is a constant balancing act between risk and reward. Developing a successful trading strategy is a significant accomplishment in its own right, but it is equally important to know when it is time to adjust your approach or when to abandon it altogether. To help you stay ahead of the curve, I've identified the 5 telltale red flags that signal it could be time to change your strategy. Whether it's a shift in market conditions or a decline in performance, these red flags are crucial indicators that something needs to change.
Why can live trading results deviate from backtest?
It is not uncommon for live trading results to differ from the results obtained during backtesting. The main reasons for it are:
1. Improper Backtesting Methodology
This is kind of an "umbrella term" for everything that can go wrong while backtesting, but the facts remain: Backtesting requires a robust methodology to provide reliable results. If the methodology is flawed, the results of the backtest may not accurately reflect the strategy's performance. Common issues include overfitting to past data, using insufficient data ( or cherry-picking your data - talk about introducing a bias into your results! ), or not accounting for transaction costs.
2. Overfitting to Past Data
The most common culprit for live trading performance not achieving backtesting expectations is overfitting to past data. Overfitting occurs when a strategy is designed to fit the past performance of a market too closely, leading to a false representation of its potential future performance. Overfitted strategies have beautiful backtesting results but live trading performance fails to deliver even a resemblance of such results. A typical example would be using an overly specific period of any indicator - such as EMA(103).
3. Strategy Not as Robust as Thought
Backtesting can provide a false sense of security, and traders may not fully appreciate the limitations of their strategy until they begin live trading. For example, a strategy that performs well in a trending market environment may not perform well in ranging conditions, or a strategy may be vulnerable to certain market events that were not accounted for during backtesting.
4. Execution Issues
Live trading often involves executing trades in real-time, which can be subject to various challenges that were not present during backtesting. For example, slippage, latency, or data inaccuracies can all affect the performance of a strategy.
5. Market Conditions Have Changed
I almost don't want to add this one to the list, because I worry most people will use this as a scapegoat, and not examine in detail all the previously mentioned reasons, that they actually can influence. But the fact is, the market is dynamic, and conditions can change rapidly. Changes in central bank policy, the introduction of new market participants, shifts in investor sentiment, or changes in economic conditions can all impact a strategy's performance.
You must be aware of these potential issues and take steps to address them. This includes ensuring a robust backtesting methodology, regularly monitoring and adjusting the strategies, and being prepared to adapt to changing market conditions.
What to do if your strategy shows any of these red flags
When you encounter red flags in your trading strategy, it's crucial to take prompt and decisive action. Personally, if my strategy deviates beyond the backtested results in any of the five metrics mentioned below, I immediately stop live trading and switch to paper trading to monitor its performance.
A robust backtesting methodology should provide a reliable indicator of the strategy's performance, and any deviation from the backtested results should be taken as a sign that further examination is needed. I cannot recommend any leniency in this matter ( translation: Every time I did, it was a painful lesson ).
If you're getting to this position often, it suggests that your backtesting methodology is not robust enough. My guess is: you are either overfitting to past data, or introducing any of the dozens of biases that come with backtesting.
The red flags
I picked these red flags because of their importance or ability to provide a signal early on. It's important to note that the following list is possibly subjective. Not everyone will agree with me on this list. Everyone will agree, however, that it is a good reason to stop a strategy from live trading if it has significantly deviated from its backtested results .
Many traders mistakenly believe that an automated strategy is a "set-and-forget" system. It's not. It is crucial to monitor its performance and be prepared to make adjustments or even stop the strategy if necessary. You might monitor different parameters than me, but you need to monitor something. Make sure your hard work of testing and developing a strategy with a positive expectancy doesn't go to waste.
1. Max drawdown
The first and most critical red flag to watch out for is the difference in maximum drawdown between the live trading strategy and its backtested version . Maximum drawdown is a measure of the largest decrease from a peak to a trough in the value of your portfolio balance, expressed as a percentage of the drop from the peak value. Say you started with 100, traded the account up to 150 with a handful of wins, and now you are at 135 after two losses. Your current drawdown is 10%, and as long as your drop from the current peak was not higher until now, this is also your max drawdown.
The drawdown curve as a whole is a crucial indicator to monitor. Its other secondary parameters can provide further insight into the performance of your trading strategy. These include:
The steepness of the drawdown curve - a steep curve indicates a rapid decrease in value caused by a handful of big losses, while a more gradual curve indicates a slower decline - a longer streak of smaller losses.
The number of trades it took to reach the maximum drawdown - a high number of trades indicates a long period of poor performance, while a low number indicates a short period of sizeable losses.
Total recovery time - the length of time it takes to recover from the maximum drawdown can provide insight into the resilience of your strategy. Generally, you want a more resilient strategy with quick recovery.
By monitoring these parameters in addition to the maximum drawdown, you can gain a more comprehensive understanding of the performance of your trading strategy and make informed decisions about any necessary changes.
Side note: To help you gauge the downside risk, calculate your strategy's Ulcer Index .
2. The losing streak length and frequency
A losing streak is a consecutive sequence of trades that result in losses. If the maximum length of the losing streak in live trading exceeds the results obtained during backtesting, it could indicate that the strategy may not be as consistent or reliable as originally believed.
Try to examine how you would feel in these streaks. If, for example, your strategy regularly alternates between wins and losses, you'll probably feel fine. But if you have periods of long winning streaks and then periods of long losing streaks, it could be emotionally hard to handle. You could get an "itchy hand" and try to fiddle with your strategy even if the losing streak should have been expected since it occurred in the backtest.
3. The Recovery time
The total drawdown time can be oversimplified as follows:
Total Drawdown Time = Drawdown Time + Recovery Time
We looked at the Drawdown time already - in the first red flag, so let's examine the recovery time.
The recovery time is the time it takes for the strategy to return to a profitable state from the point of max drawdown.
For the recovery time, I have basically only one rule: It has to be more aggressive, than the drawdown time. I want to see a faster recovery than the drawdown time. This happens when your average win is larger than your average loss. Such behavior I consider healthy, and it only motivates me to look at the drawdown period more closely ( Is there a pattern in the drawdown occurrences? Can I identify them and filter them out somehow? )
4. Win rate
This red flag is self-explanatory. The win rate of your live traded strategy should not be significantly different from the backtested version. However, you need to make sure you have enough data before you make any decisions. And therefore it is not the first actionable indicator that something might have gone awry.
5. The trade duration
The trade duration difference between your strategy's backtested and live traded versions is another vital red flag to look out for. Trade duration refers to the time a trade is kept open, from entry to exit.
If, for example, the trade duration in your backtest was anywhere between 30 min and 4 hours, but in live trading conditions, you observe a handful of trades with a duration of 20 hours. Is that a cause for concern? Does it warrant stopping the strategy?
Consider the reasons behind such deviations, as it could be an early example of changing market conditions, mismatches in trade execution, or other factors. In the above example, if you opened a trade at the end of the New York session and closed in the London session, maybe the Asian countries had a national holiday and therefore left markets completely illiquid, but the strategy did what was expected.
It is also a good idea to look at the distribution of trades in time. For example, if your backtesting was calibrated to trade during the London and New York sessions, but the live trading strategy generates the majority of trades during the Asian session, this could be a sign of discrepancies that might need to be addressed.
Conclusion
Knowing when to stop a strategy from live trading is integral to the day trading process. By closely monitoring key metrics and values, and comparing them to the results of your backtesting, you can make an informed decision about whether to continue using a strategy, invest time in improving it, or stop it altogether and look for a better one. And whether you monitor the same indicators or develop your own, as long as you regularly check in on your strategy's results, you are on your way to improving your chances of achieving long-term profitability.
I wish you all the best in your trading journey!