Bollinger BandsBollinger Bands
Timing for options trades relies on many price signals and confirmation. Even so, knowing when trends are likely to continue or to end is a skill of its own and many traders have timed entry and exit poorly because the trend was misread. One signal helps overcome this problem.
Bollinger Bands (BB) track the trend with three bands. The middle band is a simple moving average of 20 sessions, and the upper and lower bands are each two standard deviations of that average. This sets up a great visual, forming a “probability matrix” of both price and trend.
Because price is not likely to trade above the upper band or below the lower band for very long, any move outside of this matrix is likely to be followed by a retreat back into range.
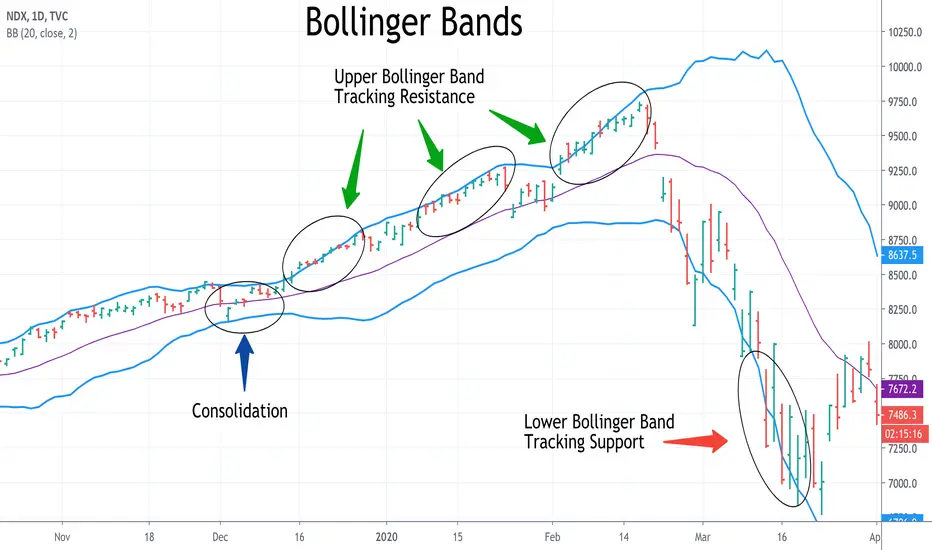
However, BB is not just a price-specific analytical tool. It also sets up a version of resistance and support as a dynamic factor rather than the traditional straight line. The chart of the Nasdaq 100 Index shows this relationship between the upward-moving trend and resistance.
It is possible to draw straight lines to identify resistance or support as well as times of breakout. BB tends to provide a dynamic version, which is more accurate and more predictive. As the price trend is upward-moving, the upper band tends to track resistance with extreme accuracy. And as a trend moves downward, the lower band tends to track support
In the NDX chart, three examples of the relationship between the upper band and the dynamic price movement are circled. The most revealing aspect of this is how accurately the band points to both entry and exit. As the price moves close to the upper band, it marks the beginning of a strong bullish move. This is seen in all three of the highlighted examples. These are highly reliable entry points for bullish trades such as long calls or short puts.
The bullish trend ends as price moves away from the upper band. This is also seen clearly in all these instances on the chart. Logically, this marks an exit point, but not necessarily the start of a bearish move. Unlike most reversal signals, the move of price away from the upper band signals only the end of the price move. The next phase could be resumption of the trend, retracement, or reversal. To decide, requires a new set of signals.
The interaction between the bands and identification of the trend also works when a dynamic trend ends and moves into a period of consolidation. This occurred at the beginning of December. Notice how strongly the band width narrows, going from 600 points in beginning November down to under 250 points. This shrinking band width signals a likely period of consolidation, which serves as a rest between dynamic trends, a plateau before trend resumption or reversal. This also points to the timing for a different type of option trade, which exploits a range-bound tendency in the short term. In fact, consolidation may be the most profitable trend for short-term trading because breakout is easily identified. Look for a widening of the band width to anticipate a new dynamic move. It does not matter whether that will be bullish or bearish; the issue is that a widening band width signals likely end to consolidation.
Entering a consolidation-type trade like an Iron Condor (with strikes far outside the band width), a short covered straddle, are well-timed as consolidation begins, but should be closed as consolidation ends. At that point, a new trade can be opened to exploit dynamic price movement, such as synthetic stock (long or short) or simply a long option.
The issue to keep in mind in all of these timing decisions is that BB provides more than a reliable tracking device for price. It also marks the nature of short-term trends, whether dynamic or sideways-moving. It is one of the most reliable predictive signals options traders can find.
Trading Tools
Trader's Guide to Options Part 3The information in this guide is intended to get you started with your understanding of options, the terminology, and their basic characteristics. In addition to this guide, it is recommended that you study all information available under the education section of your broker’s website. Most brokers who cater to options traders provide good information that will help you learn.
Intrinsic Value
In-the-money
Call options are in-the-money if the stock price is above the strike price.
Put options are in-the-money when the stock price is below the strike price.
The amount by which an option is in-the-money is referred to as intrinsic value .
At-the-money
Options are at-the-money when the stock price is trading at or very near the strike price.
Out-of-the-money
Call options are out-of-the-money if the stock price is below the strike price.
Put options are out-of-the-money when the stock price is above the strike price.
If an option is out-of-the-money it has no intrinsic value .
Time Value
Options have two parts that comprise their value; Intrinsic Value and Extrinsic Value. Extrinsic value is also known as time value. When an option is in-the-money (ITM) it has intrinsic value equal to the amount it is ITM. Option price - intrinsic value = time value.
XYZ stock is trading at 181.72
The 180 call strike is 1.72 points ITM so, there is $1.72 of intrinsic value.
$5.85 is the ask price. $1.72 of this is intrinsic value.
$4.13 of the $5.85 ask price is time value.
Time value decays as expiration approaches. The closer to expiration, the faster time value decays. Sellers of options use time decay as part of their winning strategy. Time decay is a benefit for option sellers and a problem for option buyers.
The Reality of Trading
In the real world, investors very rarely exercise their option contracts to take profit from a trade. Instead, they simply BTC or STC the options prior to the expiration date. The advantage of doing so allows them to capture some of the time value of an option, in addition to the intrinsic value. It also allows them to use the leverage of options that do not require the larger amounts of capital required to actually buy and sell the underlying stock.
Let’s analyze some examples to become familiar with common terminology:
AAPL is trading at $360 and the following shows a BTO of 3 call contracts of the September $355 strike at an ask price of $27.40:
The underlying Apple stock value is $360 per share.
The expiration date of the call is the third Friday in September.
The strike price is $355.
The call is in-the-money because the stock price is above the strike price.
The premium is $27.40 per share.
There is $5.00 of intrinsic value (in-the-money)
There is $22.40 of time value (out-of-the-money).
Number of shares represented is 300 (3 contracts x 100 shares per contract).
Buyer is hoping the stock rises, increasing the intrinsic value and causing the value of the option to also increase.
Since the expiration is about 3 months out, on a move higher the position is not subjected to rapid time value decay.
MA is trading at $294 and the following represents a STO of 2 put contracts of the July $290 strike at a bid price of $9.50:
The underlying Master Card stock value is $294 per share.
The expiration date of the put is the third Friday of July.
The strike price is $290.
The Put is out-of-the-money because the stock price is above the strike price.
The premium is $9.50 per share.
Number of shares represented is 200 (2 contracts X 100 shares per contract).
Seller is hoping that stock remains above $290 at expiration. This will result in time value decaying thus, reducing the price of the option. Since it was STO for $9.50, when time value decays, the seller will be able to BTC for less than $9.50 and lock in a profit.
Spreads
Call and Put options can be bought and sold in combinations that offer other investment strategies. Some of these include credit spreads, debit spreads, and combination options spreads, to name a few. For example, when opening a spread, one option will be STO and a different option will be BTO. Spreads can be an excellent way to mitigate risk.
This concludes the Trader's Guide to Options. Please let us know if you have any questions.
Trader's Guide to Options Part 2The information in this guide is intended to get you started with your understanding of options, the terminology, and their basic characteristics. In addition to this guide, it is recommended that you study all information available under the education section of your broker’s website. Most brokers who cater to options traders provide good information that will help you learn.
Types of Options:
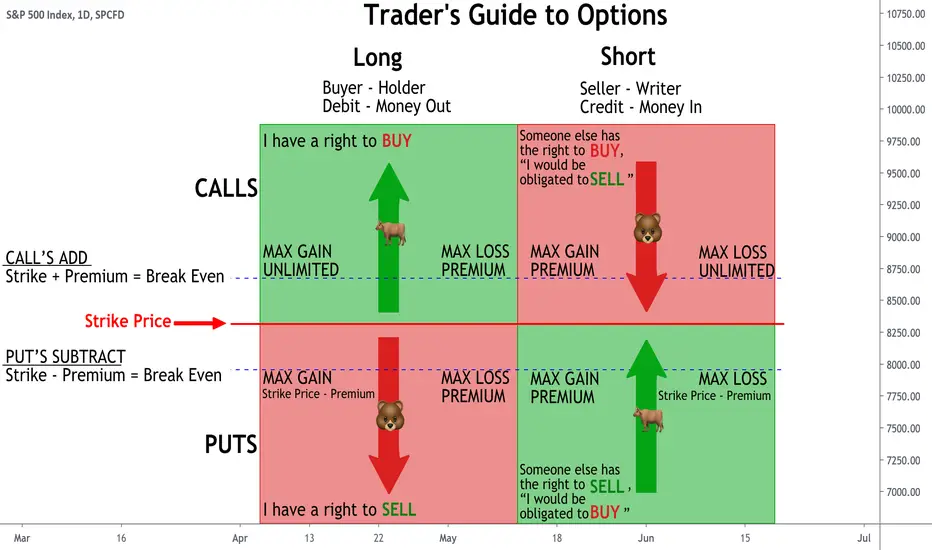
Call Options:
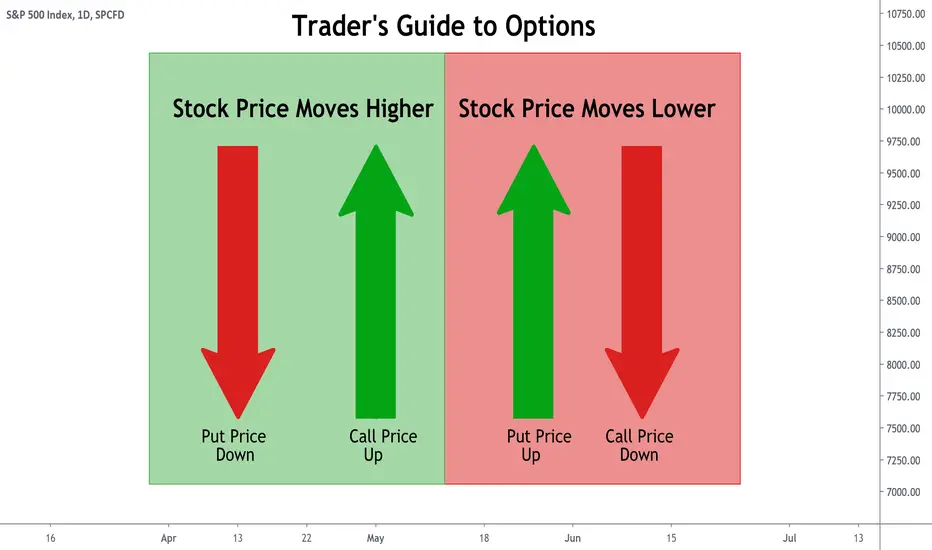
Call options increase in value when the underlying stock rises.
Buyers of calls have the right, without any obligation, to buy the underlying stock at the strike of the options contract. They retain their right until the option no longer exists, defined by the expiration date.
Call buyers anticipate the value of the underlying stock will rise. When it does, the value of the option will also increase at approximately the rate of the Delta. Buyers pay for the right to buy the stock in the future, sometime before expiration of the option. When buying the option, they pay the ask price. The premium they pay is less than buying the stock, yet they will still benefit from any appreciation in the value of the stock.
Say you wanted to buy XYZ stock because you think it is going to move up from its current price of $84. Instead of buying the stock a trader could buy a call option for a fraction of the price of the stock. Remember, all the trader is doing is buying the right to buy the stock without any obligation to actually buy it. The option only costs $4.00 for the right to buy the stock at some future date. Buying 1,000 shares of the stock would require $84,000 but buying 10 options contracts would only cost $4,000.
Call Options – The Sellers…
Sellers of call options are selling to someone else the right to buy the underlying stock from them. When/if the buyer chooses to buy the stock from the seller, (remember, the buyer has no obligation to do so) it is referred to as an exercise…the buyer is exercising the right to buy the stock. The seller is obligated to deliver the stock to the buyer. A seller’s obligation ends when the stock is exercised, the option expires, or the option is bought to close (BTC).
Call sellers receive a premium from the buyer. The buyer is paying the seller for the right to buy the stock in the future. Sellers want the price of the stock to go down. Why? If the price goes down, the buyer will have no reason to exercise since they could buy the stock for less at the current market price. In this case, the seller gets to keep the premium paid by the buyer.
So, what does this mean in plain English? The concept of a call option is present in many situations. For example, you discover a painting that you would love to purchase. Unfortunately, you will not have the cash to buy it for another two months. You talk to the owner and negotiate a deal that gives you an option to buy the painting in two months for a price of $1,000. The owner agrees, and you pay the owner a premium of $50 for the right to buy the painting.
Consider two possible scenarios that can impact the value of this “option”:
Scenario 1: It is discovered that the back of the painting has a signature of a famous artist, which drives the value of the painting up to $10,000. Because the owner sold you an option which gives you the right but no obligation to purchase the painting at the previously agreed price, he is obligated to sell the painting to you, the buyer, for $1,000. The buyer would make a profit of $8,950 ($10,000 value – $1,000 purchase price – $50 for the cost of the option).
Scenario 2: After closer review of the painting, it is discovered that the signature on the back is not of a famous artist, but is the brother of a famous artist. This actually drives the value of the painting down to $500. If the buyer exercised their option to purchase the painting it would cost $1,000. This would not make sense because the buyer could instead just buy it at “market price” for just $500. Since the buyer had no obligation to purchase based on the option contract, the agreement, or contract, would just expire and the buyer would lose the $50 premium paid.
The example demonstrates two important points. When you buy an option, you have a right, but not an obligation, to do something. You can always let the expiration date pass, at which point the option becomes worthless. If this happens, you lose 100% of your investment, which is the money you paid for the option.
Put Options
Put options increase in value when the underlying stock decreases in value.
Buyers of puts have the right, without any obligation, to “put” the underlying stock to someone else at the strike price of the options contract. They retain their right until they sell to close (STC) the option or it no longer exists, defined by the expiration date.
Put buyers anticipate the value of the underlying stock will go down. When it does, the value of the option will increase at approximately the rate of the Delta. Buyers pay a premium for the right to be able to put (sell) the stock to someone else in the future, sometime before expiration of the option. When buying the option, they pay the ask price.
Say you thought XYZ stock is going to move down from its current price of $84. Buying a put with a strike of $85 gives the buyer the right in the future to sell or put the stock to someone else at $85. So, if the stock declined to $75, the buyer of the option could buy the stock at $75 and immediately exercise their right to sell/put the stock at $85, making a $10 profit. Remember, all the trader is doing is buying the right but has no obligation.
Put Options – The Sellers…
Sellers of put options are selling to someone else the right to sell/put the underlying stock to them. When/if the buyer chooses to put their stock to the seller, this is referred to as being assigned……the buyer of the put option is assigning the stock to the seller. The seller is obligated to buy the stock based on the strike price of the contract. A seller’s obligation ends when the option expires or the option is bought to close (BTC).
Put sellers receive a premium from the buyer. The buyer is paying the seller for the right to sell the stock to the seller in the future. Put sellers want the price of the stock to go up. Why? If the price goes up, the buyer will have no reason to assign the stock since they could sell the stock for more at the current market price. In this case, the seller gets to keep the premium paid by the buyer.
Exercise and Assignment
Most stocks and ETF’s are American style options. This means that if the buyer of an option chooses to exercise or assign their rights they may do so at any time prior to expiration.
Indexes such at SPX , NDX and RUT are European style options. This means that any exercise or assignment may only occur at expiration.
Who wins when the stock moves?
1. Buyers of Calls – win when the stock goes up
2. Sellers of Calls – win when the stock goes down
3. Buyers of Puts – win when the stock goes down
4. Sellers of Puts – win when the stock goes up
Are you new to options trading? Stay tuned for Part 3 of Trader's Guide to Options which will include in-the-money, at-the-money, and out-of-the-money options as well as the reality of trading.
Trader's Guide to OptionsThe information in this guide is intended to get you started with your understanding of #options, the terminology, and their basic characteristics. In addition to this guide, it is recommended that you study all information available under the education section of your broker’s website. Most brokers who cater to options traders provide good information that will help you learn.
What is an option?
An option is a financial contract between a buyer and a seller. It is an agreement to buy or sell the underlying equity (stock or index) at a set price by a pre-determined date. Instead of buying the stock a trader could buy an option for a fraction of the price of the stock.
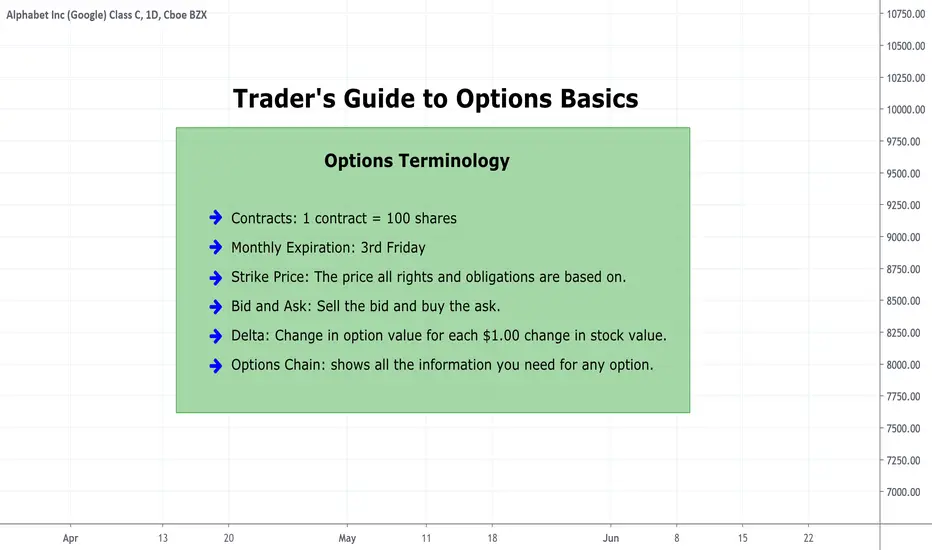
Options have the following characteristics:
Traded as contracts and each contract represents 100 shares of the underlying stock or index.
Pre-set expiration dates. Standard monthly options expire the third Friday of each month. Some index options like TVC:RUT , TVC:SPX , and TVC:NDX cease trading on Thursday before the third Friday. Weekly options expire each Friday.
Price points, referred to as the strike price, are the prices at which buyers and sellers trade option contracts. Options are, usually, available to trade in standard price increments of $5 and $10.
Quotes to buy or sell an option are presented as the bid and ask. When selling an option, the bid price is used. When buying an option, the ask price is used. Sell the bid / Buy the ask.
Delta is the change in the value of an option relative to each $1.00 change in the value of the underlying stock. If an option has a Delta value of .45, it will change in value by 45 cents for each $1.00 change in the value of the stock.
- NASDAQ:GOOG is trading at 1445.
-The 1445 call strike has a Delta of .50
-GOOG goes down $10
-The 1445 call will decline in value by $5.00 = ( $10 * .50)
The Options Chain:
All option information for any stock or index is listed on an options chain. The options chain can be found on the website of the broker you use to trade. The chain will list all available strikes and expirations, the Delta, and the bid and ask prices. It will also display both Call and Put options.
Ways to trade Options:
There are four actions that could possibly be taken when trading options:
1. Buy To Open (BTO) - buying an option as part of opening a new position.
2. Sell To Open (STO) - selling an option as part of opening a new position.
3. Buy To Close (BTC) - buying back an option that was originally sold to open
4. Sell To Close (STC) - selling an option that was originally bought to open
When a position is Bought-To-Open, it is referred to as a long position .
When a position is Sold-To-Open, it is referred to as a short position .
When a position is Bought-To-Open, it is done for a debit .
When a position is Sold-To-Open, it is done for a credit .
Are you new to options trading? Stay tuned for Part 2 of Trader's Guide to Options which will include teaching about call and put options.
<- Direct link to chart image.
💲Holy Grail Trading System 💲Hello, my lovely friends!!!💓💓💓 Link for great view 👉🏻https://tradingview.sweetlogin.com/x/VYQKhV8J/
🔥Today I have something spesial for you today! 🔥 That's 💲Holy Grail Trading System 💲!!!
By “Grail” in trading we mean a unique trading system that can continuously generate profi ts.
☝🏻 According to the legend of the Holy Grail, those who drink from this cup receive immortality.
The idea of this scheme is simple. Only by applying of those three conditions You'll become possible to significantly increase capital.💰
🧐Let's go briefly through all the elements.💪🏻
The first element,🎯 trend trading , I think, doesn't need unnecessary comments. Trending strategies for a trader are the best way to make money. 👊🏻
But why is this element alone not enough? Even if a trader has an ideal trend trading system, in the absence of a trend, he will lose money.
The trader should be where there is volatil ity 🎯, because volatility = profit.
The ship in full calm stands still, no matter what sails he had. Here, to some extent, there is an element of luck.
Yes, there is room on the market for purely external circumstances - there is nothing to be done about it. Not everything is controlled by the trader. It is especially important for risk-averse traders to learn not to get into the market during periods of low volatility.
At this, the last stage🎯, trader needs to find a balance between the desire to squeeze as much out of the market as possible and the ability to calmly, without nerves, sit out corrections.
When the market turns against the position, the trader still doesn't know whether this is a correction or a trend reversal. While sits in position and makes a decision, this movement eats up part of the floating profit or creates a loss. If the trend doesn't resume, a late trader has to close a losing position.
The risk should be approximately, that trader can make such a mistake a sufficient number of times and still be afloat 💪🏻
Guys, I try very hard for you💓💓, I carefully select the material, I want to express my thoughts as clearly as possible! 💋💋I like to teach, I get pleasure of it😘 !!!
👍🏻Support my enthusiasm with like!😘😘
✍🏻Write me in the comments if everything is clear to you, maybe you have any questions!🧐
🌞I'm glad of your feedback !!!🌞
Always Yours Rocket Bomb🚀💣
My previous works!👇🏻👇🏻👇🏻

Workaround for Extended Rectangle using Price RangeWorkaround for Extended Rectangle using Price Range

Show me spread hours - time changeThis video will show how to change the hours for spreads. These are hours I do not take any trades.

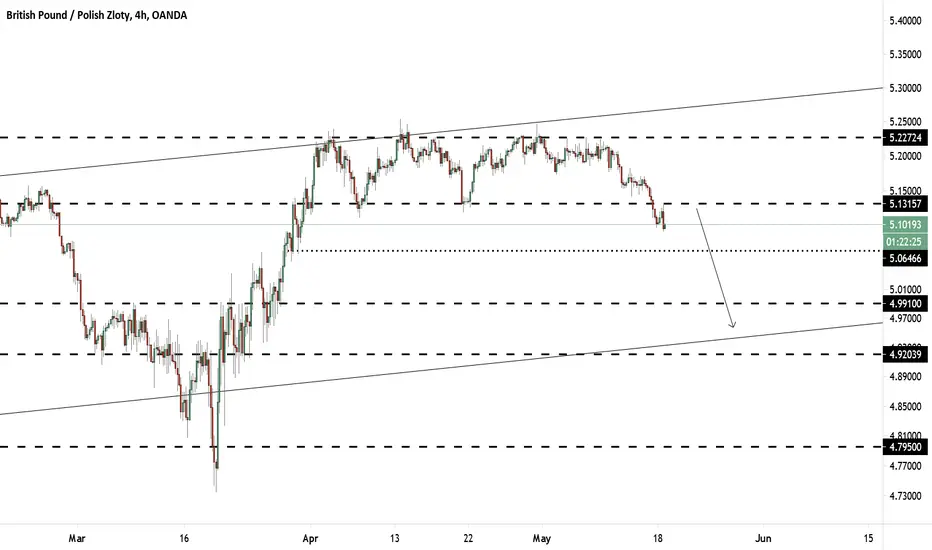
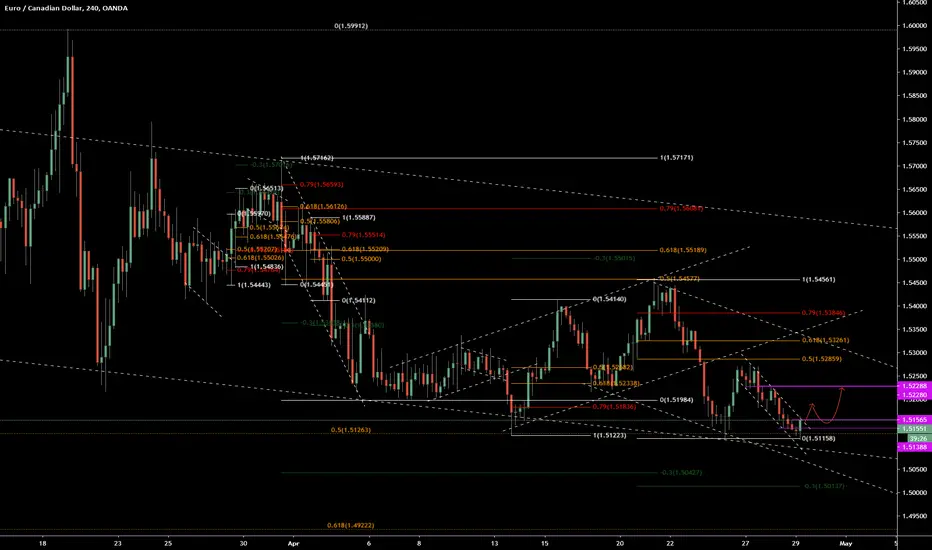
EURAUDConsolidation reached our 51% now aiming to go low first 100% then even lower depending on the moving avarage.

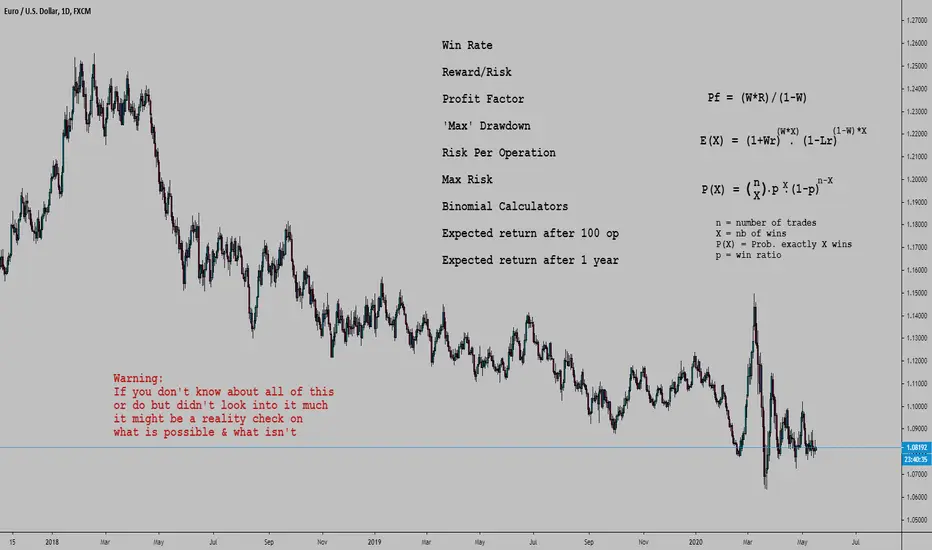
I think I just wrote a book. PF, RR, WR, etc.Intro, you can skip this part but I think it would be interesting for you to take a quick look:
Statistics estimates and formulas? Trading is mostly about emotions, not statistics estimates and formulas.
Most people do not need all of those formulas, they don't need to make plenty of stats and estimates, but just focus on discipline and emotion control.
I got this quote: "The key to trading success is emotional discipline. If intelligence were the key, there would be a lot more people making money trading."
I agree. Analysis of broker data has shown over and over that over a couple of years 90% or more clients lost money, and often all of their money.
So no point doing stats & formulas for 90% of people that will lose anyway.
What they need most is discipline, to not lose all of their money, but rather just some of their money, and emotional control, to not blow their brains out once they lose everything.
I can make a few quotes too:
Checking a thing quickly...
Stanley Druckenmiller was 46 when he did something stupid with the dot com bubble.
George Soros started at 29 and his biggest (known) mistake was Stanley Druckenmiller.
Oh this one is interesting....
Alot of profitable ones that got really confident after a few years of winning and got wiped out or made huge losses or missed on much returns (Buffet says BRK cost him 200 billion, he'd be way above Jeff Besos). I see alot of late 20s to early 30s. But even older than this after decades, it's never safe, never let your guard down. But most typical is the ~30 yo guy that made lots of money for years and laughs hysterically at noobs (retail traders mostly) and was warned of dangers by people trying to scare them away but proved every one wrong, knew he was at the top, one of the best in the world, so got really arrogant, dropped his guard down, and then boom.
By the way, totally unrelated, should I all in short USO? It's losing money over time and already so many idiots "invested" in it. There can't possibly be more morons that would buy this dead crap right? Lmao USO investors, what a bunch of brainlets. I refuse to lose against idiots just by being outnumbered. All in no SL. 😁
How do I start a show so I can do literal pump and dumps legally like Joseph Granville?
Good. Now that we got this out of the way.
1- Winrate
Pretty simple here. All this shows is what percentage of bets are winners. Doesn't really account for breakeven, doesn't differentiate between small wins big wins. Pretty useless on its own. Implicitly means that every win and loss have the same size, like putting rigid entry target SL, and never touching it.
2- Reward/Risk
How big is the average or expected win, compared to the typical loss. How much are you willing to risk and how much do you expect to make?
Most "educators" repeat how important the risk to reward ratio is, and it kinda is, because it is one of the best predictor of success.
FXCM published some data where they show that over the 3/1/2014 to 3/31/2015 period (1 year), 53% of their clients with a RR of 1 or more were in the green, while only 17% of those without were.
47% of RR >= 1 lose money. 83% of RR < 1 lose more. Their typical win % over a quarter is 25%, and the typical global win % over a year is around 20%.
I would be willing to bet that profitability goes up significantly with reward to risk. Some of it would of course be simply because people that end up with a huge win on their hands balloon the high RR stats.
That said, I doubt just flipping a coin, just randomly buying with a tight stop and a far away target would work. Althought...
The top myfxbook systems are almost all automated garbage systems with an average win 0.20 times the average loss, that were really lucky over a long period (3 std dev of a normal statistical distribution = 0.3% 3/1000, just pick any trash system with high WR and run a binomial probability calculator find the odds of it making profit over 100 rolls). Hey I'll do this later in this idea.
And as I was saying, perfect transition, flipping a coin isn't a viable strategy, the reward to risk alone doesn't say it all, even if traders using a high reward to risk ratio greatly outperform those that don't. If you make 10 times what you lose, but you lose 99% of the time, emm how to say...
And this is why we must look at the profit factor.
3- The profit factor. Oh yes
Pf = (W*R)/(1-W)
I have seen reports with a gross PF of almost 3, and net of barely 1.1.
If you design a strategy you count spreads in it... It's obvious.
Day trading sucks and every analysis of day traders data shows about 1% or less make money, and don't make much.
Probably the only ones making anything are level 2 scalpers, and 'experts' selling day trading robots, or signals, or courses.
First a disclaimer! The argument of day trading having terrible profit factors applies to 95% of the time.
When the average move per unit of time goes way way up (spreads & commissions usually don't especially if volume goes up too),
and you get in 5 hours what you usually get in 2 weeks, then obviously it's different.
I focus my argument on 95% of the time, when volatility is "normal" (within 2 st dev basically, and in particular within 1 - ~70% of the time)
And I have been really nice here.
Getting an idea of what good profit factors are...
If I participated I would take a single bet with huge leverage and hope to get lucky, easy win once every couple of events, but I doubt they allow this.
Lol on the worldcupchampionship site (ran by the CME I think), there are categories, Futures traders at the top have massive returns, way above Forex.
Previous year winners with futures have bigger returns than FX, but this year is just stupid. maybe they blow up soon.
Top 5 FX participants as of May 14 have 40% to 97% returns. Top 5 with futures are already at 200-800%!
In 2018 futures winner made 250% FX winner made 200%, sometimes futures traders make huge gains. The gap is already so big lol. Anything to do with NatGas & Oil? 😆
www.worldcupchampionships.com
Looking at a "war of traders" results. 27 days... Not sure what their leaderboard is. Looks like a great way to get suckers to deposit money and pay fees asap.
First place has a PF of 44%, I assume this means 1.44, second place 160% I assume it means 2.6. Followed by 1.3, 1.05, 1.13, 1.26, 6.85, 1.11....
Prob easier to get a higher PF with commodity futures where they are so much hedgers, much fewer care about hedging FX risk, plus central banks use it to manipulate everything, more people trying to make money.
Sometimes the sharpe ratio is mentionned. Quick definition:
The Sharpe ratio measures the performance of an investment compared to a risk-free asset, after adjusting for its risk. It is defined as the difference between the returns of the investment and the risk-free return, divided by the standard deviation of the investment.
I looked at some hedge funds reports a while ago, since they diversify and hedge alot PF isn't as high.
Warren Buffet has a PF of what? 100? He makes one trade every 10 years.
It's basically impossible to find those numbers, unless you work at a brokerage, and apart from your own, with the exception of the few times a broker releases some data.
You have to take into account how many opportunities you get also, and more but alot if implicit.
I would say that a PF too low is bad, because when conditions change you will take long to notice with certainty and you will also lose way faster! If you had a PF of 1.1 you spent 5 years to grow, and that can be lost very fast AND it takes you longer to realize it is not working anyway.
A high PF has a high margin for error, profits grow fast enough so drawdowns don't eliminate years of progress, and going from 2.5 to 0.75 over a period kinda is extreme.
I think typically for operations that target 1 to 5 daily ATR, (days to weeks holding period), and you get more than something like 1 single bet a year, good profit factors are in the 1.5-2.5 range. Lower than this gets a little dangerous, more than this is the holy grail.
A 25% winrate 5R system has a PF of 1.67.
4- Max Drawdown & risk per operation & max risk
Here you use a binomial probability calculator.
Plenty on the internet.
Winrate 25%, Reward/Risk 5, PF 1.67
==> After 60 bets, on average you should get 15 wins 45 losses.
The odds of getting more than 15 wins (P: 16 or more out of 60) are 43%.
The odds of getting less than 5 wins (55 or more losses) are 0,0956%. 1/1000.
10k account. Flat $100 risk per bet.
55 loss 5 wins = $5500 in loss, $2500 in wins, down $3000.
60 loss 0 wins = $6000 in loss, $ZERO in wins, down $6000 (rekt.)
So every 1000 trades you should expect something like this right?
Even with a very decently profitable strategy it will happen.
You have to decide at what point you consider the odds of it just being bad luck to be too high, and you just want to drop it.
Smaller drawdowns are going to happen absolutely all the time.
If you are risking 1% every time and adjusting, 55L 5W would be a 27% rekt, and 60L would be a 46% rekt.
The odds of losing 18 or more out of 20 are greater than 9% (9/100). Will happen ALL THE TIME.
With 1% risk, drawdown of 8 to 18%. Expect it very often.
Some clients use funds to diversify, to get returns with low risk.
Some expect less risk and volatility than the stock market, but expect better returns. Cute.
5- Expected returns after 100 bets
Say you got a system like the one I used in my example (that you backtested + used over a great number, or just used over a greater number of operations).
Winrate 25%, Reward/Risk 5, PF 1.67
If you do not care about eating 20% punches in the face,
and risk 1% per trade, on AVERAGE, after 100 gambles,
then your results will be as such:
75 Losses, 25 wins
(0.99^75)*(1.05^25) = 1.6. Up 60%.
If you risk 1% of your 20 years life saving, you would get 20% drawdowns on a regular basis, meaning you worked for free 4 years.
You can play around with calculators and notepad to estimate how big drawdowns you'll get, how often etc.
With a 2% risk:
(0.98^75)*(1.1^25) = 2.38. Up 138%.
And regular drawdowns not of 8-18% but 23.3%-33.3%.
And once in a while drawdowns of 60% to 70%.
And a few times in a lifetime of 80% to ....
What is the max drawdown before divorce + jump off a cliff?
6- Expected returns after 1 year
And here we are...
Traders should have a vague idea to start with but mostly look at all of this after running a strategy correctly and with some profits, over a "significant" amount of time, kek can't give a number.
First of all what is the amplitude of moves you manage to catch?
So the first limit is obviously the number of waves / moves.
No matter what sytem you have you will not be able to join more waves than they are waves in the first place!
And then... how many you can catch, is much, MUCH, lower than how many there are. Duh!
Anyone with half a brain should be able to understand all of this at some point...
Someone that manages to be profitable and doesn't blow up should make 5 to 40% I guess.
That's that. It's exponentially harder, but also exponentially more profitable.
I think I should build a new income stream writting books...
Spotting signals without staring at charts all day? [Advanced]Prologue & disclaimer, you can skip this:
[ I am not talking about a strategy. I call this advanced because someone that has only been around for 3 months should be busy touching and looking at everything, soaking up info, someone around for 6 months should be busy backtesting and coming up with a decent method or strategy supported by a sufficient knowledge base.
What the focus is here is how to generate ideas without wasting time. You're profitable or hoping to be, you've got a few years doing this, you're going to keep doing it for the next 30 years, you're not going to be staring at charts all day long just to spot something.
Profitable strategies are complex, I seriously doubt something any idiot picked off the street can do will make money in the long run. An essential part of the strategy is knowing where to look. I guess most pro traders don't even do this step since they are hired to be experts at 1 thing and 1 thing only. "Looking for an Oil trader in the London region". I've heard of offers for FX & something, but those are portfolio managers, or managers for traders. I don't know how many people this applies to. What do equity traders do? Read the news, keep their ears open, and focus on companies they heard about? Day trading is still stupid.
I thought I had a huge amount with 35 (4 commodities + ~10 currencies total of 31 pairs), and here investopedia is talking about building a primary database that contains between 300 and 500 stocks and a secondary list that fits on their trading screens. Haha ye sure ok. Scram.
A site interviews a stocktwits troll "My stock selection preparation is done more on a weekly basis. 90% of my watch-list is created on the weekend, for the week ahead. At any given time I have 50–100 stocks I’m eyeing daily for potential setups.".
The fact that 90% get rekt within months and quit, 9% barely make it and don't really know what they are doing, and 1% are complete autists and paranoid about losing their edge, makes finding that kind of info pretty hard.
My watchlist barely changes, I always have 35 symbols in it. You want it big enough that you filter filter filter and go for the juiciest setups only, but hundreds LOL!!! netpicks "I day trade a watchlist of 10-25 names I spend 5-10 minutes 3 times a day scanning the whole list". Hedge funds hold hundreds of stocks currencies etc. What is this? It's like I am an OTP with a massive watchlist of 35. One Trick Poneys are always absolute beasts. Especially when they one trick complex high risk high reward things that others struggle with. And it gets worse the more abstract it is. I like it. I like it very much 😊
End of Prologue ]
This is a marathon not a sprint.
Have you ever been carrying a backpack or grocery bags and thought "hey this is quite light" and rushed forward only to get tired and have a hard time after 20 minutes, losing breath, losing your grip, and running out of energy?
What about these trolls that sprint in actual marathons and lead the race... for about 50 seconds...? Then finish in 4-5 hours (Eliud Kipchoge holds the world record with 2:01:39 man grandpa broke the record at 34 years old, and he set the london record at 35, it's never too late max heart rate goes down with age but that's all, plenty of top marathon runners and bodybuilders are like almost 40, and those are physical activities, so imagine for mental activities that rely on experience and rational thinking NOT impulses, but excuse finders will always find excuses "I am too young too young to invest yet, and I have all the time in the world, and should focus on studies" followed by "I am too old now").
Absolute 😂😂😂
Short bursts are so much easier. Quick explosion and then you're done. Sweat alot and out of breath for a while, but done.
Marathons are painful!
Feels easy at the start but it gets difficult over time. That's enough explaining.
What you want is to make it as simple and as easy as possible because your short burst motivation won't last.
Myself, I want to have a focus that is small enough to stay performant and not exhaust myself, but I don't want it to be so small I miss out a ton.
I'm going to go throught my thought process and come up with something at the end of this idea:
I have a large watchlist...
Would I miss alot?
Solution 1: I keep my 35 charts and quickly look at them visually to get ideas, to get a quick "feel" of where the price is compared to where I want it to go.
Solution 2: I go for 12-15 charts and spend more time on each thinking of all the possibilities and looking for more.
You absolutely have to make it as simple as possible.
I could remove some pairs. USDTRY I don't really ever touch. I don't remember ever doing anything with AUDCHF.
But even if I reduced it I would want to keep 25 to 30 tickers in there.
I can't be constantly scanning it. I don't look at indices much anymore, but still a bit, sorta need too I guess, and it's interesting.
Looking at US indices and Bitcoin and Tesla breaks the routine, it makes it interesting, so that's part of the solution not the problem.
I don't want to drastically reduce my watchlist, and I don't want to spend 2 hours a day looking at chart in a repetitive way.
"2 hours work a day isn't much". Doesn't work like this. First of all it is repetitive and extremely boring.
Check.
Mate.
Let's say I am looking for price reaction around support levels after an ABC. The strategy is advanced but I can divide it in steps:
There's pretty much all I can think of here, not sure what else one would look at, maybe I missed something.
When I have a potential setup I know how to analyse it, but the problem is in what order, more importantly how to get an idea?
I can't spend 20 hours a day 7 days a week analysing every currency in depth.
What is the simplest?
1- Draw supports on 35 charts once a week, set price alerts and go in more depth when an alert pops?
2- Look for reactions and then check it?
3- Do an analysis on 35 charts then set price alerts on the few levels I am interested in?
4- Look at the central bank calendar, and only pay attention to currencies moving (there's periods with certain currencies offering lots of trades and other ones doing nothing, no point looking at the ones not doing anything special or predicatable)
It takes time but it is less boring than other ways. Imperfect.
5-
This looks like the more viable direction, so let's dig into it more...
==>
So then the question is, how often do I watch, and what alerts do I use?
Better look at another now.
Other examples of "dirty" ABC:
And another question? How to know what the macro trend is etc?
Can read news often but most Forex "news" is, going to use the correct word for it, retarded.
And boring too. Absolute load of rubbish. Just read central bank announcements?
I have yet to find an interesting media. Tried to post ideas myself but it's too much.
I don't know if this is clear but it doesn't matter anyway.
Just wanted to show the thought process.
I did plenty of backtesting (I just posted a couple of charts here but I did hundreds more, not counting those I traded and those I backtested without this particular problem in mind in other words my experience).
Basically I think the optimal lazy/reward ratio is with scanning my watchlist twice a week.
More is greedy and I just won't do it (and end up missing out more), less is starting to be a little too little and I might miss out really often.
You're not here to go and chase every little move. But you do want to grab some!
At some point maybe we're all supposed to tire of it all anyway and go long term hold, or hire people.
Going to fry my brain with too much thinking.
So anyway I think I came up with this:
This would make a decent template.
Then all you have to do is fill the box with your method, system, strategi(es), preferences.
What I need to keep in mind out of this:
Step 1: Have clean charts with fib drawn (make a copy before vomitting all over it - I know I won't do it but I like to pretend)
Step 2: Sunday & Wed: When it's not Bitcoin tier and actually resembles something ⚠️, spot the area of interest (10 sec top chrono 🚨). Price alert early into.
Step 3: When I get an alert, that is a price alert ===> Then I go full TA. I have time. And it will take time. 90% filth ignored, rest gets a "reaction alert".
Step 4: When I get an alert, that is a reaction alert ===> Verify, and well I know what to do w/e. Very few to keep an eye on at this point.
If I spend too much time looking for an area to buy in then it's trash. The quicker I see it, the higher quality it is.
If I can't do this correctly, a solution is to rent an office. Easier to do pointless boring stuff regularly with an office. Just need to go twice a week.
But I really like this process. The NAZI lockdown makes it harder tbh, but with a semi normal life, following a process this simple is not a problem.
I don't even see how I can make it smoother and simpler I think I reached the limit.
That's all folks. Make it as simple and clean as possible. Good luck.
The best system in the world is the one you stick to.


BEST Quandl Bitcoin Blockchain Health DashboardHello, my Best traders,
Did you do you can build your own BEST Bitcoin blockchain dashboard on TradingView?
(I certainly didn't until yesterday)
What is Quandl?
Quandl (quandl.com) is the premier source for financial, economic, and alternative datasets, serving investment professionals.
Quandl’s platform is used by over 400,000 people, including analysts from the world’s top hedge funds, asset managers and investment banks
How can you access this dataset via TradingView?
- With the instrument/asset search
- With the pinescript Quandl function (introduced in April 2020 via a TradingView blog post: tradingview.sweetlogin.com)
For quandl.com you'll need to create a FREE account to access their datasets.
To find the ticker IDs (ex: QUANDL:BCHAIN:HRATE), you can only find them on quandl.com for now
How can you access this dataset via TradingView?
For me, this has nothing to do with technical analysis here. It's more about fundamental (or blockchain health) analysis
This dashboard is a proof of concept - that we can include on TradingView a lot of Bitcoin blockchain metrics such as:
- USD Exchange Trade Volume
- Hash rate
- Bitcoin mining difficulty
- Miners revenue
- Cost per Bitcoin Transaction
- Number of unique addresses used
- Full list of available Blockchain metrics here
Split screen
To get this view, I only split my screen in 6
TradingView tutorial for doing so here
Best regards
Daveatt


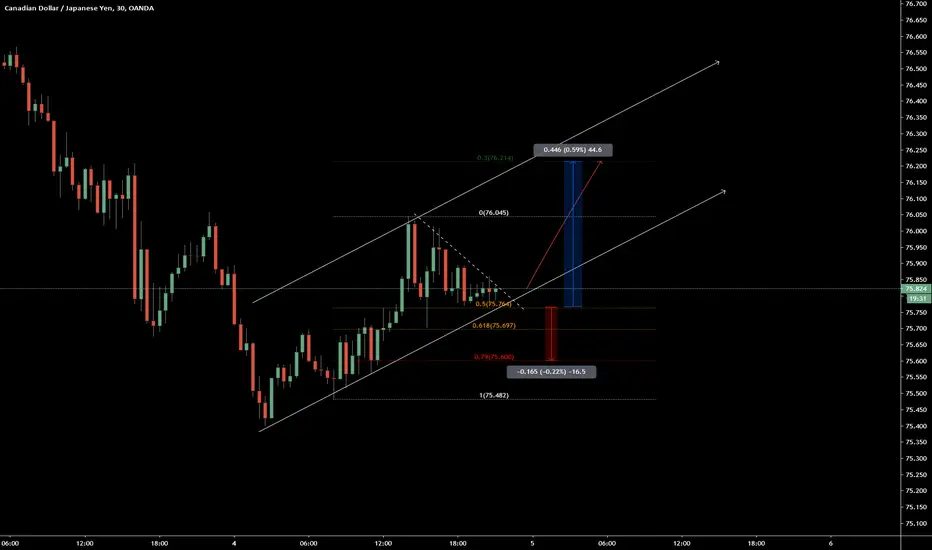

EURCADWatch carefully for this buy setup formed here, once it breaks the highs of the trendline it will then retest and long.
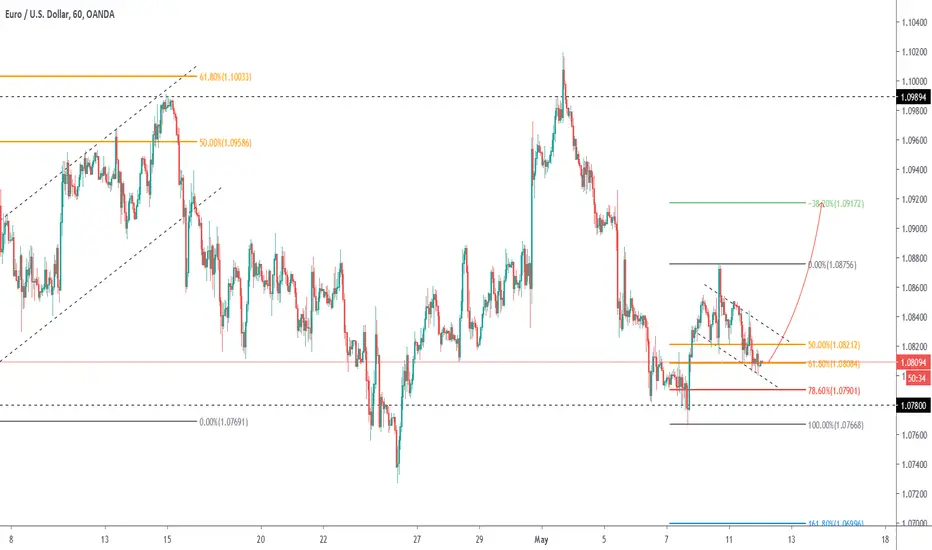
Get your Fibonacci tool to auto draw the zones you wantThis is how my fib tool look now - only showing the background color of the levels I want. Neat!
I used to draw the zones between 50% - just over 61,8% fib retracement using rectangles. I figured out a little hack to make the fib retracement tool do it for me automagically. Check out a tutorial here:

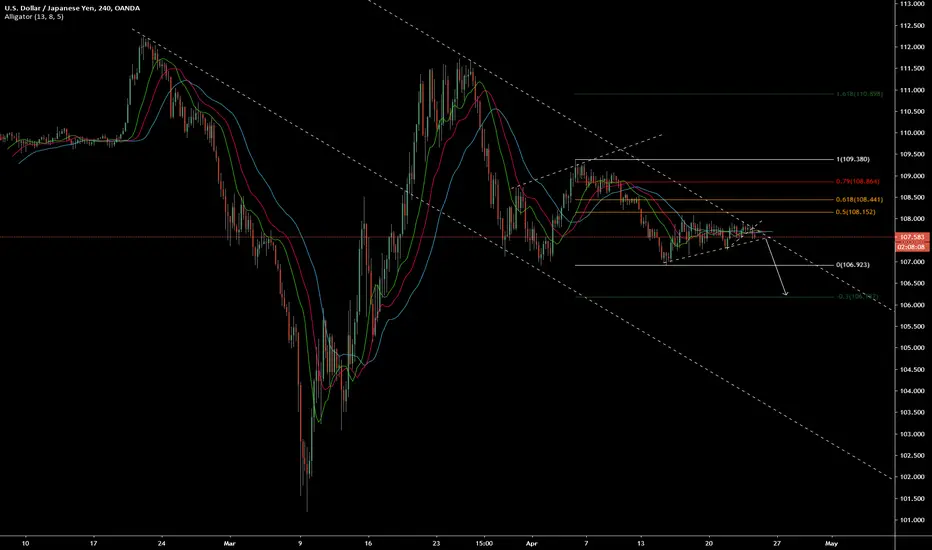
USDJPYFailing to retest to the 61.8 and Sleeping alligator indication of bears not showing interest in buying the Dollar.
How to Chart Futures Contracts and Crude Oil's Historic MoveCrude oil traded at -$40 per barrel and that is a historic move. It will go down in the history books.
In this video, we want to show everyone how to track and analyze futures on TradingView, specifically future contracts in crude oil CL1! and CL2!. On TradingView, it's possible to study any futures market and break that market down by each month. CL1!, for example, shows the current crude oil contract in front. CL2! shows the next contract in front. You can also dive into specific contracts that go as far as 2021 or 2022 or beyond.
This video tutorial is meant to be educational and we hope it helps anyone interested learn more about these markets. It's important to remember that most futures contracts trade based on an expiration date. Then, the contracts roll to the next month after that. As a platform, TradingView gives you the data and tools needed to analyze any of these contracts. The quickest way to getting started is to use the search bar to explore all the possible futures contracts that can be analyzed or visualized on a chart.
We hope this video tutorial helps the community get started. Please press like if you enjoyed it and, even better, please leave a comment to add to this discussion. Let's hear your opinion on futures market and the recent crash in crude oil.

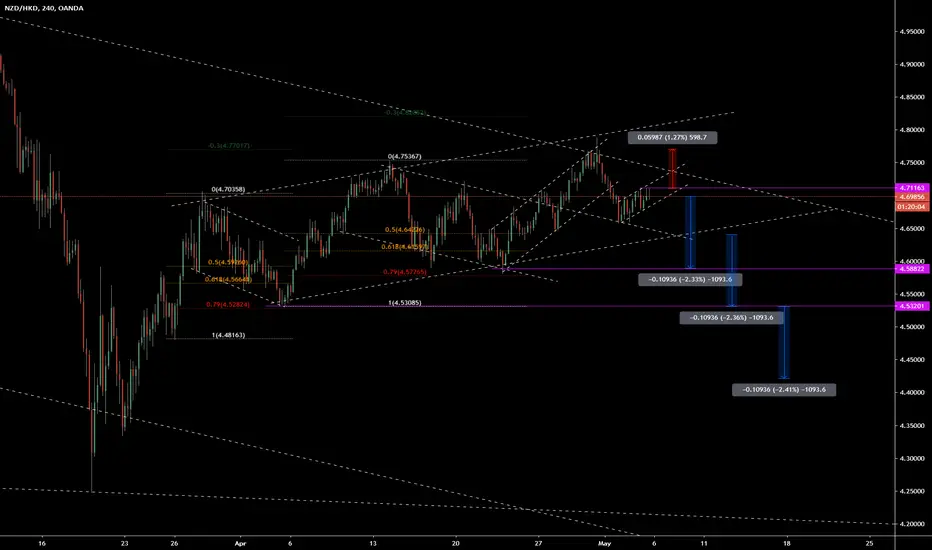
Correlation between assetsWhile trading price action and patterns on the charts can alone be quite profitable. However, in this post I hope to stress the importance at looking at more than one chart and understanding the correlation between assets.
There are many cases in which foreign exchange assets for example are heavily influenced by indexes and commodities. Some important examples of this includes:
- Gold and CHF + JPY (when gold goes up, CHF and JPY gain strength. This means that the USD pairs will be inversely correlated and experience opposite moves (confusing i know))
- Oil and CAD
- Shanghai index and oil
There are many other examples out there for correlated markets and so it'In this case it can often be important to not only look at the charts of both assets but also to watch out for news in both cases. By staying on top of these correlations and watching them closely you can gain a highly valuable edge over the markets.
