Candles vs Heiken Ashi (Average Bar) CandlesHeiken Ashi Candles is one tool to help with conviction for day and swing trades. These candles use averages to show strength and continuation of a trend. Using the $AMD chart as an example, the upward and downward trends are more obviously displayed than with the traditional candles, leaving less doubt on whether or not the trend is likely to continue.
Heiken Ashi can also be used on smaller time frames for day trades and scalping.
"Heikin-Ashi, also sometimes spelled Heiken-Ashi, means "average bar" in Japanese. The Heikin-Ashi technique can be used in conjunction with candlestick charts when trading securities to spot market trends and predict future prices. It's useful for making candlestick charts more readable and trends easier to analyze. For example, traders can use Heikin-Ashi charts to know when to stay in trades while a trend persists but get out when the trend pauses or reverses. Most profits are generated when markets are trending, so predicting trends correctly is necessary.
The Heikin-Ashi Formula
Normal candlestick charts are composed of a series of open-high-low-close (OHLC) candles set apart by a time series. The Heikin-Ashi technique shares some characteristics with standard candlestick charts but uses a modified formula of close-open-high-low (COHL)."
Investopedia.com
Trading Tools

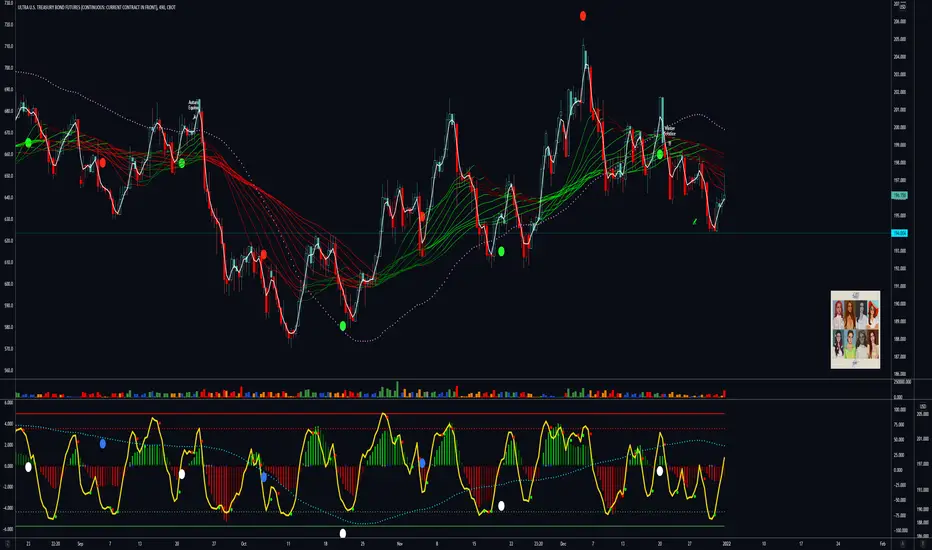
📚🎬💎#e08 : An Ultra Bond Future💍Married To The⛪💫An Education🎓
Series Continuation
Prior Episodes Found
In The Content Below
❔ What Are Bonds
Bonds Are The Foundation
Of A Debt Based Monetary
System
Bonds Define The Cost Of
Money Over Time
Put Simply Bonds Are
Future Dollars
Read That Again🔂
US Treasury Bonds Are
Future US Dollars Deliverable
At A Specified Time
In The Future I.e
30 Years Henceforth
By Purchasing A
US Treasury Bond
You Enter Into A
Legal Contract With
The Treasury Wherein
You Will Receive
The Principle Or
"Face Value" Of The
Bond Plus The Rate
Of Interest Specified
At The Time Of Purchase
❔ A Traders Role
To Make Money I Hear You Say
Well Yes Of Course
Money
But What Exactly As Bond Traders
Are We Getting Paid For ?
To Provide A Service
Our Collective Actions
Expressed Through The
Trading Of Bond Instruments
Determine The Cost Of Money
The Cost Of Money
Cost Of Money
Yes💡
Regardless Of Your Trading
Size We Are All Interacting
With The Free Market
Our Role :
To Correctly
Price The Value
Of Future Money
When We Trade Bonds
Profitably
We Win The Game
We Have Kept The
Flame🔥
We Have Served
A Most Important
Mission
We Fulfill A
Founders Vision💜
d-MR96nBa
nvrBrkagn
❔ Why Else Ultra Bonds
Low Operation Costs
Regardless Of Trade Size
Only Pay Spread Fee
As Futures Contracts
Zero Overnight Cost To Carry
Quarterly Rollover Spread Only
Operation Costs Will
Kill A Trader In Time
On Time
Every Time
Same As Any Business
Ventured
C4L
📔 Rules Of The Rodeo
Trend Is Dearest
Life-Long Friend
Bond Bull Market
40 Years Strong
So We Will
Mostly Trade Long
Positions Actively
Managed
Entry Orders Executed
At The Market
Trading 0.01 Unit
At A Time
Slow Drip💧
ℹ️ CME Group Official
Ultra Bond Trader Site
www.cmegroup.com
Keep Your Bond⚔️
Watch Your Loyalty⌚
Buy Freedom To🔥
0.96 % x Cost ♋
Behold.. The
Ultra Bond Future 🗽
☔
📚#e07🩸GG :
📚#e⏭️06 :
📚#e04 :
📚#e03 :
📚#e02 :
📚#e01 :
CBOT:UB1!
TVC:US30Y
Pluto 🛰️
Hndrxx 👩🏻🎤
TIME & PRICE CONCEPT - PTATiming is of great importance to any trader because you don't want to enter the market at the wrong time. Your setup might be correct and everything looks good but the time we pull the trigger matters.
Kindly like and comment for more educational contents.

HOW-TO: FibDev Indicator This tutorial is to explain our FibDev Indicator using AMD 15m chart example.
Overview of the daily zones:
-- Starting with red zones, these are our daily supply zones. We expect these zones provide resistance and act as potential pivot points for the price to reverse
-- The yellow zone is the neutral zone, when price is in this zone we expect that it will continue to chop around until it has chosen a direction for the day.
-- The green zones are demand zones. Similar to the supply zones, we expect these zones to provide support and act as possible pivots for the price to rebound
-- These zones are built based on previous daily price action and ** the zones will be the same on all time periods for any given day **
Overview of the intraday clouds:
-- The upper cloud (red outline) is where we expect to encounter an overbought condition, and that price may reverse down
-- The lower cloud (green outline) is where we expect to encounter an oversold condition, and that the price may rebound upwards
-- These clouds are built based upon ** the time period of the chart that is selected **. Thus the 5m clouds will be different than the 15m clouds.
Overview of the automated signals:
-- These signals are printed when we expect there is a chance of trend reversal. It should be noted that trading against the trend is very risky.
-- They do NOT serve as buy and sell signals, they are merely indications that price has entered a place of possible reversal.
Our thoughts on how to use this data:
--The main way we like to use this is by looking for scenarios where we have a wick or close that has broken above or below the intraday cloud at the same time that it is testing a supply or demand zone. Looking at this AMD example here, you can see a few scenarios where it wicked or closed into the lower cloud (some creating Bull signals) and was also testing a demand zone. This provides a layer of confluence as it's not only testing a daily demand zone but it's also testing the faster, intraday oversold zone (the lower cloud).
-- A secondary way to use this data is similar to the ORB strategy, where you essentially chase (or ride the momentum) the price once it has broken to the upside or downside of the yellow neutral zone. With this strategy, your potential profit zones would then become the supply or demand zones depending on which way the price moved.
Conclusion:
-- Ultimately it's up to you and how you choose to use this data and confluence it with other TA tools is completely up to you and your trading strategy.
-- For more information on using this indicator, please send us a message here or on Twitter (link found in our profile).
Thank you!
Great Blue Trading Team

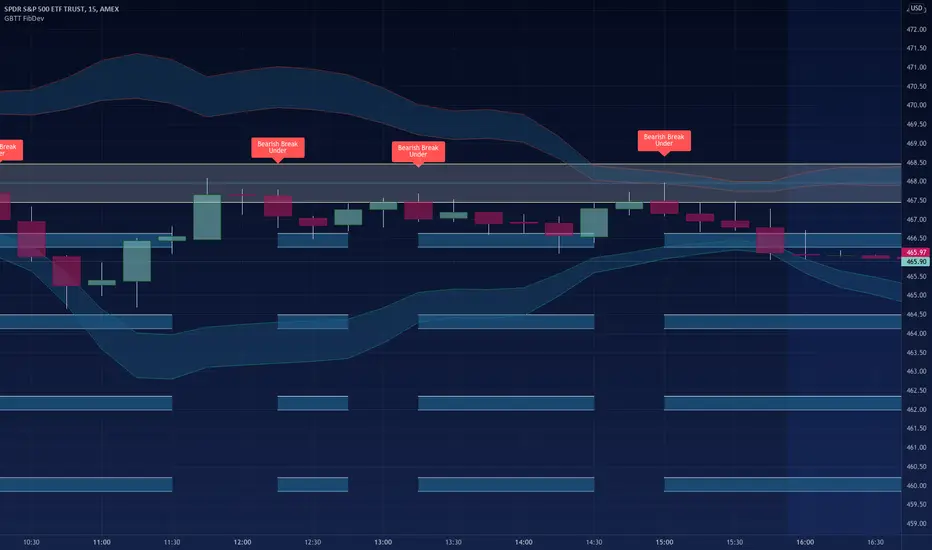
HOW-TO: FibDev Indicator and the Newest UpdatesWe previously published a HOW-TO on using this indicator, but since then the UI and the automated signals have changed noticeably. We STRONGLY recommend reading the first HOW-TO for this indicator as the core concepts are still the same (outside of the signals).
UI Updates:
We now hide the supply or demand zones if they aren't applicable to the current price action. If the price is in the neutral zone, there is no current target zone so both supply and demand are hidden. If price has broken out to the upside, we display the target supply zones at this time and vice versa for the downside, we display the demand zones. The way these zones are calculated is still the same, they are built using daily values and do not change through out the day (regardless of if/when they are displayed on the chart).
Automated Signals:
This is the biggest change, we are no longer generating automated signals based on possible reversal points of oversold and overbought price areas. This strategy can still be used, but there will be no signals created is all.
Instead, the signals are now generated when the price leaves the neutral zone and track momentum vs searching for trend reversals as before. When the price breaks through the neutral zone to the upside a Bullish Break Over signal is now printed implying that we see bullish momentum to the upside. The supply zones will display and now we are tracking the upside move with the indicator. The opposite for the downside break, Bearish Break Under signal and demand zones displayed for tracking the momentum to the downside.
Conclusion:
The indicator is now tracking momentum vs reversals, but using a combination of the Intraday Clouds and Neutral/Supply/Demand zones you can still use this for reversal setups.
Thank you!
Great Blue Trading Team
The Art of setting a Target ProfitHey, wizards!
Happy 2022 and welcome on the first Educational Post by Investroy for the new year. Today we are gonna be talking about different ways of setting a Target Profit (TP), and scrutinizing the benefits and drawbacks of each. Though there are many ways to set targets, as it varies depending on ones trading plan and strategy, here are 3 of the most popular ways of placing a TP.
1)Confluence based
Reading the chart and analyzing different timeframes of a certain security, we can use different confluences to spot potential zones of price reversals. On the graphical illustration demonstrated on the chart, we can observe that a rectangular range has been formed and the price is sitting at the lower boundary, in other words at the crucial zone of support. It is highly likely that traders will start going long on this setup and anticipate for the price to keep rising and reach the area of resistance. On the other hand, it is never 100% sure that the price will be able to bounce off the local zone of demand, and therefore risk management should be strictly followed.
2)Risk-to-Reward based (Fixed)
The other name of this method is “set and forget”. One group of traders prefers to follow same risk-to-reward ratios for all positions opened (For ex. 1:2 or 1:3 fixed). Another group favors setting different RR ratios for different trades and let the positions run until they hit TP. All in all, the technique implies setting a certain RR Target Profit and letting trades run. On the figure displayed on the screen, it can be inferred that the sentiment of the market is clearly bullish and the price is expected to keep rising. One of the disadvantages would be the following: sometimes due to greed, traders set their targets too high and the price results in not reaching the intended TP.
3)Intuition/Logic based
As strange as it may sound, there is actually a number of traders implementing this approach when setting a Target Profit. Moreover, it requires experience to sense where the market is about to move. As illustrated and interpreted on the graph, the market repeats historical actions from time to time. Experienced investors tend to notice some specific patterns and make decisions out of it.

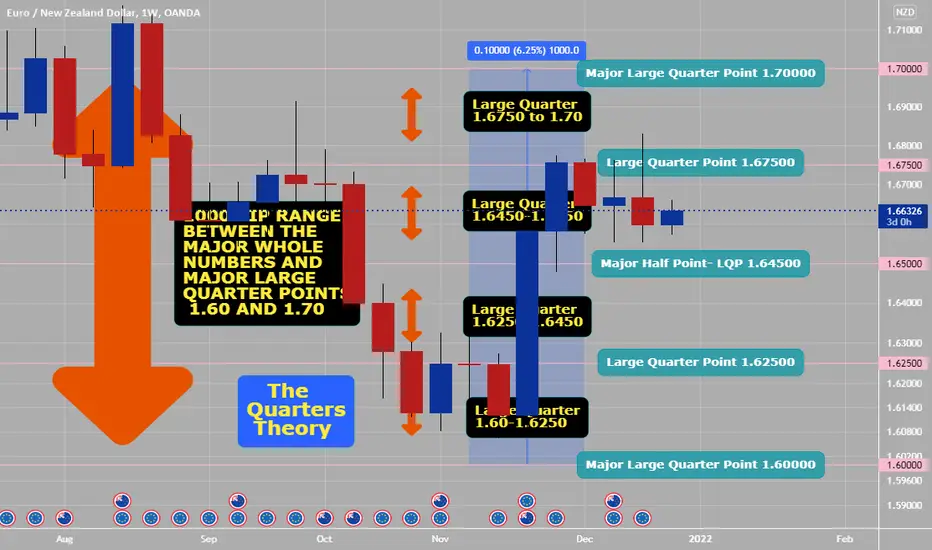
Quarters Theory 1000 pip range (Simplify Trading)Quarters Theory should be done on all trading charts and related to all types of Forex trading...
1000 PIP Range between the Major Whole Numbers 1.7000 and 1.6000 Divided into Four Equal Parts or Four Large Quarters of 250 Pips. Yes, this is for trading on daily charts or swing positions related using either daily or higher time frames but............just downsize your quarters into small sections of price action.
that is why for either day trading or scalping, you scale down these 1000 pip areas and 250 pip quarters to 100 pip areas and 25 pip quarters instead. If you keep trading Forex simply you will win more related less emotions and greed and using a more mechanical robotic system. This can be part of your edge.
If you google: The Quarters Theory PDF- download, save and read- free 227 page book by Ilian Yotov- you can be part of the 5% of winners in Forex, by just keeping trading simple.
Forex trading does not need to be complicated. Just price action, quarter lines, pivot points- especially if you day trade or scalp.
How to send Divergence signals to your Discord server- Do you have a Discord server set up for your own trading community?
- Do you use divergences as part of your trading strategy?
- Would you like to send automated notifications to your Discord server whenever a divergence appears on any chart?
If you have answered yes to all 3 questions above, please keep on reading.
The easiest way to receive automated Divergence alerts to your Discord server, is to combine the alert messages from "The Divergent" divergence indicator on TradingView with a Webhook endpoint on your Discord server.
Step 1: Open Discord, and go to Server Settings
Step 2: Go to Integrations and create a new Webhook
Step 3 (optional): Rename your Webhook to "The Divergent (Divergence indicator)"
Step 4: Select the channel you wish to receive the divergence signals to (i.e. #divergence-signals)
Step 5: Save your Webhook
Step 6: Copy your Webhook URL to your clipboard and head over to TradingView
Step 7: Apply "The Divergent" or "The Divergent (Pro)" indicator to your chart and configure it as you prefer (The free version of The Divergent can signal Regular Divergences only, while the Pro version can signal both Regular and Hidden Divergences)
Step 8: Create a new alert, select "The Divergent" from the top drop down and select one of the Divergence signals (i.e. Regular Bullish)
Step 9: Use the Webhook URL from your clipboard as the Webhook URL of the alert
Step 10: Use the following alert message:
{"content": "The Divergent detected a Regular Bearish Divergence (RSI) on {{exchange}}:{{ticker}} ({{interval}}) @TradingView #divergence $BTC "}
Sample message delivered on Discord:
"The Divergent detected a Regular Bearish Divergence (RSI) on BINANCE:BTCUSDT (60) @TradingView #divergence $BTC"
Feel free to change the content to match your chart / type of divergence you are signalling in the alert.
Note : It is important that you format your alert message as a JSON string, and that you key the message with "content". If you have never used JSON before, it is a good idea to validate your message via jsonlint.com to make sure it is a valid JSON string.
Repeat the same steps for other charts / divergences. Create as many alerts, as many markets / divergences you want to signal to your Discord server.
If you have any questions, please feel free to post it in the comments section below.
If this tutorial was helpful to you, please consider giving it a thumbs up!
Thank you!
How To Use The Trading View Parallel ChannelsHey wits, it's currently 1am and I thought why not drop some tutorials cos' it's Saturday. Most aren't familiar with the trading view tools. So, we're here to help.
Watch the clip to get started with the trading view parallel channels.
Leave a comment and smash the like button if you found this helpful.

🌊 ELLIOTT WAVES CHEAT SHEET 🌊10 Rules to 🏄♂️ them all! Hello, You may have never heard of Elliott Wave Theory before! Here is a cheat sheet for Elliott Waves for top 10 Rules, so you can master them all! print this out and keep on your desk.
How do you read Elliott waves?
The Elliott Wave Theory is interpreted as follows: Five waves move in the direction of the main trend, followed by three waves in a correction (totaling a 5-3 move). This 5-3 move then becomes two subdivisions of the next higher wave move (fractal).
The Elliott wave principle is a form of technical analysis that finance traders use to analyze financial market cycles and forecast market trends by identifying extremes in investor psychology, highs and lows in prices, and other collective factors. Ralph Nelson Elliott (1871–1948), a professional accountant, discovered the underlying social principles and developed the analytical tools in the 1930s. He proposed that market prices unfold in specific patterns, which practitioners today call Elliott waves , or simply waves. Elliott published his theory of market behavior in the book The Wave Principle in 1938, summarized it in a series of articles in Financial World magazine in 1939, and covered it most comprehensively in his final major work, Nature's Laws: The Secret of the Universe in 1946. Elliott stated that "because man is subject to rhythmical procedure, calculations having to do with his activities can be projected far into the future with a justification and certainty heretofore unattainable." The empirical validity of the Elliott wave principle remains the subject of debate.
OpenSea version in signature below

The easiest way to use divergences in your own Pine strategiesDetecting divergences in a Pine indicator / strategy is easy.
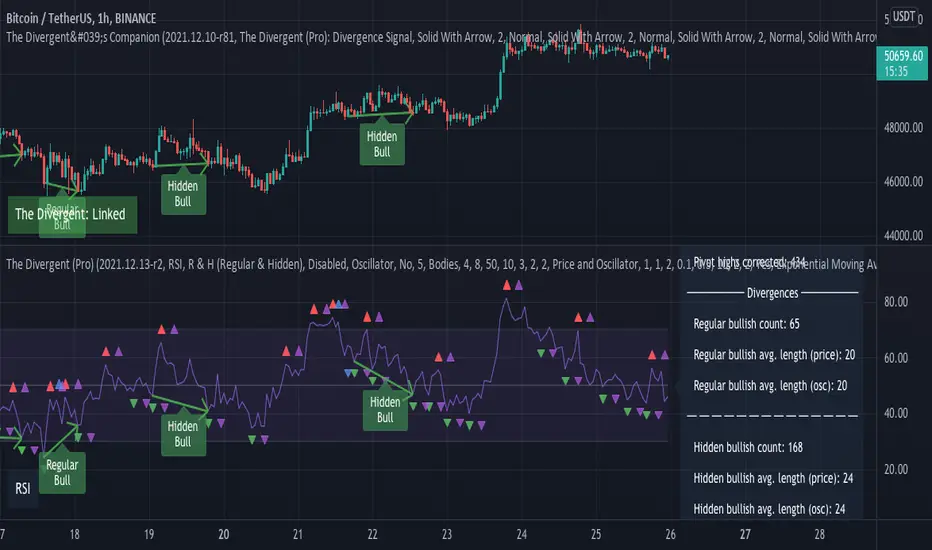
You simply have to compare the pivot lows and the pivot highs on the price and the oscillator, and if you can identify a difference between the last & previous pivots made on the price and the oscillator, you have likely found a divergence.
Using this theory, here is an example how you would detect a Regular Bearish divergence:
While the theory of divergence detection is simple, more often than not, things go wrong (the divergence indicator used in the example below is TradingView's built-in Divergence Indicator ):
Would you identify this as a divergence? If not, why not? Is it because the divergence line is slicing through the candles? Or because the line is slicing through the oscillator? Or something else?
Wouldn't it be great if somehow you could filter out invalid divergences from code, such as this one?
We at Whitebox Software were wondering about the same thing, and decided to find a solution to this problem. This is when we realised that while detecting divergences is easy, detecting valid divergences is hard...
After several months in development, we are proud to present to you our divergence indicator called The Divergent .
The Divergent is an advanced divergence indicator with over 2500 lines of Pine Script, exposing over 30 different configuration options, including 9 built-in oscillators, to allow you to tweak every aspect of divergence detection to perfection.
For example, the Line of Sight™ filter in The Divergent would have easily filtered out this invalid divergence above. The Line of Sight™ filter will notice any interruption to the divergence line connecting the price or the oscillator, and will treat the divergence as invalid.
This filter is one of many, which has been created to reduce the false positive detections to a minimum. (In later publications, we will discuss each and every filter in detail).
Alright, so The Divergent knows how to detect accurate divergences, but how is it going to help you detect divergences in your own Pine strategy?
The Divergent is not simply a divergence indicator - it can also emit divergence signals * which you can catch and process in your own strategy. You can think of The Divergent being a DaaS ( D ivergences a s a S ervice)!
* Please note, that divergence signals is a Pro only feature.
To use the signals, simply place The Divergent onto the same chart you have your strategy on, import "The Divergent Library" into your code, link your strategy to The Divergent using a "source" input, and act on the signals produced by The Divergent !
Here is a simple strategy which incorporates divergence signals produced by The Divergent in its entry condition. The strategy will only open a position, if the moving average cross is preceded by a regular bullish or bearish divergence (depending on the direction of the cross):
//@version=5
strategy("My Strategy with divergences", overlay=true, margin_long=100, margin_short=100)
import WhiteboxSoftware/TheDivergentLibrary/1 as tdl
float divSignal = input.source(title = "The Divergent Link", defval = close)
var bool tdlContext = tdl.init(divSignal, displayLinkStatus = true, debug = false)
// `divergence` can be one of the following values:
// na → No divergence was detected
// 1 → Regular Bull
// 2 → Regular Bull early
// 3 → Hidden Bull
// 4 → Hidden Bull early
// 5 → Regular Bear
// 6 → Regular Bear early
// 7 → Hidden Bear
// 8 → Hidden Bear early
//
// priceStart is the bar_index of the starting point of the divergence line drawn on price
// priceEnd is the bar_index of the ending point of the divergence line drawn on price
//
// oscStart is the bar_index of the starting point of the divergence line drawn on oscillator
// oscEnd is the bar_index of the ending point of the divergence line drawn on oscillator
= tdl.processSignal(divSignal)
bool regularBullSignalledRecently = ta.barssince(divergence == 1) < 10
bool regularBearSignalledRecently = ta.barssince(divergence == 5) < 10
float slowSma = ta_sma(close, 28)
float fastSma = ta_sma(close, 14)
longCondition = ta.crossover(fastSma, slowSma) and regularBullSignalledRecently
if (barstate.isconfirmed and longCondition and strategy.position_size == 0)
strategy.entry("Enter Long", strategy.long)
strategy.exit("Exit Long", "Enter Long", limit = close * 1.04, stop = close * 0.98)
shortCondition = ta.crossunder(fastSma, slowSma) and regularBearSignalledRecently
if (barstate.isconfirmed and shortCondition and strategy.position_size == 0)
strategy.entry("Enter Short", strategy.short)
strategy.exit("Exit Short", "Enter Short", limit = close * 0.96, stop = close * 1.02)
plot(slowSma, color = color.white)
plot(fastSma, color = color.orange)
One important thing to note, is that TradingView limits the number of "source" inputs you can use in an indicator / strategy to 1, so the source input linking your strategy and The Divergent is the only source input you can have in your strategy. There is a work around this limitation though. Simply convert the other source inputs to have a string type, and use a dropdown to provide the various sources:
string mySource = input.string("My source", defval = "close", options = )
float sourceValue = switch mySource
"close" => close
"open" => open
"high" => high
"low" => low
=> na
---
This is where we are going to wrap up this article.
We hope you will find the signals produced by The Divergent a useful addition in your own strategies!
For more info on the The Divergent (Free) and The Divergent (Pro) indicators please see the linked pages.
If you have any questions, don't hesitate to reach out to us either via our website or via the comment section below.
If you found value in this article please give it a thumbs up!
Thank you!

The dominance of stablecoins as a divergence tool in BTCOn the top chart we have the BTC/USD index, and on the bottom chart we have the sum of the dominance of the main stablescoins: USDT, USDC, DAI and UST.
As a rule, when the dominance of stablecoins rises, the price of BTC falls.
Just look at the respective numbered arrows. The only exception was arrow number 3, which had a more lateral movement in the dollar's dominance.
Now looking at this exact moment, we have a rise in stablecoin dominance.
The next resistance is at 7.75% (if dominance continues to rise).

THE ART OF MULTI-TIMEFRAME ANALYSIS AND MULTIPLE CONFLUENCESHey, wizards, hope you are all having a great week so far! We would like to welcome all of you on another educational post, the topic of which is Multi-Timeframe analysis and multiple confluneces involved.
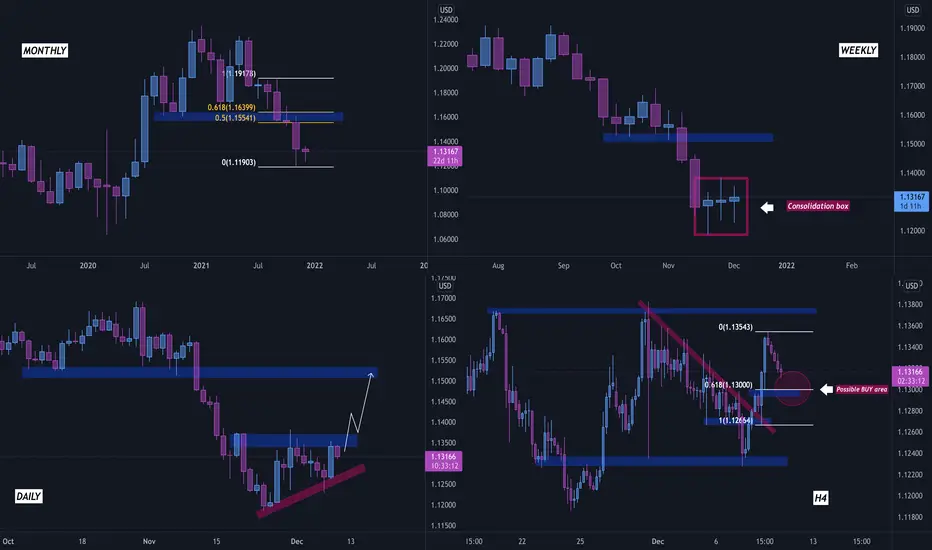
As it can be inferred, the Monthly and Weekly timeframes are used to determine the direction of the market, the Daily timeframe is used to identify key areas and important zones, and finally, the 4-hourly timeframe is utilized for entering trades. Now, let’s dig deeper into it and analyze the situation that we have on EUR/USD.
MONTHLY: Observing the weekly timeframe graph, we can say that the price has been printing bearish candles for a few consecutive weeks. As one of the main trading principles says, after a strong impulsive move, a correction is needed. We can witness some bearish weakening signs and therefore we are looking for a short-term long position. Our possible target would be set at a previous level of support turned resistance, which aligns with the golden Fibonacci zone.
WEEKLY: Leveling down to the weekly timeframe chart, we can see that the price is consolidating, as it is unable to push lower. Technically, after long lasting consolidations, it is believed that the price will either fly like a rocket or drop like a needle. This gives us another confluence and backs up our plan.
DAILY: Moving down to the daily timeframe graphic, we can notice that the previous candle was super bullish and some kind of an ascending triangle is being formed. If the price breaks and retests the upper boundary of the formed triangle, we can see some nice bullish moves.
4H: Last but not least, the 4-hourly timeframe a.k.a. the timeframe of entries. After a massive bullish push to the upside yesterday, the price has started correcting before further bullish moves happen. Here, we are using two entry confluences: the area of previously broken structure that nicely aligns with the 61.8% fibonacci retracement level. Before entering the trade, we will carefully monitor the price action and wait for the price to bounce off the local zone.
We are hoping that this educational post will be of value for you and we are wishing you all a great day!
Regards,
Investroy Team
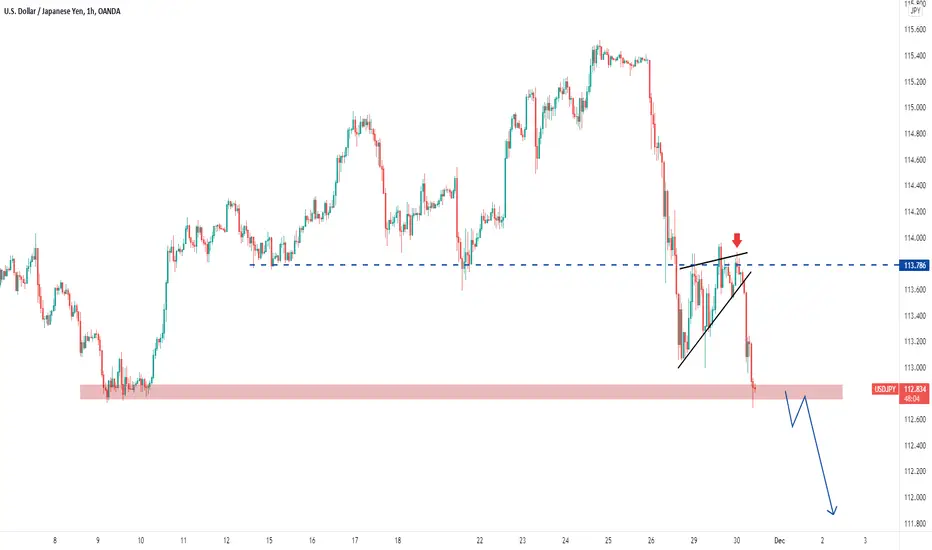
Study the Logic Behind Price Patterns, Not by Memorizing!Hi Traders, I won't be doing any particular market breakdown today as I don't see any great opportunity around. But here's some gems to share. In the previous few analysis, I've been talking about the potential failures on UJ everytime price attempt to break above 115. If you've not watched the previous UJ analysis OR in case if you couldn't find it, I'll link it down below for your convenience, make sure you watch it.
In my market breakdown videos, I often talk about continuation pattern. In yesterday's UJ breakdown, this was exactly what I was talking about, a continuation pattern. Price had a strong drive/ momentum into one direction (in this case bearish momentum), formed a tight consolidation giving us more information that sellers are attempting to squeeze price lower. This kind of flag-type pattern simply tells you how one side is bullying the opposition, eventually leads to further continuation into the initial direction.
For whatever instruments you're trading, it'd still fall back to Price Action. Understanding the psychology behind candlestick movement is what's going to make you profits, not by blindly memorizing strategies or patterns.
See you tomorrow for more breakdowns!
Trade safe and manage your risk!
Trading strategies, Part 1: First stepsWelcome to a series of videos called Trading Strategies. In the next couple of weeks, we'll talk about different strategies one can use to maximize gains: Market psychology, trading tools, trading styles, technical analysis.
Today, the first steps:
1- Defining who you are: Are you an investor or a trader
2- Educating yourself: Knowledge is the best tool someone can have on the market
3- You can't win all the time
4- Don't be greedy
Stay tuned for more content

How To Calculate Risk/Reward To Trade & Invest In Crypto MarketHi everyone:
Today I want to make this educational video on how to calculate your risk/reward in trading and investing in the cryptocurrency market.
Many newcomers in the industry are not aware of the importance of risk management. So today let's give out different examples of them on how to properly calculate the $, %, and setting the SL/TP.
This video is intended to help traders and investors to understand how to calculate the amount to risk per trade, or per investment purpose.
I will give different examples of going long and short in trading, as well as buying coins for the purpose of investment.
Doesn't matter what crypto broker exchange you use, this calculation/formula will work, you will just need to do some simple math to get to the right numbers.
Example 1:
Want to go long on BTC in a trade
Scenario:
Trading Account $12,000
Risk 1% of your trading account
Want to go long on BTC when price hits $70,000
You want the Stop Loss @$66,000,
and a TP @ $80,000
Calculation:
Calculate your 1% of the trading account:
$12,000 Account x 0.01 $120 per trade
Divide the $ you willing to risk to the SL amount
$120 / $4000 = 0.03
Set your entry order or market order
for 0.03 BTC @ $70,000 price
0.03 x $70,000 = $2,100
(This is the amount you will need in your trading account
to execute this position.
If you have leverage then its less $ needed)
Set your SL at $66,000
If price hits your SL, your order would be
0.03 BTC x $66,000 = $1,980
$2,100 - 1,980 = $120 = 1% of your account
Set your TP at $80,000
If price hits your TP, your order would be
0.03 BTC x $80,000 = $2,400
$2,400 - $2,100 = $300 = 2.5% of your account
Example 2:
Want to go long on ADA in a trade
Scenario:
Trading Account $800
Risk 1% of your trading account
Want to go long on ADA when price hits $2.30
You want the Stop Loss @1.70
Calculation:
Calculate your 1% of the trading account:
$800 Account x 0.01 = $8 per trade
Divide the $ you willing to risk to the SL
$8 / $0.60 = 13.34
Set your entry order or market order
for 13.34 ADA @ 2.30 price
13.34 x 2.30 = $30.68
(This is the amount you will need in your trading account
to execute this position.
If you have leverage then its less $ needed)
Set your SL at $1.70
If price hits your SL, your order would be
13.34 ADA x $1.70 = $22.68
$30.68 - $22.68 = $8 = 1% of your account
Set your TP at $4.00
If price hits your TP, your order would be
13.34 ADA x $4.00 = $53.36
$53.36 - $30.68 = $22.68 = 2.83% of your account
Example 3:
Want to go short on TRX in a trade
Scenario:
Trading Account $54,000
Risk 1.5% of your trading account
Want to go short on TRX when price hits $0.11
You want the Stop Loss @ $0.13
Calculation:
Calculate your 1.5% of the trading account:
$54,000 Account x 0.0150 = $810 per trade
Divide the $ you willing to risk to the SL
$810 / $0.02 = 40,500
Set your entry order or market order
for 40,500 TRX @ 0.11 price
40,500 x 0.11 = $4,455
(This is the amount you will need in your trading account
to execute this position.
If you have leverage then its less $ needed)
Set your SL at $0.13
If price hits your SL, your order would be
40,500 TRX x $0.13 = 5,265
$5265 - $4455 = $810 = 1.5% of your account
Set your TP at $0.07
If price hits your TP, your order would be
40,500 TRX x $0.07 = $2,835
$4,455 - $2,835 = $1,620 = 2% of your account
Example 4:
Want to buy ETH to hold for long term as investment
Scenario:
Investing Account $20,000
Risk 10% of your investing account
Want to buy ETH to hold for long terms
Want to enter when price hits $4,900
Calculation:
Calculate your 10% of the investing account:
$20,000 Account x 0.10 = $2,000 per investment
Divide the $ you willing to risk to the price you want to enter
$2,000 / $4,900 = 0.4082
Set your entry order or market order
for 0.4082 ETH @ $4,900 price
0.4082 x $4,900 = $2000
(This is the amount you will need in your investing account
to execute this buy.)
You want to lose no more than 25% of your original $2,000 investment.
$2,000 x 0.75 = $1,500
$1,500 / 0.4082 = $3,674.67
Set your alert and SL at $3,674.67
If price hits your alert/SL, your order would be
0.4082 ETH x $3,674.679 = $1500
$2,000 - $1500 = $500 = 25% of $2,000
You want to gain about 50% of your original investment before selling.
$2,000 x 1.50 = $3,000
$3,000 / 0.4082 = $7,349.34
Set your alert and TP at $7,349.34
If price hits your TP, your order would be
0.4082 ETH x $7,349.34 = 3,000.00
$3,000 - $2,000 = $1,000 = 50% of $2,000
Example 5:
Want to buy MATIC to hold for long term as investment
Scenario:
Investing Account $1,500
Risk 20% of your investing account
Want to buy MATIC to hold for long terms
Want to enter when price hits $2.25
Calculation:
Calculate your 20% of the investing account:
$1,500 Account x 0.20 = $300 per investment
Divide the $ you willing to risk to the price you want to enter
$300 / $2.25 = 133.34 MATIC
Set your entry order or market order
for 133.34 MATIC @ $2.25 price
133.34 x $2.25 = $300
(This is the amount you will need in your investing account
to execute this buy.)
You want to lose no more than 50% of your original $300 investment.
$300 x 0.50 = $150
$150 / 133.34 = $1.1249
Set your alert and SL at $1.1249
If price hits your alert/SL, your order would be
133.34 MATIC x $1.1249 = $149.99
$300 - $149.99 = $150.01 = 50% of $300
You want to gain about 75% of your original investment before selling.
$300 x 1.75 = $525
$525/133.34 = $3.9373
Set your alert and TP at $3.9373
If price hits your TP, your order would be
133.34 MATIC x $3.9373 = $525
525 - $300 = $225 = 75% of $300
Any questions, comments and feedback welcome to let me know.
If you like more of these contents, like, subscribe/follow and comment for me to keep doing them. :)
Jojo

Why Do You Need a Trading Journal? 📝
Hey traders,
📖 Trading Journal is a crucial element in your trading education.
Even though the majority tends to neglect it, in fact, it is considered to be the essential part of a daily routine of a professional trader.
In this post, we will discuss why you should keep a trading journal & how it enhances your trading performance.
Let's start with the obvious:
✍️ Trading journal is applied for recording your trading positions:
winning and losing ones.
With that, you can monitor your current performance, identify the mistakes that were made and examine your decisions.
❌ Analyzing the errors you learn your weaknesses & the situations when it is preferable not to trade. You adjust your trading strategy accordingly in order to avoid similar mistakes in future.
💪 Examining the winning trades you learn about your strengths.
You identify the trading instruments, the trading setups where your strategy reaches the highest accuracy.
⚖️ Working with the numbers you can measure your investing exposure and calculate your account drawdowns. You can analyze your losing streaks & your long-term/mid-term/short-term account statistics.
📈 Analyzing the figures you can measure your progress over time by comparing your current results with the old ones.
😡 Keeping the record of your emotions, you can measure & quantify the psychological element of your trading. You may calculate the percentage of emotional decisions being made and their effect.
🌟 Consistent journaling makes you disciplined. It teaches you to strictly follow the rules of your trading plan & constantly learn from your mistakes in order to hasten the path towards a more disciplined and profitable trading career.
A trading journal should be simple and tailored to your specific trading style and the goals you would like to achieve.
I hope that my words will inspire you to keep a trading journal!
Do you have the one already?
❤️Please, support this idea with like and comment!❤️

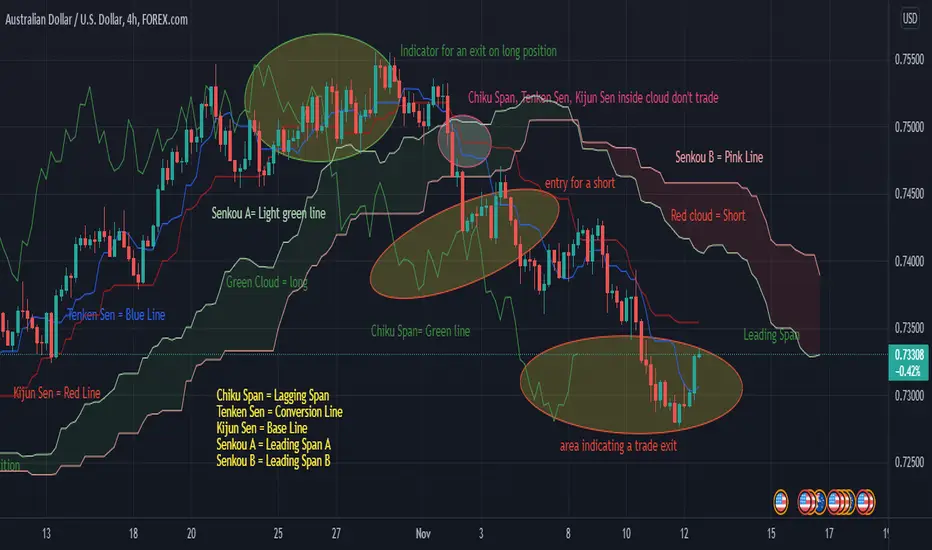
Ichimoku StrategyI have been asked how to use the Ichimoku Strategy so here is a quick breakdown on how the cloud works. Included is a picture Displaying the different aspects of what o look for and the terminology used. I am also including a few links to two youtube videos and websites/articles I have used to better understand this strategy. I have only been using this strategy for about two months so I am by no means a master of it. Also, don't forget to use indicators for strength and to use technical analysis to decide on a trade path. While the cloud works great, trades can be missed due to the following rules. A general rule of thumb, don't take a trade unless your trading with the trend as well as at a good entry as defined further along in this discussion.
A few things to remember, never trade if the Chiku Span, Tenken Sen and/or Kijun Sen are inside the cloud. If one of these lines has not crossed over for your trade setup, long or short, don't enter wait until all three pass through the cloud.
The indicator as to whether you want to short or long is determined by Senkou A. If Senkou A is above Senkou B, a green cloud, a long position is most desirable, if Senkou A is below Senkou B, a red cloud, a short position is most desirable.
Pay attention to Tenken Sen and Kijun Sen as they can help determine a desirable entry vs a non desirable entry. If Tenkan Sen is above Kijun Sen, look for long position. If Tenkan Sen is below Kijun Sen a short would be more favorable. Another aspect to keep in mind for entering a trade if it is passed through the cloud and the original entrance was missed is waiting for Tenken Sen to cross below Kijun Sen and to then start to cross over for a long position. For a short, wait for it to cross above and then cross back over and dip below. sometimes a trade can be favorable when Tenken Sen and Kijun Sen almost meet then diverge apart continuing in the same direction.
Chiku Span is useful in seeing the action of the trade. It shows what is occuring in a clearer fashion than studying the chart solely. If Chiku Span starts to move sideways and catches up to the candles, Tenken Sen and Kijun Sen then it might be a good time to look at closing a trade.
These are a few resources I have used to help better understand the cloud.
www.investopedia.com
www.fidelity.com
www.youtube.com
www.youtube.com
Tips For Securing Your TradingView ProfileSecurity and privacy are incredibly important to us. We have an entire team dedicated to it! We want all members to be absolutely confident that they have the tools they need to ensure their accounts are secure, safe, and protected. Let's get started.
The Obvious Tips
Don't use the same password everywhere or else one breach could expose all accounts. Make sure your passwords are unique and not easy to guess. Make sure to use strong passwords and special characters like @ # ! / < ? % when possible.
Don't fall for scams! Always double and triple check links that you click. Don't give out your log in credentials to anyone. One helpful tip is to make sure you have the official tradingview.sweetlogin.com homepage bookmarked on your browser. You'll also want to ensure you have the TradingView mobile apps on iOS or Android. Don't download imitators! Only use the official TradingView.com platform and apps.
The Tools Available To You
All TradingView members have access to individual security features within their Profile Settings . Head to your Profile Settings page to get started. Once you've made it to your Profile Settings, click the Privacy and Security tab . From here you can manage the full security of your account including several unique features:
• Enable Two-Factor Authentication
• Review linked social accounts
• Check sessions and logged in history
• Log out of individual devices
• Log out of all devices
• Disable/Enable chat
• Ignore users
• Complete control of your profile, how it looks and the information shown
For those interested in managing their individual trader Profile , we have tools that let you quickly change your profile picture, connected social media accounts, about & bio, location, and an entire notification suite for on platform notifications and email notifications.
Bonus Tips!
Two factor authentication is a must-have for those interested in the ultimate level of security. It means you can use a second device, like your phone, or an authentication app to confirm every log in.
If you're looking to learn more about all of the security features available to you, check out our Help Center. For example, this post explains more common tips to securing your account ! There's even more within our Help Center , which is free for everyone to learn more about markets and TradingView.
Thanks for reading!
- Team TradingView
The Daily TimeframeI am commonly asked what is the most important time frame to analyse your pairs on. Which doesn't always result in a simple answer since multiple time frames must be taken into consideration for successful trading e.g. weekly/daily/4h/1h.
However, there is the one that is universally considered to be principal and that is the daily time frame. Here are some of the main reasons why so many traders rely on a daily time frame and why you should to:
1️⃣ - Daily time frame shows a global market trend at the same time reflecting a mid-term and short-term perspective allowing the trader catch trend following moves and spot early reversal signs. The simple nature of one candle closure per day keeps things a lot more simple compared to lower timeframes.
2️⃣ - Covering multiple perspectives, the daily time frame is the foundation of the majority of the trading strategies and is the main source of key levels & pattern analysis.
3️⃣ - Filters out news events that happened during the trading day. It shows the composite reaction of the market participants to all the data posted in the economic calendar.
4️⃣ - Daily time frame reflects all trading sessions. Within one single candle, we see the outcome of the Asian, London, and New York Sessions.
5️⃣ - Daily candle filters out all the noise from lower time frames & intraday price fluctuations and sudden spikes & rejections.
6️⃣ - Similar to covering all the trading sessions, daily time frame also mirrors the activities of big players like hedge funds and banks. Showing us the flow & direction of big money.
⚠️ Please note: Despite the daily timeframe being so important for analysis, still do not neglect other time frames. The most accurate trading decision can be made only relying on a combination of intraday and daily time frames.

3 Types of Traders: Which Are You?3 Types of Traders: Which Are you?
There are many different approaches of trading the financial markets that has provoked countless methods and strategies to be created over the decades.
One popular way to simplify & view this is to break it down into 3 types of traders which is categorised by two main factors which include the trading frequency & timeframes used by each one of the trading types.
1️⃣ Scalper
The large majority of beginner traders end up starting out with this type of trading because of numerous reasons. But mainly, this is due to the fast pace that the market moves, presenting many trading opportunities and giving off the perception of an opportunity to get rich quick.
Ironically, this trading style is then considered as one of the most easiest and successful ways of trading by beginner traders, while being stated by professional traders to be one of the most difficult.
Scalpers often have dozens of trading positions open at a time during multiple trading sessions and need to be in front of the charts at all times. Therefore, paying huge commissions to their broker due to spreads also making this type of trading have a high cost to it. Not to mention the chaos in lower timeframe analysis that eventually results in the majority to stop trading.
This is not to say that you cannot be successful with scalping. However, the main obstacle alongside many other with scalping, is the level of constant focus & rapid-decision making required which can have massive negative effects on your overall trading psychology if not kept in check.
2️⃣ Intraday
Intraday or day trading is the most popular type of trading amongst retail traders and is what I prefer the most myself.
Staying relatively active, the market gives some time for the trader to reflect & think upon their analysis on the pairs they are analysing. Opening and managing on average ~1-2 positions per trading session, the intraday approach offers a degree of freedom.
But does come at a cost due to the declining amount of volume and volatility, intraday traders may experience low risk:reward setups because of the average daily range of many pairs on the market.
3️⃣ Swing
Swing trading is the best choice for individuals who want to pursue trading while having a full-time occupation outside of trading. This is possible due to this type of trading primarily focusing on the higher timeframes such as daily/weekly for a large proportion of their analysis.
Thus, swing trading is not demanding when being combined with an individuals typical daily routine and trading psychology since they aim to catch mid/long-term market movements.
With an average trade holding length of 2 weeks and only 1-2 positions being placed per week. Swing trading is regarded to be one of the least emotional approaches and involves low cost of trading with great risk:reward setups.
Though, the main problem with swing trading is the degree of patience required when holding out for long period of times. Often resulting in the trader closing their positions too early and not having the ability to allow the positions to reach their final targets.
Which type of trading do you prefer?

Quality And Location Spreads Provide Fundamental CluesMy introduction to commodity markets came in the 1970s when I was invited to work for the summer for the world’s leading commodity merchant company. In the 1970s, Philipp Brothers’ headquarters were in the heart of New York City. The company had offices all over the world. Where it did not have an office, it had a network of agents. Philipp Brothers bought commodities from producers and provided financing for raw materials production and sold to consumers. In an era of rising inflation in the late 1970s, the company was so profitable that it bought the leading Wall Street, privately held bond trading and investment banking firm, Salomon Brothers.
My first job was delivering telex messages to trading and traffic departments. Traders were the kings, earning millions in profits. The traffic department arranged the logistics of moving raw materials around the globe from production points to consuming locations. The telex messages contained information about proposed transactions and completed ones. I read each one with great interest. Those messages turned out to be an invaluable education in the business.
The high school job turned into a lifelong career. The excitement of markets and the global nature of the commodities business was a powerful force that caused me to forgo law school for a career as a commodity trader.
Market structure- We looked at processing spreads and term structure
Location-location-location is the real estate mantra- It applies to commodities too
Different qualities command premiums or discounts
Another part of market structure that can provide valuable clues and makes the pieces of the puzzle form a picture
I view the commodity markets as a jigsaw puzzle with many moving pieces. Each market has idiosyncratic characteristics. Quality and location are parts of each market’s structure and can provide insight into the path of least resistance of prices.
Market structure- We looked at processing spreads and term structure
Over the past two weeks, I highlighted processing spreads and term structure, two critical puzzle pieces. In the future, I will cover substitution spreads and the essential technical factors that held uncover a picture of the path of least resistance for prices.
Processing spreads tell us about the demand for one commodity that is a product of another. Crude oil crack spreads and soybean crush spreads were examples.
Term structure tells us about the supply-demand balance as backwardation where deferred prices are lower than nearby prices for the same commodity indicates supply shortages or concerns. Contango, where deferred prices are higher, suggests plenty of nearby supplies to satisfy demand or a market is in equilibrium with supply and demand balanced.
This week, we will look at location and quality spreads covering the same commodity’s regional dynamics and different compositions. These spreads shed light on areas of the world where a commodity may trade at a significant differential or where other forms or variations of the same commodity are at premiums or discounts, which could signal price changes.
Location-location-location is the real estate mantra- It applies to commodities too
A location spread reflects the price of the same commodity for delivery in one location or area versus another. The most recent example of substantial location differentials has been in the natural gas market.
The natural gas futures contract on the CME’s NYMEX division reflects the price of the energy commodity for delivery at the Henry Hub in Erath, Louisiana.
The chart shows that in October 2021, the futures reached the highest price since February 2014 when they traded to a high of $6.466 per MMBtu, only 2.7 cents below the 2014 $6.493 high.
Meanwhile, shortages of natural gas in Asia and Europe pushed the energy commodity price over five times higher than the NYMEX futures price. Since natural gas in liquid form travels the world via ocean vessels, the high prices in Asia and Europe have a bullish impact on US prices.
Meanwhile, prices in the US can vary dramatically from the NYMEX Henry Hub price, which is a benchmark. Following the price action in natural gas swaps between one US region and others can provide clues about the energy commodity’s price path.
Commodity production tends to be localized in areas of the world where the earth’s crust contains reserves or the soil and climate support crop growth. Consumption is widespread as people worldwide require essential staples. When local shortages occur, prices can rise to substantial premiums to benchmarks. In glut conditions, they can fall to significant discounts. Monitoring these location differentials in all commodities provides valuable information about supply and demand characteristics.
Different qualities command premiums or discounts
A quality spread is the price differential between one form or composition of a commodity and another in the same raw material. An example is the price differential for one hundred-ounce bars of gold and four hundred-ounce bars of gold. Each COMEX contract calls for 100 ounces of the precious metal, the US standard of trade. The London gold market is a far more active wholesale market, where the standard of trade calls for the four hundred-ounce bars. Price differentials reflect the price and time to process one form of gold into the other. Significant premiums or discounts of either size bars, or different sizes such as kilos bars, one-ounce bars, or others, can tell us about retail or wholesale gold demand.
When we drink a cup of coffee, we rarely think of the origin of the beans that are ground into the caffeinated beverage. Arabica coffee beans trade in the futures market on the Intercontinental Exchange. The Arabica beans tend to be most popular in the US. Starbucks, Dunkin Donuts, and most US establishments offer Arabica coffee to consumers. Brazil is the world’s leading producer of Arabica beans.
Meanwhile, Vietnam is the leading product of Robusta coffee, which is the beans required for espresso coffees. Robusta coffee futures trade on the Intercontinental Exchange in Europe. A weather event in Vietnam or Brazil can cause supply issues for Arabica or Robusta beans, leading to a price change in one or both variations of the soft commodity.
There are many other examples of quality spreads where one form or size of a commodity can experience supply or demand changes that impact the overall price action in the raw materials.
Another part of market structure that can provide valuable clues and makes the pieces of the puzzle form a picture
Location and quality factors can reveal underlying fundamental trends in a commodity. Comparing current levels to historical ones and explaining the changes often leads to an improved understanding of previous price trends and can help predict the future path of least resistance of prices.
Location and quality differentials are parts of a market’s overall structure. Combined with the other structural factors, they can uncover opportunities that improve the odds of success.
---
Use the links below to sign up for the Monday Night Strategy Call this week. You can also access the full article for free using the other link below.
Trading advice given in this communication, if any, is based on information taken from trades and statistical services and other sources that we believe are reliable. The author does not guarantee that such information is accurate or complete and it should not be relied upon as such. Trading advice reflects the author’s good faith judgment at a specific time and is subject to change without notice. There is no guarantee that the advice the author provides will result in profitable trades. There is risk of loss in all futures and options trading. Any investment involves substantial risks, including, but not limited to, pricing volatility, inadequate liquidity, and the potential complete loss of principal. This article does not in any way constitute an offer or solicitation of an offer to buy or sell any investment, security, or commodity discussed herein, or any security in any jurisdiction in which such an offer would be unlawful under the securities laws of such jurisdiction.

Term Structure Provides Fundamental CluesLast week, I wrote on processing spreads, a valuable tool that can provide clues about price direction. The price action in products that trade in the futures market like gasoline, heating oil, soybean meal, and soybean oil often tell us a lot about the path of least resistance for the crude oil and soybean futures contracts.
This week, I will turn my attention to term structure. Term structure is the price differential between one delivery period and another in the same commodity. Some traders call term structure time spreads, calendar spreads, front-to-back spreads, or switches. They are all the same, reflecting delivery or settlement premiums or discounts based only on time.
Backwardation- It’s what it sounds like
Contango- It’s not what it sounds like
A real-time supply and demand indicator
Commodities are unique- A mentor made a mint trading time spreads
Time spreads can enhance your commodity trading results- The cure for low and high commodity prices
The late Apple founder Steve Jobs once said, “My favorite things in life don’t cost any money. It’s really clear that the most precious resource we all have is time.” While Steve Jobs was referring to his mortality, time is a critical factor in commodities.
Close attention to term structure unlocks clues about fundamental supply and demand factors.
Backwardation- It’s what it sounds like
Backwardation is a condition where commodity prices for deferred delivery are lower than for nearby delivery. A backwardation suggests that supplies are tight, forcing nearby prices higher. The condition also indicates that producers will increase output in response to a market’s deficit, leading to lower future markets.
As of the end of last week, the NYMEX crude oil futures market was in backwardation.
The chart of NYMEX WTI crude oil for delivery in December 2022 minus the price for delivery in December 2021 was trading at over a $12 per barrel backwardation or discount. December 2021 futures settled at the $83.57 level on October 29, with the December 2022 futures at the $71.33 level. Robust demand, supply concerns, and other factors have driven the spread into the widest backwardation in years and NYMEX crude oil to the highest price since 2014. Higher crude oil prices tend to support a wider backwardation. Historically, the Middle East’s political volatility has caused supply concerns at higher prices as the region is home to over half the world’s petroleum reserves.
Crude oil is one example of a raw material market where the term structure reflects supply concerns. The trend towards a wider backwardation has been bullish for the energy commodity.
Contango- It’s not what it sounds like
While backwardation is a term that reflects the spread differentials, contango is another story. In the commodities lingo world, contango is backwardation’s opposite as it reflects a market where prices for deferred delivery are higher than for nearby delivery. Backwardation is a sign of supply concerns, whereas contango is present during periods of oversupply or equilibrium where supply and demand balance. The gold futures market is an example of a term structure in contango.
The daily chart highlights gold for delivery in December 2022 minus December 2021 is trading at a $10.30 contango or premium at the end of last week. The December 2021 futures were at the $1783.90 level, with the December 2022 contract at the $1794.20 level.
Central banks worldwide hold massive gold stocks as part of their foreign exchange reserves. Therefore, supply concerns tend to be low in the gold markets leading to a premium in its term structure. Moreover, gold has a long history as a means of exchange or money. Higher interest rates tend to push gold contangos higher.
Gold is one example of a commodity market in contango.
A real-time supply and demand indicator
A commodity’s term structure can be a helpful tool as it provides insight into supply and demand fundamentals. When a raw material price spikes higher because demand rises or supplies decline, the term structure tends to move into a widening backwardation. Producers respond by increasing output, creating the deferred discount.
When markets are in glut or oversupply conditions, producers often cut back on output, causing the chances for future deficits to develop. Thus, a steep contango can reflect the market’s perception that nearby oversupply will lead to eventual shortages.
Term structure is one of the puzzle pieces that comprise a market’s structure. The others are processing spreads, location and quality spreads, and substitution spreads.
Commodities are unique- A mentor made a mint trading time spreads
Commodities are essentials. Agricultural commodities feed and clothe the world and are increasingly providing alternative energy. Industrial commodities, including metals, energy, and minerals, are requirements for shelter, power, and infrastructure. Other raw materials have varying applications in daily life and even the financial system.
Shortages or gluts can have significant impacts on the global economy. The current inflationary pressures have roots in commodities, which had experienced price rises since the beginning of the worldwide pandemic when short-term lows gave way to bullish price action.
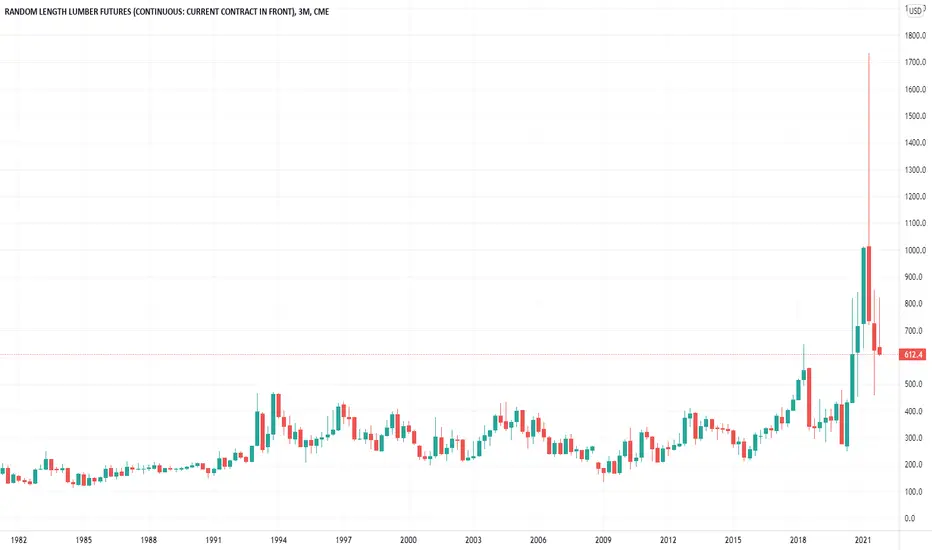
Supply chain bottlenecks and slowdowns or shutdowns at mines and processing facilities have put upward pressure on prices. Perhaps the most dramatic example came in the lumber futures market.
The quarterly lumber futures chart shows the price explosion to a record $1711.20 high in May 2021 on the back of slowdowns and shutdown at lumber mills and supply chain bottlenecks bringing wood to consumers during a period of rising demand. When lumber reached its May high, nearby January futures were far lower.
The chart shows January futures peaked at $1275 per 1,000 board feet, over $435 lower than the nearby contract at the May high.
When I worked at Phibro in the 1990s, my direct boss was Andy Hall, one of the most successful crude oil traders in history. While many market participants believe Mr. Hall churned out profits with long and short positions in the oil market, his greatest success came from what he called “structural risk positions.” He tended to buy the front months in the oil market and sell the deferred contracts when the market moved into contango. I remember the night when Saddam Hussein marched into Kuwait in 1990. The invasion caused the nearby price of crude oil to double in a matter of minutes.
Meanwhile, deferred oil prices declined, sending the spread to a massive backwardation. Mr. Hall pocketed hundreds of millions in profits on that night. His theory was that the risk of contango was limited over time, and the potential for spikes in backwardation increased the odds of success.
Time spreads can enhance your commodity trading results- The cure for low and high commodity prices
Commodity prices tend to rise to prices where producers increase output, consumers look for substitutes or limit buying, causing inventories to build. As supply rise to levels above demand, price find tops and reverse.
Conversely, prices tend to drop to levels where production becomes uneconomic. At low prices, consumers look to increase buying, and inventories decline, leading to price bottoms and upside reversals. The cure for high or low prices is those high or low prices in the world of commodities.
Meanwhile, highs or lows can be moving targets. As we learned in lumber and a host of other markets over the years, highs occur at levels that most analysts believe are illogical, irrational, and unreasonable. We learned the same holds on the downside as nearby NYMEX crude oil futures fell to a low of negative $40.32 per barrel in April 2020.
Time spreads can be real-time indicators of changes in a commodity’s supply and demand fundamentals. Understanding and monitoring term structure can only enhance the odds of success in the commodities asset class.
---
Register for the Monday Night Call below. You can also sign up to see the full articles for free, and get early access, using the other link below.
Trading advice given in this communication, if any, is based on information taken from trades and statistical services and other sources that we believe are reliable. The author does not guarantee that such information is accurate or complete and it should not be relied upon as such. Trading advice reflects the author’s good faith judgment at a specific time and is subject to change without notice. There is no guarantee that the advice the author provides will result in profitable trades. There is risk of loss in all futures and options trading. Any investment involves substantial risks, including, but not limited to, pricing volatility, inadequate liquidity, and the potential complete loss of principal. This article does not in any way constitute an offer or solicitation of an offer to buy or sell any investment, security, or commodity discussed herein, or any security in any jurisdiction in which such an offer would be unlawful under the securities laws of such jurisdiction.