Who wants to trade like this now markets are back open ❓💲Hello fellow traders
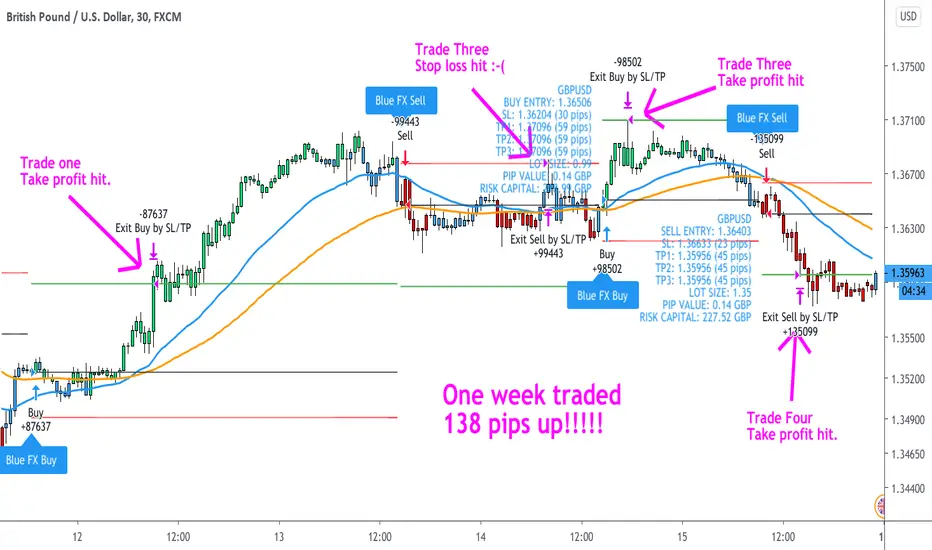
Quick idea as the markets open up for the week I just wanted to show you all how I traded GBPUSD last week.
I am working the 30M time frame here using our 'EDGE' strategy.
As you will see from the chart there was four trades last week on this time frame and three were winners! 138 pips banked.
Our strategy is a follow trend strategy and can be used on any time frame but also with any instrument.
The strategy sits in your tradingview and when all confluences are met a simple alert appears on the chart. At this point we enter the trade.
When an alert presents all the trade information is presented too, take profit target, stop loss, entry points etc.
The confidence in the way we trade comes from the built in strategy tester. This enables us too back test the way we intend to trade.
No one can predict the future but this is a great marker on how trading a pair could perform going forward.
The strategy tester data for this pair can be found at the foot of this idea.
The data is based on £5000 starting capital and risking 2% a trade. Data shown is tested from Jan 2020 to present time.
The strategy tester shows gains from trading this way along with, win rate, number of trades and draw down.
Feel free to press the sub menus and in doing so you will see a performance overview and all 409 trades individually logged.
All of the above allows our traders to trade with confidence and emotions firmly in check.
For any more information on the strategy shown please feel free to drop me a message.
Trading Tools
Five Tips for New Traders and InvestorsWhether you are new or have been trading for 20+ years, this post is a reminder about having realistic expectations when it comes to markets. Patience, the desire to learn, and a positive outlook toward the future, especially over the long run, will help you on your journey. Here are some tips to get you started!
1. Code the markets
Financial markets attract smart people who run strategies, indicators, and analytics to make better decisions. The Pine Script community is a perfect example of this - head over to the Pine Script Editors' Picks page to see for yourself. With Pine Script, you can code and create your own indicator or strategy. More importantly, you can learn the intricacies of price action and the underlying mechanics of specific indicators.
2. Paper Trade to test your ideas
All members have access to our free Paper Trading tools. This means you can trade, invest, and study your ideas in a simulated environment. Do you think you can outperform the market? Open a chart on your desktop, click Trading Panel at the bottom, and connect your account. Place trades and study your performance over the next several days, weeks or months. Let's see how good you really are before risking any real money. 😁
3. Follow others, use chats, and be open minded
Traders and investors from around the globe share ideas here. They also participate in chats and the comment sections. This is not only an opportunity to learn and meet others, but it is also a reminder of who else is participating in markets. You can get instant feedback by asking questions, following their profile or contributing to various chats. It's never been easier to network and work with others to learn about the markets. It's also a reminder that markets are competitive. So get started by exploring the community, meeting others, and learning new concepts.
4. Backtest, backtest, backtest
The Strategy Tester makes it easy to backtest your trades over a period of time. You can test different strategies in the Public Library by opening the indicators menu and selecting a strategy. Strategies are shown with a down red arrow and an up green arrow at the end of its title. It will look something like this: "Momentum Strategy 🔻▲." Add a strategy to your chart and use the Strategy Tester to follow its performance. For those looking for a simpler way to backtest, the Bar Replay tool can take you back in time to test your ideas on a specific ticker. Press the Rewind ⏪ button on the top of your chart.
5. Make a plan
Many new traders and investors forget to make a plan. Instead, they start trading without testing their ideas or learning from others. Use the tools available to you and make a long-term plan! Draw your plan directly on the chart, use the Text Notes tool located at the bottom of the chart as a personal blog or diary, create indicator layouts, save specific chart layouts to never lose your plan, and create alerts for quick reminders. All of these tools can enhance your process and long-term plan. Visit our Help Center to learn more and everything available to you including any questions you may have about your account.
We hope you enjoyed this post and please leave any questions or comments below! Our team is always reading for your feedback. Stay tuned, we have more posts like this coming.

Meet the new Highlighter and Signpost drawing toolsWe recently added two new tools that are available to everyone. The Highlighter is an easy way to highlight price levels, notes, and events on your chart. The new Signpost is a fast way to place notes that connect to specific price levels or events. In the chart above, you can see both of these tools in action. Below, we will give you a little more detail about how to use these tools and where to find them.
Highlighter
We've all used a highlighter before to add emphasis to important words or text. Our new Highlighter tool works in the same way. You can highlight price levels, text or other objects on the chart by simply selecting the tool and then highlighting an area on the chart. To get started with the Highlighter tool, find and open the Geometric Shapes menu on the left side menu. This is the same menu where you can find the Brush, Path, and Rectangle tools. Use the Highlighter tool to add additional emphasis to your research and charting.
Signpost
You can find the the Signpost tool on the left side menu under Annotation Tools. This is the same place where Text and Arrows are found. Once you've selected the Signpost tool just click a point on the chart to place it. You can then drag the Signpost up or down and change its distance from the selected point. The Signpost is an effective way to write notes or reminders at specific price levels. You could even make your own Timeline. 😉
We hope you enjoyed this post about our two new tools Highlighter and Signpost. Please leave a comment below if you have any questions or feedback for us. Our team is always listening! Feel free to share some examples of how you use the Highlighter or Signpost tools in the comments below. You can share a link to your charts.

Setting up and utilize tradingview (layout, drawing panel)Hello everyone:
Welcome back to a quick video on tradingview setups. Many of you have asked me about how you should set up your charts, your settings, customizations, watchlist..etc. So I will make a quick explanation video on this.
Chart:
-Create a blank chart
-Save under different names for different purposes
-candlesticks
-timeframes
-screens
-syncing
Setting/customization:
-color
-appearances
Drawing Panels:
-favorite the ones you're gonna use the most.
Watchlist:
-create watchlist
-flagging
Alerts:
-set only the ones with high probability potential, do need to set like 30 alarms.
As always, any questions, comments or feedback please let me know.
Thank you

The importance of having a plan and sticking to it!Hello traders
Before I log off for the day (I'm in UK and heading to bed!)
I wanted to share an idea on having a trading plan with an 'EDGE' but also having the trading psychology to stick with a trading plan.
I'm lucky enough along with our fellow traders to run a script that has given us an 'EDGE' in the markets.
This has enabled us to trade freely without emotional constraints. I simply place trades that appear on my charts then let them play out.
I do this with no anxiety, no worry and no constant checking of the charts or my trading account.
Here we have a short trade on EURAUD working the one hour time frame.
This trade present last Thursday the 7th and I simply entered. I was then alerted by TradingView when the trade hit take profit on Tuesday the 12th.
I've only just checked the charts now on how the trade played out candle by candle.
As you will you see from the chart the trade played out with a good drop towards the take profit target before retracing back to near entry.
After another little drop and another retrace to near entry the trade then headed down to take profit target.
All of this happened with out me knowing! In my opinion this how trading should be!
On this pair I have the script I use set to a take profit target of 1:3.4 and I always use a stop loss because realist among us will know not every trade lands.
The script presents all the trade information on the chart when the algorithm sees everything is met accordingly to my settings.
I simply take the trade and get on with the rest of my day.
I'm able to do this as I know trading the pair in question by the manner describe above is profitable.
How do I know this? The built in strategy tester tells me. At the bottom of this screen is the data from the strategy tester for the last 39 trades. This data is from two full years of trade data on the pair in question. Feel free to press the sub menus which show the performance overview and the list of the 39 trades. All data is based on 2% risk and a £1000 starting capital.
No one can predict the future but this level of back test data gives me the confidence to go and trade in this manner.
All of what I have described above is what has given not just me but all our traders an 'EDGE' in the markets.
With that edge has come the ability to control emotions accordingly. Sticking to a structured plan is now easy and we trade emotionless with no fears or anxiety.
I have left descriptions on the chart showing not only the entry and exit points of the trade but also a pointer where the old me would have been feeling regret, anger, anxiety and all the other bad feelings that can come with trading. Those feelings all used to come as a result of not having an 'EDGE' in the market to the level that I have now with using this script.
For any more questions on the script in use feel free to ask any questions.

How to connect a brokerage and join the Broker AwardsIn this video we show you how to connect a brokerage to your account. We also talk about rating your favorite brokerage and participating in our upcoming Broker Awards. 🏆
When you connect a brokerage you can trade, invest, and follow markets with advanced tools built directly into our platform. To get started, find and click the Trading Panel button at the bottom of your chart. Once your brokerage is connected, you can use the Order Panel to create orders and manage risk including take profit targets and stop losses. When you place an order, it will appear on your chart. This is one of the biggest advantages of trading with a connected brokerage - see your trades directly on the chart. Make a plan and then visualize the risk and reward.
As a TradingView member with a connected brokerage you are allowed to rate and review your favorite brokerage. Your reviews will help others find the perfect brokerage for their needs. Together, we can build a transparent marketplace with real reviews by real traders. Get started by visiting our Top Brokers page.
Remember, your reviews are important because they will determine our first-ever Broker Awards. Here are the awards we will be giving out based on what you say:
• Broker of the year
• Most popular broker
• Social champion
• Most innovative tech
• Best multi-asset broker
• Best futures broker
• Best forex broker
• Best crypto broker
If you have any questions or comments, please leave them below. We look forward to seeing your reviews and announcing the awards on Jan 20, 2021.

Weekly Institutional COT Analysis (Majors 1) 🎥🎯 This is weekly overview to the institutional positions of the commercials and non-commercials which is big part of the decision making for my strategies next to the technicals.
Subscribe, this video is released every saturday.
📌 GET COT INDICATOR HERE
⏬add this script to your charts
✅ Unfortunately due to data limitation I cant import my complete indicator to trading view so this is just limited for last 10 weeks.
Wish you good hunt in next week !!
Dave FX Hunter ⚔
----------------------------------------------------------------------------------------------------------------------------------------------------------------------------------------------------------------------------------------
❗❗ This is Pre-plan
That means my view can change, depends on how the price will arrive to the level and what will be happening on the M30 in my level of interest for entry. Then I will decide if I will enter or not. So please don't just blindly follow this. FX market is quickly changing environment and it requires full focus on the levels for the precise entry with low risk.
❗❗ DISCLAIMER
We are the only one person who is responsible for our health, relationships, success and money in our life's. So taking a risk on the markets based on this idea is only and only your decision. You deserve the profit and you are responsible for your potential loss. Any opinions, news, research, analyses, prices or other information discussed in this presentation or linked to from this presentation are provided as general market commentary and do not constitute investment advice. Author of the analysis does not accept liability for any loss or damage.
❗❗ Legal Risk Disclosure
Trading foreign exchange or CFD on margin carries a high level of risk, and may not be suitable for all investors.
The high degree of leverage can work against you as well as for you. Before deciding to trade foreign exchange you should carefully consider your investment objectives, level of experience and risk appetite. The possibility that you could sustain a loss of some or all of your initial investment and therefore you should not invest money that you cannot afford to lose.You should be aware of all the risks associated with foreign exchange trading, and seek advice from an independent financial advisor.

Using the new SignPost ToolI love the new Signpost tool that was released this week... i was all set to put in a feature suggestion when I realized I could already do it: make the signpost go DOWN as well as up!
I am a stickler for documenting your trades - EVERY single trade: the winners but ESPECIALLY the losers - so you can learn, reinforce, and EMBED your trading system into your subconscious. (See link to a previous article on that very subject below!)
Hope you enjoy this video... let me know what you think!
Trade well...
-Anthony

How To Download Divergence+ I get a lot of private messages about divergence+, a divergence indicator that also gives insanely accurate buy and sell signals. It is so accurate the creator charges a monthly subscription for the indicator.
It cost $15 a month and for me personally, with the gains I have made... It is has already paid itself off for the remainder of my life and I am young!
Here are instructions on how to download
1. View my account [Myantman101}
2. View who I am following and click on Market Scriptors
3. Send them a private message requesting access to D+
4. Follow their instructions and use as desired
Hope this indicator helps everyone in their analysis/trading decision making

We've added 100+ years of price history for gold and silverThe team at TradingView is committed to building a platform that gives you the best charts, data, and visualizations for better decision making. Today, we're happy to show you two new data feeds that we've expanded for those who want to see the history of gold and silver.
You can now chart over 100 years of price history for gold and silver. As two of the oldest precious metals and essential to the evolution of currencies and trade, we believe these additional years will be invaluable for long-term precious metal traders and enthusiasts. See gold or silver in short-term time frames or long-term time frames going back as far as 1915.
To get started, type GOLD or SILVER into your search box. You can also use the two links we've included below for quick viewing:
• See a live gold chart
• See a live silver chart
We hope you enjoy these expanded datasets and if you want us to add even more data for a specific ticker, please write it in the comments. Our team will do their best to add it for you. Thanks for reading!

Did you preserved or gave back your March/April profits ? Stay humble , be ready always to learn new something. I'm a beginner and still learning from the stock market every day .

The Ace Spectrum as a Template for Support ProjectionDemonstrating the big idea: That straight lines in log-space form exponential curves.
This property of the log chart is useful for examining assets with exponential growth (like high-growth stocks, cryptos, etc).
Because the log scale asymptotically approaches the absolute scale as y slice decreases, this indicator is really applicable to any time scale.
This indicator samples a distribution of lines from the past and projects them into the future, these projected lines form indicators of prior support.
The idea is longer support at those specific lines is indicative of support strength, which this indicator approximately captures.
My initial goal was to capture this intuition about exponential growth in log spaces by applying a monte-carlo style sampling approach to visualize the latent support lines.
After I had captured that in a slightly more complex version of this indicator, my goal was to distill the concept into the simplest possible implementation.

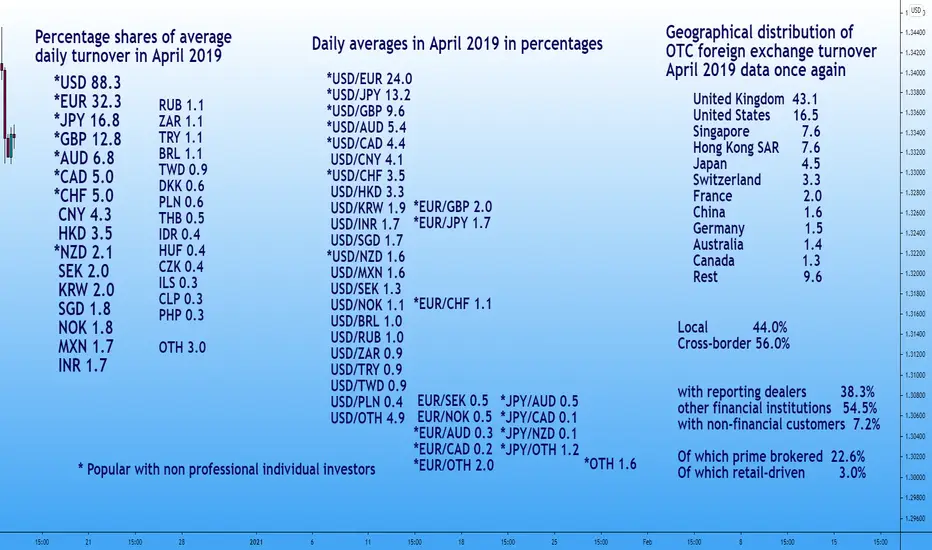
What currencies get traded, and who does the trading?What currencies are being traded in what percentage, what pairs, where are traders located, and more.
Total daily volume in April 2019 was 6.6 billion usd.
From the 2019 BIS triennial survey
www.bis.org
How to create chart art, infographics, and custom visualsThere are two things you have to master to create the best chart art:
1. The drawing tools available to you
2. Your chart settings
In this video, we show you how to create a blank canvas for chart art, infographics, and custom visuals. The first step to getting started is understanding how you can turn your chart into a blank canvas. Open your chart settings to get started. In your chart settings you can control the look and feel of your chart including the ability to hide everything, even the price line, and draw on an open canvas. You can also control the background, scales, and color of the price line to create something totally unique to you.
The simplest way to create a blank canvas is to uncheck each box in the chart settings and adjust the background color of the chart including the vertical and horizontal grid lines. Once you've created your blank canvas, you have the freedom to create and draw anything you want. You can use this canvas to make flow diagrams, pictures, and more. It's really up to you and your level of creativity. Here are some recent examples that convey interesting educational lessons or trading concepts:
How to manage risk
What is growth investing
How to think about the long term
The trader's journey
The final step to creating the best chart art and custom visuals, is to make sure you master your drawing tools, which are located on the left-side of your chart. You can use them to draw anything that comes to mind. It could be a flow chart, a cartoon or even a picture. You will want to make make the brush tool your best friend. It's how you draw freely across your chart as if you were holding a pen or a paint brush in your hand.
We hope this video tutorial helps you get started and we look forward to seeing the work you create.
Please leave any questions or comments below. In addition you can ask for product features or product requests and we will share them with the team.

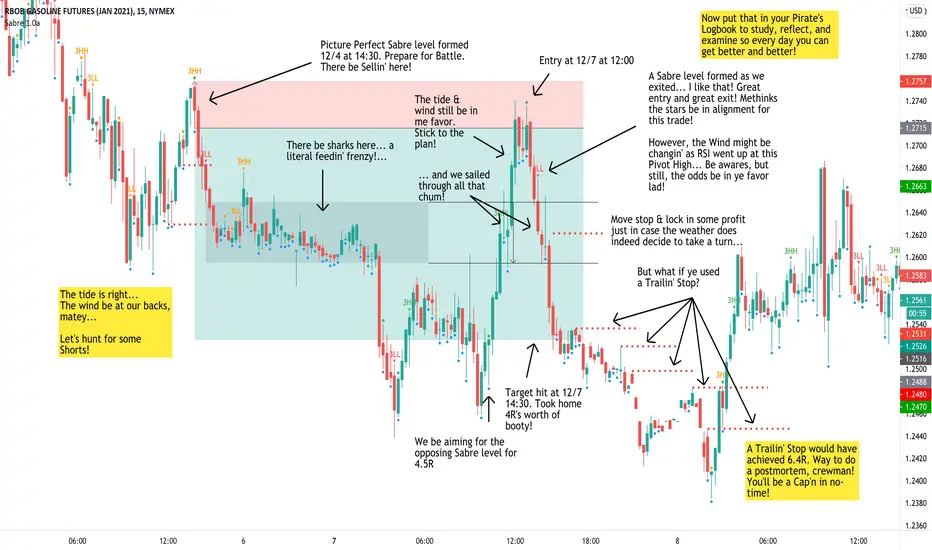
Documenting Your Trades (For Fun and Profit)How do you document your trades? In a spreadsheet? In a trading journal? Directly on the chart? How much is too much? How little is not enough?
I say you need to document enough to tell the story properly. Every trade tells a story. As with all good stories you have a protagonist and an antagonist. Good guys and bad guys. The hero and the villain. And then, there's the journey.
In the markets you are the hero and the market is the villain. One way I make trading "fun" and what helps me "tell the story of the trade" is to "Trade Like a Pirate" and use the vocabulary of Jack Sparrow. I have already written on this topic when it comes to analyzing profit targets (seizing treasure and plunder) but let's look at how we learn what we did on a trade by trade basis.
When you do an after-the-trade analysis (what I call a postmortem) you should be able to see what you did right, what you could have done better, but most importantly, what you may have done wrong; not to beat yourself up, but to make sure that you *never* make that mistake or repeat that behavior again. (Fool me once, shame on you... fool me twice, shame on me!)
For instance, I once lost three trades in a row and asked "How the heck did that happen?" and later when I looked at the actual trade screenshots I realized that both my trading timeframe and trend timeframe was the same! Somehow instead of having my charts on the 60-15 minute charts they were *both* 15 and I realized if I had my chart timeframes right I would have never entered those particular trades, saving me from experiencing those losing positions. Thanks to those trades, though, and thanks to my post-mortem analysis, the first item on my "pre-flight checklist" is now "Verify Trade Timeframes." Thanks to journaling and the postmortem process I'm *never* going to make *that* mistake again.
But what about the *psychology* of the trade? *Why* did you enter it, *what* were you thinking once you were in it, *why* did you adjust your stop, *why* did you choose your target, *what* might you have done out of fear that got you out of the trade early or prevented you from realizing as much profit as you could have?
Journaling your trade, or documenting the trade *properly* will help you with that.
In the example above you can see a recent trade that presented itself to me and my pirate "Crew" in the Gasoline Futures market. I talk about the "weather conditions" before getting into the trade (the wind and the tide), other environmental factors like the "shark feeding frenzy area" helping me decide where I will target my profit (there be treasure *here*), what was going on when the trade actually entered, and finally, managing the trade to my target. In addition, during the postmortem I found an opportunity where if I had used a trailing stop, I could have gotten an additional 42% profit, or 'treasure'.
As I mentioned in my Backtesting series, one of the reasons you backtest is that through repetition, you can often find patterns in your system that will prompt you to tweak it to either *improve* results or *eliminate* inefficiencies. In this same manner, through repetition in documenting your trades you may very well find a pattern of behavior that is holding you back from your full potential.
For example, In the trade above, after securing 3R, (the minimum I am willing to take in a trade), if I followed price using my trailing stop strategy instead of a target, I found that I could have made an additional 2-3R profit. What if after documenting 20, 30, 40+ trades I find a similar pattern, that I am often "leaving money on the table"? I can then test several exit strategies to see which ones would give me the biggest bang for my buck and increase my R per trade.
The other big benefit of having your trade journal "tell a story" rather than "state facts" is you begin to *personify* the market and see it as someone who exhibits certain behavior patterns, and that is what the markets present to us every day: PATTERNS. And if you can determine someone's patterns, you can predict their behavior.
If I know that whenever my wife is browsing through a jewelry catalog and consistently goes "ooh" or "aah" over earrings with blue stones in them, I can guess with a high degree of accuracy that if I buy her a set of sapphire earrings she (and consequently*I*) will be a happy person. Likewise, if I can predict with a high degree what "Mister Market" is going to do based on certain patterns, I can keep setting sail, with confidence, day after day and see gains in my trading account (which makes me, my crew, and most importantly the missus, HAPPY! (Because when momma's happy, everybody's happy!).
Trade well! (And Journal Well!)
PS: Let me know how your journaling journey goes in the comments! I'd love to know how it "upped your trading game!" You can only improve what you analyze!
-Anthony
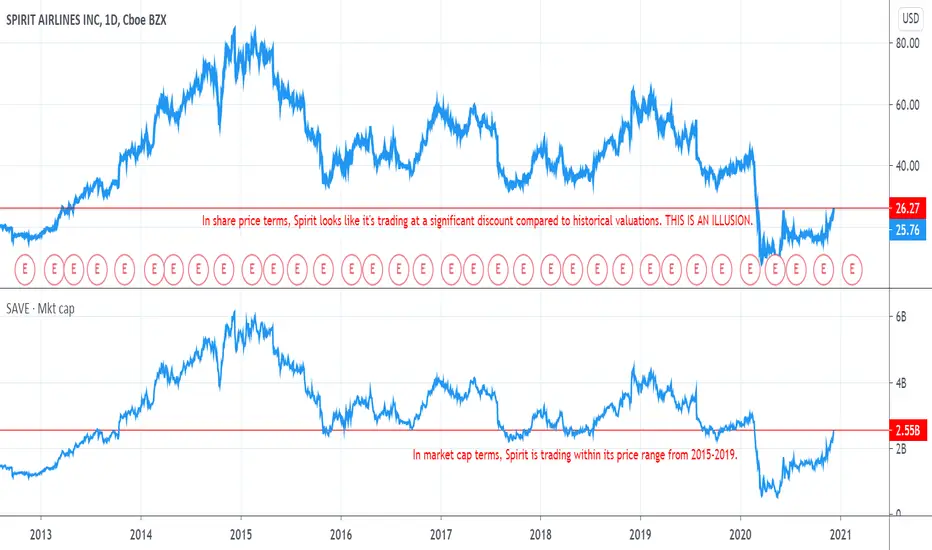
Is it cheap? Why "dilution" is a concept you NEED to understandMany newbie investors get in trouble because they don't understand the relationship between share price and share count. If you're new to investing and you've never heard of "dilution," it's very important that you keep reading this post.
If I look at a standard chart of Spirit Airlines's share price, such as a upper chart above, I might conclude that the stock is cheap right now. Spirit shares are trading well below the price they've traded at for the last five years.
This is an illusion. The valuation of a company is its share price times the number of shares outstanding. When a company runs low on cash, it sometimes issues and sells new shares. This "dilutes" the ownership percentage of existing shares.
Imagine I have a pie, and I've invited you and two other people over for a piece. We're each going to get a quarter of a pie-- a really big slice! But then you decide to invite a friend. The size of the pie doesn't change, so now we have to cut it in fifths so your friend can have a slice. Each of us will get a smaller piece.
Issuing new shares works the same way. Since the beginning of the Covid-19 pandemic, Spirit Airlines has issued 29.14 million new shares, increasing its share count by 42.5%. That means that each share now represents a much smaller proportion of the company than it used to. The shares have been "diluted."
Because of dilution, looking at a chart of the price of a single share doesn't tell you how "cheap" or "expensive" a company is compared to its historical valuations. Fortunately, there's a quick and easy way to chart a company's actual valuation.
Share price multiplied by shares outstanding equals the company's total price tag, its "market capitalization" or "market cap." To chart market cap on TradingView, find and click the button labeled "fundamental metrics for stocks" at the top of the chart. Type "market" in the search box, and TradingView will narrow the list of metrics down to the one you want. Clicking on "market capitalization" will add a time series of the stock's market cap to your chart.
When we look at market cap for Spirit Airlines, it doesn't look cheap anymore. Spirit is trading within its price range of the last four years, even though the company is now financially worse off in every way. With earnings negative and sales nearly cut in half, Spirit is priced as if the pandemic had never happened. By charting market cap, you've adjusted for dilution and gained a much better understanding of the asking price.
HOW-TO: Backtest Your Forex Strategy & Increase Your Win-RateIn my earlier article, " Proving Your Trading System with Backtesting ", I demonstrated how, in the Futures market, you could backtest your trading system, see what works and what doesn't, change your variables, and rinse & repeat until you have a winning trading formula.
You GET this winning formula by torture-testing (ahem, *back*testing) your system under every market condition.
My last video backtested Futures as an example and I received dozens of requests to demonstrate and develop a similar system using Forex, so here it is! This video will show you HOW you can backtest your own Forex Trading system over time, determine its results, and refine it until it is bulletproof (or marketproof!).
All you need is a Trading System, a Spreadsheet, and a great trading platform (ahem, like TradingView) :-)
Trading can be the most rewarding of careers, but only after putting in the hours of hard work. And like everything else in life, if you don't put in the work, you won't get the results. And if you put in the work AHEAD of time, you won't have to put a DIME of your hard-earned capital into the market until you are CONFIDENT that your system will multiply that money in your account rather than feed the market monster.
I hope you enjoy the video... but more importantly I hope it will help you become a better trader. If this was beneficial to you please feel free to leave a like, a follow, or a comment... I'd love to hear from you and stay in touch as we all move forward in our trading journeys!
Trade hard, and trade well!
-Anthony

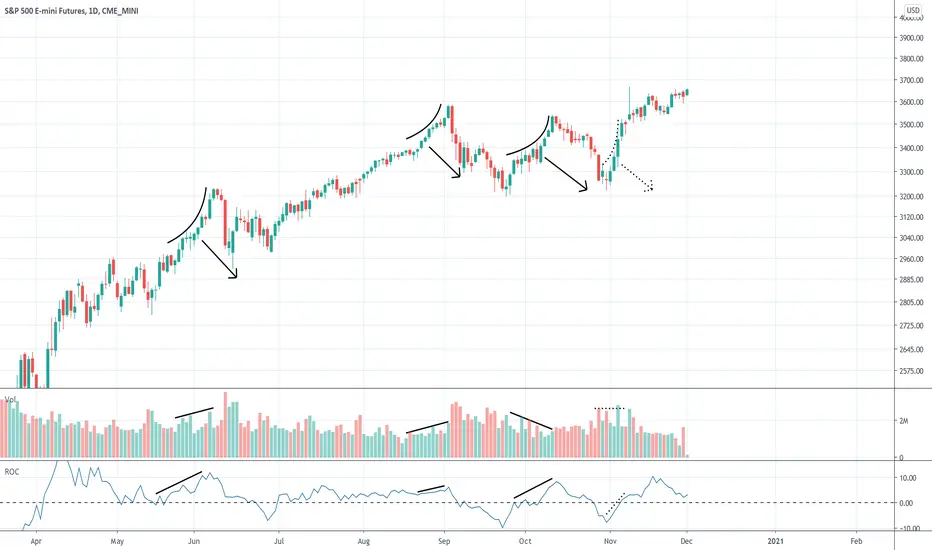
How to Spot Blow-off Tops - ES1!Here are 3 blow-off tops and 1 failed attempt which all occurred in the last 7 months. Successful completions are marked in solid black. The failed attempt is shown in dotted black.
On all 4 attempts, the price accelerated upwards to different degrees. Each target can be roughly measured based on the price move.
Notice how the failed blow-off begins closer to a price bottom than the successful ones did.
Volume was either steadily increasing or declining during successful blow-offs, compared to the unsuccessful attempt when volume was not clearly trending.
ROC (momentum) was increasing with all 4 attempts. The blow-offs were successful when momentum was at 0 or positive at the start of each blow-off.
Disclaimer: This is my opinion. This is not advice. Trading involves risk.
Explaining LEVERAGE. All you need to knowIn the forex market we can get leverage on our trading accounts.

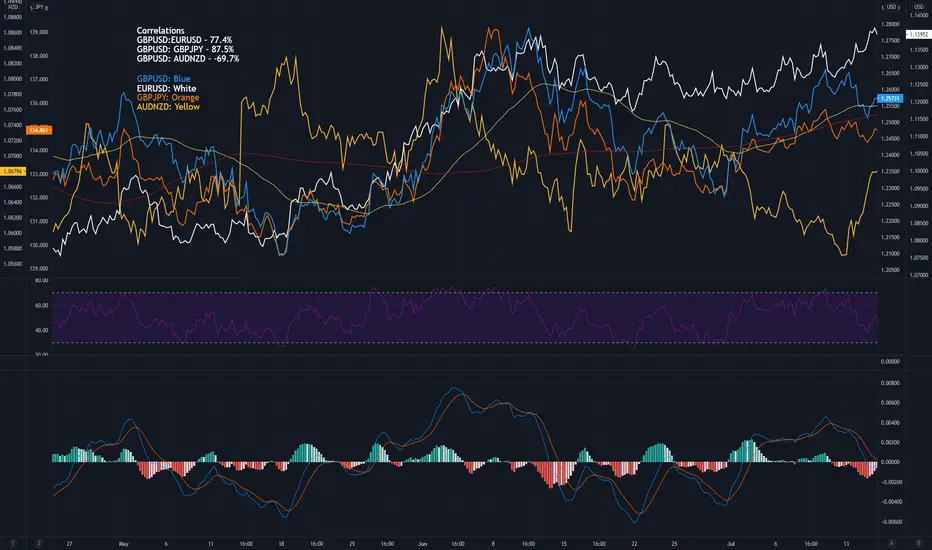
Forex Pairs Correlation: Avoiding Contradictory TradesHello, in this post I will be talking about Forex Pair Correlations. A problem new traders frequently find themselves in is opening/having positions that are contradictory. I will elaborate on that but for now, let's understand first what correlation is. A correlation is a statistical relationship which means that when A moves a certain way, B will move a certain way. The stronger the correlation, the more likely that the price will move along with each other/opposite of each other. There are 2 types of correlation; Positive correlation which is A and B will move together, and negative correlation which is A and B will move opposite of each other. Now that we understand what correlations are, I can address the problem that new traders have. Contradictory positions: For example, having a long position in GPBUSD and a short position in GBPJPY is contradictory since these 2 pair has a 87.5% correlation which means 87.5% of the time, it will move together. As you can see in the graph, when the GPBUSD (Blue) moves up, GBPJPY (Orange) moves up and vice versa. This applies to moving down as well. GBPUSD (Blue) and AUDNZD (Yellow) is an example of a negative correlation (-69.7%). My recommendation to avoid having these problems is if you do not yet have an understanding of which pairs will move up and down together, check this website: www.myfxbook.com This website will show you every pair and its correlation. Of course, there are some exceptions to when contradictory trades are fine like when hedging against each other or when 1 trade is short-term/intraday/scalping, looking at the smaller trends and the other one is swing trading/position trading looking at the bigger trend. However, I do not recommend new traders to hold/open contradictory trades until they have some confidence in what they are doing.
Main points:
1. A correlation is a statistical relationship which means that when A moves a certain way, B will move a certain way.
2. Positive relationship = Pairs will move the same way.
3. Negative relationship = Pairs will move the opposite way.
4. New traders should avoid contradictory trades.
5. Website for checking correlations: www.myfxbook.com
Please give a thumbs up if you agree with the educational post and if there are any questions, feel free to comment down below.
How to use Fibonacci correction levelsHello, Traders!
Most of you have heard about Fibonacci Retracement, some of you saw it and some even tried to use it on their own charts. So today I am going to explain how to use this instrument correcly.
Traders use the Fib Retracement tool in order to determine the nearest correction levels on the chart,.
If your task is to find out the nearest correction levels of upward movement, the level of 1.0 Fib Retracement. should be at the beginning of the movement and the level of 0 Fib Retracement at the end of it.
In simple words: if you are looking for upward motion correction, then 1.0 should be at the bottom and 0 at the top. If you are looking for a downward correction, then the opposite is 1.0 at the top (start of movement) and 0 at the bottom (end of the movement).
There are three types of correction by Fibonacci levels :
1. Bullish to levels 0,236 and 0,382.
2. Normal correction to the levels 0.50 and 0.618.
3. Bearish correction to 0.786 and 0.860.
When the movement is sharp, most often the correction will be minimal and will end at levels 0.236-0.382.
When the movement is corrected for a longer time, the correction comes to the levels of 0.50-0.618.
If the movement breaks down, the correction ends at levels 0.786-0.860.
In other words, in order to continue upward movement, as in the current BAND chart, we will be interested in levels of at least 0.236-0.318 and 0.50-0.618.
Near level 0.618, it is beneficial to catch the sharp impulses that occur due to the stops of market participants.
If the price movement comes to the level 0.786-0.860, then most often it is already its conclusion and it is dangerous to buy at such levels.
At the current bullish rally, the use of correctional Fibonacci levels will bring good results.
Share your setups in the comments and I would help you understand if you used it correctly!

Backtesting Part 2: Testing Your Trading System in 3 Easy StepsIn my earlier article, " Proving Your Trading System with Backtesting ", I outlined the HOWs and WHYs of backtesting. Does your trading system work under all conditions? Under what conditions might it *not* work? Can you remove those instances from your plan? Under what conditions might you *improve* your win rate? In another article, " The Unexamined Trader ", Just as an unexamined life is not worth living, the unexamined trader should not be trading a system that has not been tested under every market condition (and I mean TORTURE tested under HUNDREDS of trades).
This video will show you HOW you can backtest your own system over time, determine its results, and refine it until it is bulletproof (or marketproof!).
All you need is a Trading System, a Spreadsheet, and a great trading platform (ahem, like TradingView) :-)
It will take some time and effort, but like everything else in life, if you don't put in the work, you won't get the results. And if you put in the work, you won't have to put a DIME of your precious capital into the market until you are CONFIDENT that your system will multiply that money in your account rather than feed the market monster.
I hope you enjoy the video... but more importantly I hope it will help you become a better trader. If this was beneficial to you please feel free to leave a like, a follow, or a comment... I'd love to hear from you and stay in touch as we all move forward in our trading journeys!
Trade hard, and trade well!
-Anthony

Proving Your Trading System with BacktestingWouldn’t it be great to see the future? To see where turning points in price will occur with a high degree of accuracy? To see if a trading system that you developed or bought or learned actually works? Well, you can, with a method called BACKTESTING.
Backtesting performs three important functions:
1: It helps you IDENTIFY the reliability / win rate of your trading system over time.
2: It helps develop and reinforce the muscle memory you need to EXECUTE opportunities in your trading strategy
3: It helps you continually REFINE / improve your strategy as you observe it work against price action, ultimately increasing your "hit rate" as a professional trader.
The first requirement of a trading system is that it works via RULES. There are no 'hunches' in the market... the market has *specific* behavior patterns and our job as traders is to recognize those patterns and *capitalize* on them.
Backtesting has three important requirements:
The first requirement is that your trading platform supports backtesting. Can you go back "x" amount of time and look at the timeframe(s) you need to make the decisions you would have made if you were "in the moment" in an efficient manner in order for you to simulate hundreds of trade setups?
The second requirement is that *you* are willing to put the energy and work into testing your trading system within an inch of its life before you risk a single penny of your trading capital. You need to know WHEN the system works, WHERE the system fails, and WHY the system worked and failed when it did, and that takes hundreds (if not thousands!) of simulated trades to do so.
As you are observing the system in action you will begin to "see" the patterns in a new light. It will become more and more intuitive and you will find opportunities to 'tweak' the system as you go along. You will identify patterns when trades fail and stop trading that pattern. You will see opportunities that got away and you can 'tweak' your system to take advantage of those opportunities. Most importantly, you will see whether the system even works reliably at all and ditch it if it doesn't. It may be frustrating to decide to do so, but the good news is you will not have lost a single penny trading a faulty system to begin with!
TRACKING YOUR TRADING SYSTEM
To track the accuracy of your trading system you will need to setup a spreadsheet that will record the important variables you want to track. For example, you may want to include the headers,
Asset / Date / Time In / Time Out / Long or Short / Reward to Risk Ratio / Gain or Loss / Account Balance
The "Reward to Risk Ratio" column is the most important. If you read my previous column, "Trade Like a Pirate" ...
... I discuss that you need to think in terms of Percent Risk per trade ("R") and not Dollars. This will show you how well your strategy works. For Example, if after tracking 100 trades you find out that your system has a 33% success rate, your account will grow by 1% for every three trades if you follow a minimum 3:1 Reward to Risk Ratio (3 -1 -1 = +1). If you find on average 6 trades per day, your account can potentially grow by 2% per day. Under the "Account Balance" column, if you add the trade's win/loss to your previous account balance you can determine how long it would take to get 'x' amount of money from where you started (or how long it will take and inferior system to lose it all as well!)
Testing your trading system also shows you how many opportunities present themselves per day / per hour and when the best time is to go 'fishing' for trades. Backtesting might tell you that you need to wake up 2 hours earlier (and go to bed 2 hours earlier) if you want to achieve the goal of replacing your car in 6 months. Or fire your boss in 24 months. Or pay off the mortgage in 3 years. Having a plan to *make* money should also include your plans on how and when you want to *spend* that money - how you will 'pay yourself'.
Socrates famously said “The unexamined life is not worth living.” Likewise the unexamined trading system is not worth putting your hard earned money into. The more you backtest your system, the more you will gain (or lose) confidence in the system which will ultimately determine the actions you will take.
Another happy by-product is that not only will you be able to refine your trading system, but you yourself will be continually refined in the fire of the market, exercising your mental muscles looking for opportunities that meet your particular trading system. For instance, by analyzing all my losing trades in my first batch of 100, I was able to identity a pattern in the formations common to all failing trades but not winning trades. I then modified my trading system to exclude trades which showed that pattern, increasing my success rate by 30% in the next 100 trades I tested with the new system. Not happy with that, I went through my losing trades from Round 2 and found another common pattern among them. Eliminating those, I modified my system and increased my success rate by yet another 20%.
Finding what works is often a product of finding out what doesn't work, and just stop doing that!
If you need advice on how to stop a bad habit, just listen to Bob Newhart:
www.youtube.com
Finally, just as any athlete will you tell you that you should "Warm Up" before performing any strenuous exercise, one thing my backtesting system has taught me is that I need to spend the first 30 minutes of my trading day "warming up" by finding all the opportunities that presented themselves in the Futures market during the overnight session and log them in my spreadsheet. Likewise at the end of the day I look at all opportunities I might have missed so I can reduce the likelihood of missing them again. The original title of this article was "Backtesting to the Future" which reflected this habit: by 'warming up' before actually trading I got my mind prepared to "see the opportunities" for the future day ahead, and I identified these patterns a lot better than I would have if I entered the pool cold and experienced the 'cramp' of a losing trade.
Admittedly, backtesting a highly visual concept, so I will be following up this article with a video showing an example of my backtesting strategy and how you can model my system to meet the needs of *your* system. As I love to say, "Good artists copy, great artists steal." Likewise, "Good traders copy... Great traders steal." I hope you can steal some of these ideas and have them help improve your trading game!
Share your thoughts and success below! As always, I'd love to hear if this has helped you become more confident and profitable in your trading. Like and Follow if you haven't already and you will be alerted to when I post the followup video!
Trade hard and trade well!
