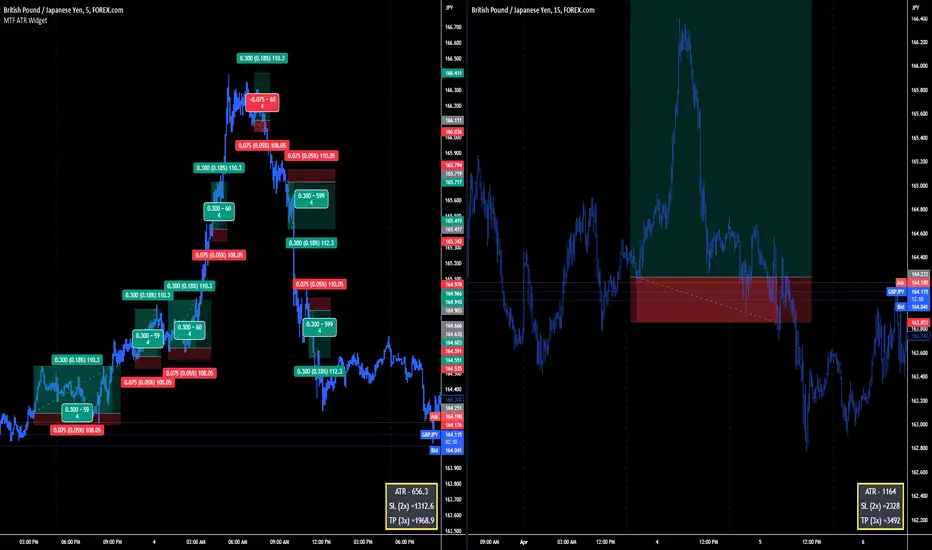
Targets Matter TooIt may not seem like it is very critical, but let's use two traders as an example.
Trader #1 on the left uses targets. They know the move may be way bigger than what they target, but every time they close a position, they can re-enter again, keeping a small risk for consistent reward.
Trader #2 on the right wants a home run every trade, and they do not use targets. They know big moves happen and they want it (greed) If they risk small, evetually they will get the home run trade, but at what cost?
Trader #1 had a great day. They took 7 trades and lost two. Final results +135 points (150 won from 5 x 30, -15 from 2 lost) They had a consistent hit rate, closed several winners, and never had to stress about the charts because their move was over in a few minutes. No grey hairs today.
Trader #2 however sees how trader #1 does things, and thinks, "that's no good. All those tiny trades and short targets, they could just make one trade and make HUGE! that's what I'll do...."
They see a possible entry, and it works. Price gets jumpy and they get excited "This just has to go forever! I'm rich! Beat that other trader!" They have to go to sleep eventually and let the trade run. When they wake in the morning, they find they were stopped out. How? It left with so much momentum there's no way it would come back! :(
Now trader 2 wakes up to a bad trade, which makes the rest of the day terrible. Why couldn't they catch that and close it? It's ok, I'll try again. Set another trade, watch for hours, walk away and same result. Constantly getting stressed and worrying about the stop being hit, because they don't have a target that makes sense. Maybe they do put targets in eventually, but then the "This is a home run!" sets in, and they remove the target, because hey, one trade for 300 pips is better than 10 for 30, it's just logical, right?
Stop hit after stop hit, and eventually, the account goes kaput.
Had trader#2 copied the target mentality, And set even a slightly beyond reason target, they still have more chance of success than the "Home run hunter"
Yes, the 100 r trade is awesome, I'd like to have one.
The only problem with hunting that massive winner is it will cost you a lot more than just some money. It will cost you time, stress, sanity, and make your head grey before it's time. So is the home run really worth this?
I'll leave that decision to the individual, but numbers don't lie. The trader with targets is doing well. They can even raise their lot sizes with confidence, and know that when they lose 4 times, it's a bad day (Because of R:R) and stop to keep the account healthy.
The trader without a target just keeps losing trades, deals with constant excitement and doubt, can't leave the charts, and can never be confident enough to trade beyond a minimum size, because they have been stopped out so many times, what if they take the risk and it (likely) fails, like all the other trades..... And they never grow the account, even if they do all the other things right. They may get profitable, but they won't ever grow exponentially, because the confidence will never agree with the trade, and they won't be able to hold it long enough to be worth it.
Targets are where consistency comes from. This is especially true about scalping. DON'T BE GREEDY! Set a target and take the money. Stop letting a fast candle delete your target. Often times, price will run, you remove the target, and u-turn right to the stop loss (probably reaching the target you had). Don't delete a winner and get knocked out by a stop run over volatility. They also can not get a solid statistic for trades, and never gain the certainty in putting the risk on the line.
Trader #1 can do whatever they want. They know how often they win, how well the system they use works, and they know about what to expect for a return on a good day, so they can trade any amount and let it run to the target without panic. They know out of 10 trades, they lose 4 times. Because of the R ratio, If they use the same value for the lot stops, they will make money no matter the trades play out..... Comfortable, no greed, certain, and highly profitable to a point of exponential account growth. That's how they do it....
So, pick a R ratio, 1:2-3-4. Use it consistently, and then tally the results. After some practice, you can find a good ratio that works for your trading style. The larger the ratio, the less you will win. The math is on your side though, because 1:3 only needs to win 4 out of 10 times to make money... Pick one that fits your strategy/style/level of patience, and you may find a big difference in your trading consistency.
Consistency is what really makes or breaks an account. Consistently hit targets, account will grow.
Consistently enter, wait days, and stop out will surely ruin the account over time.
Stop the account demise with targets, and ALWAYS have a target if you find yourself breakeven or stopped out often.
Trading Plan
6 ways to stop loss in gold
Take profit and stop loss are one of the most important links in the entire trading system. After studying this article, you will be able to thoroughly understand the stop loss method.
You can bookmark it before reading it. If you feel that you have gained something, you can like it, thank you.
1. 6 stop loss methods
Stop loss means that when our order loss reaches a predetermined value, we need to close the position in time to avoid greater losses.
In a complete trading system, stop loss Stop loss is divided into static stop loss and dynamic stop loss.
Static stop loss means that after the order enters the market, the stop loss is set at a fixed stop loss space, or the stop loss amount remains unchanged. Once the market trend is unfavorable, the stop loss will be closed when the set position is reached. For example, after an order enters the market, set a stop loss of 100 points, and close the position when 100 points arrive.
Dynamic stop loss means that the standard of stop loss in the trading system is dynamic. When we hold a position, the market is constantly fluctuating, and there is no fixed point for when to stop the loss. We must observe the dynamic market changes until there is a trend that meets the stop loss standard, and then stop the order. For example, when holding long orders, the stop loss standard is that the market forms a short reverse break position structure, and we will stop the loss manually at this time.
Method 1: Fixed stop loss space, or fixed stop loss amount.
This is a relatively simple static stop loss method.
After the order enters the market, set a fixed stop loss space, for example, after an intraday trading order enters the market, set a fixed 30-point stop loss. Or set a fixed amount stop loss, for example, if the order loss reaches 1% of the principal, the stop loss will be stopped.
There are also traders in the stock market who stop loss at a fixed percentage of market retracement, for example, stop loss if the stock falls by 5%.
In this way of stop loss, the space for stop loss should be determined according to the specific volatility of different varieties.is absolutely necessary, and a trading strategy without stop loss will eventually end in loss.
Method 2: Stop loss at high and low points.
High and low point stop loss is the most common stop loss technical standard, and it is also a static stop loss method.
The market always operates in the form of waves, so there will be continuous rising or falling callback highs and lows. These highs and lows are also called inflection points. In actual combat, the starting point of the wave or the inflection point of the callback is used as the stop loss point.
After the bottom of the market breaks, open a position. There are two ways to use stop loss at high and low points. One is to place it at the inflection point, and the other is to place it at the starting point of the wave.
The inflection point stop loss, the stop loss space is small, the profit and loss ratio is good, but the fault tolerance rate is low, and it is more aggressive.
Stop loss at the starting point of the market, the space for stop loss is large, and the profit-loss ratio is worse, but the fault tolerance rate is high and more conservative.
This stop loss method is also relatively flexible, as the volatility changes, the stop loss space will also be adjusted.
Method 3: Combine technical stop loss.
Stop loss combined with technical positions refers to the combination of key positions of technical indicators in actual combat, and stop loss when the market breaks through these technical positions. For example, important support and pressure levels, or technical moving average levels, etc.
Method 4: Stop loss in trend reversal pattern.
This is a dynamic stop loss method. After the order enters the market, the market goes out of a reverse structure or form. At this time, it can be understood that the trend has reversed and the order is stopped.
In actual combat, you can combine your most commonly used criteria for confirming reversals. You can use the crossing of moving averages, or the breakout of trend lines and channel lines, etc., as long as the standards are consistent.
Method 5: Stop losses in batches.
In an order, set multiple stop loss standards, and stop losses in batches in proportion to different stop loss points.
This is a compromise stop loss method. Set different stop loss points through different stop loss standards to disperse the risk of stop loss.
In actual combat, it is often encountered that after the order stop loss, the market reverses and goes out of the original trend. At this time, because the order has stopped loss, it is very disadvantageous.
The operation of batch stop loss can keep a part of the position when encountering this situation, and can continue to make profits after the market goes out of the direction again.
Method 6: Moving stop loss.
Trailing stop loss means that after the order enters the market, the market develops in a favorable direction. After leaving the entry point and gradually generating profits, the stop loss is adjusted from the original stop loss point to a more favorable direction. The market gradually develops and the stop loss Also adjust gradually.
Moving stop loss is a bit like the left and right feet when climbing stairs. When your right foot goes up the steps, your left foot will follow. Every time the profit increases to a certain extent, the stop loss will follow.
The first purpose of trailing stop loss is to preserve capital, so most of the time the first step of trailing stop loss is to move the stop loss to the cost price.
In this way, even if the worst result is encountered, the order will be out of the market without loss. After setting the trailing stop loss, the order will no longer lose money, and even the profit has been locked. At this time, the psychological pressure of holding positions is very small, which is conducive to the execution of transactions.
These 6 stop loss methods, you can choose the appropriate method according to your own trading strategy
OANDA:XAUUSD OANDA:XAUUSD COMEX:GC1! TVC:USOIL BINANCE:BTCUSDT.P COINBASE:BTCUSD

Follow Through Day's and Market BottomsIt’s said that three out of every four stocks will follow the trend of the general market. It’s also known that the best opportunities come when a bear market ends, and a fresh new uptrend begins. The question is, how do you know when a new uptrend starts?
The Follow Through Day
A Follow Through Day was defined by William O’Neil as “when one of the major market averages moves up over 1.25% on heavier volume than the previous day.” A Follow Through Day usually occurs sometime between days 4 and 12 of an attempted rally.
When to Start Counting Rally Days
While the market is in a down trend, you are waiting for the first day the market closes positive to start counting your attempted rally days. The first positive day is day 1 of the rally attempt. On day 4 or later you are looking for the Follow Through Day to occur.
How Does a Follow Through Day Fail
Not every follow through day works, but no bull market has started without one. All days of the rally do not need to be up, some may be down, however a follow through day officially fails when the low of day 1 of the rally attempt is undercut. When this happens, it is time to start looking for a new day 1 and another follow through day.
It is not uncommon to have multiple attempted rallies and failed follow through days before the market begins a new uptrend. Let’s look at a few market bottoms from the past reviewing the concepts covered.
Nasdaq 1998 Bottom
SPX 1974 Bottom

Simple Math Defies Logic"The ones who make the most money lose the least when they are wrong"
Let's use a scalping trading style for example
Say you have a set risk reward ratio of
-10 pips for being wrong
+30 pips for being right
Start trading
Loss
Loss
Loss
Win
Loss
Loss
Loss
Loss
Loss
Win
Loss
Loss
Loss
Win
Win
Loss
Loss
Win
Loss
Loss
Wow, a lot of losses, but hold on.... You have the same amount of money you started with, minus maybe a small bit on commission.
How does that happen?
Let's put the running total (pips) next to each trade
Loss -10
Loss -20
Loss -30
Win 0
Loss -10
Loss -20
Loss -30
Loss -40
Loss -50
Win -20
Loss -30
Loss -40
Loss -50
Win -20
Win +10
Loss 0
Loss -10
Win +20
Loss +10
Loss 0
Final for the day = 0 ( -1.5 - 2.5 pips for commissions)
Accuracy rate: 30%
So in simple terms, by just using a simple risk management set up that allows you to win more than 1x the risk, you do not have to have a very high accuracy rate in order to make even a small profit.
It is very difficult to keep your mind in check about this simple math, because we look at each trade on it's own, instead of looking at a series of trades (for a day/week/month) to judge performance. Keeping the overall picture in mind, and just making sure you do not allow more risk on a position than you planned, and most cases you will begin to see an improvement on trading.
By not using stops, losses can quickly mount up, because losing streaks happen. Stick to the plan, and let your mind just sit in the corner mad about the stop rules (Ignore the feeling, like a 2 year old that didn't get ice cream, or because they weren't right, & just remember the math).
*If you move your stop, one of two things apply:
You are either finding more support for the idea, just a bad entry. Move the stop to what you would risk as an additional position had you taken the trade from the spot you decide to move the stop from, and count it as two trades.
If you had a small stop, but not the maximum risk you allow on the idea, then move it no further than you planned to risk as a maximum for a single trade.
Moving a stop because you have a reason is OK, just COUNT IT, and MAKE SURE you have a REASON to do so.
DO NOT just move it because you don't want to lose, or you will take out your own account very quickly.
⚠️ Risk:Reward & Win-Rate CheatsheetThe reward to risk ratio (RRR, or reward risk ratio) is maybe the most important metric in trading and a trader who understands the RRR can improve his chances of becoming profitable. Basically, the reward risk ratio measures the distance from your entry to your stop loss and your take profit order and then compares the two distances. Traders who understand this connection can quickly see that you neither need an extremely high winrate nor a large reward:risk ratio to make money as a trader. As long as your reward:risk ratio and your historical winrate match, your trading will provide a positive expectancy.
🔷 Calculating the RRR
Let’s say the distance between your entry and stop loss is 50 points and the distance between the entry and your take profit is 100 points .
Then the reward risk ratio is 2:1 because 100/50 = 2.
Reward Risk Ratio Formula
RRR = (Take Profit – Entry ) / (Entry – Stop loss)
🔷 Minimum Winrate
When you know the reward:risk ratio for your trade, you can easily calculate the minimum required winrate (see formula below).
Why is this important? Because if you take trades that have a small RRR you will lose money over the long term, even if you think you find good trades.
Minimum Winrate Formula
Minimum Winrate = 1 / (1 + Reward:Risk)
👤 @AlgoBuddy
📅 Daily Ideas about market update, psychology & indicators
❤️ If you appreciate our work, please like, comment and follow ❤️

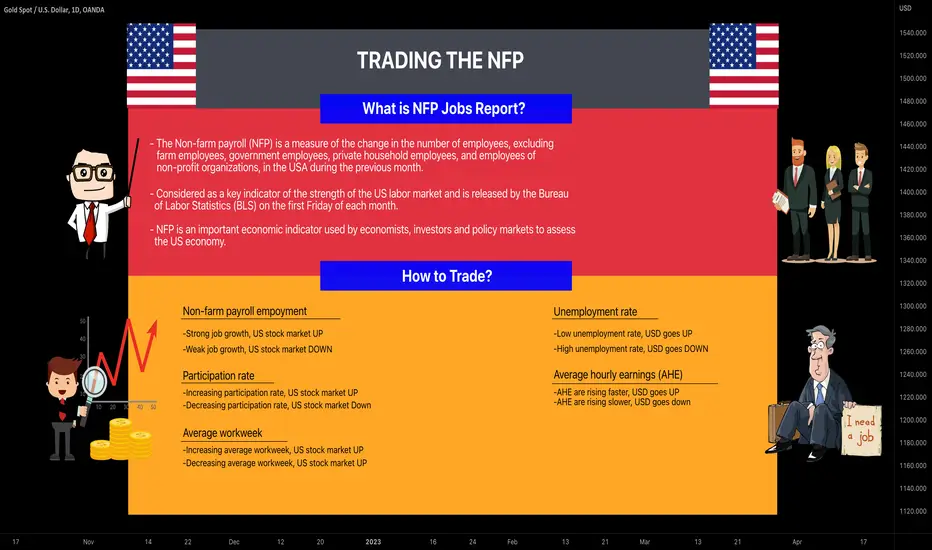
What is Non-Farm Payroll and How to Trade It? 📚
Hey traders,
This week, on Friday, we are expecting Non-Farm Payroll Report.
In this educational article, I will try to explain to you why that fundamental data is so important
and I will share with you the insights how to trade it.
Non-Farm Payroll is one of the most important indicators for forex and stock markets in the economic calendar.
Being released on the first Friday of each month by the Bureau of Labor Statistics (BLS), it shows the number of new jobs created by the US economy during the previous month, excluding farm sector, government and not for profit organizations.
NFP accounts for 80% of the US gross domestic product work force.
The non-farm payroll is used by analysts to determine the current state of the economy and to predict the future activity levels.
For that reason, its release usually triggers volatile movements across all Us Dollar related financial instruments.
Being crucially important, remember that NFP is not the only figure released by the Bureau of Labor Statistics.
NFP is the part of the Employment Situation Report that also contains:
Unemployment rate,
Average hourly earnings,
Labor participation rate,
Average workweek.
The main reason, why newbie traders fail in trading NFP release is the fact that they completely neglect the figures of the Employment Situation Report.
Here are some tips how to properly interpret the figures in the report:
1) Non-farm payroll numbers.
It reflects the new jobs' creation pace.
Higher than predicted rate is usually positive for the US stock market,
while the weak rate usually affects that negatively.
2) Unemployment rate.
It reflects the number of unemployed people in relation to a total workforce.
Low unemployment rate is usually very positive for US Dollar,
while higher than expected unemployment quite negatively affects on USD.
3) Average hourly earnings.
It reflects the change of the labor cost.
The fast increase in the labor cost is usually positive for US Dollar,
while the slowing increase is considered to be a bearish indicator for USD.
4) Average weekly hours.
It reflects the average amount of paid working hours.
The increase in average weekly hours is considered to be a very positive factor for US stock market,
while its decrease is considered to be a negative one.
Trading NFP report, the one should consider all the figures from the Employment Situation Report.
All the numbers should be weighed properly and only then the predictions should be made.
Remember that volatility is higher than usual in the hours of news release, for that reason, be careful and never forget to set a stop loss.
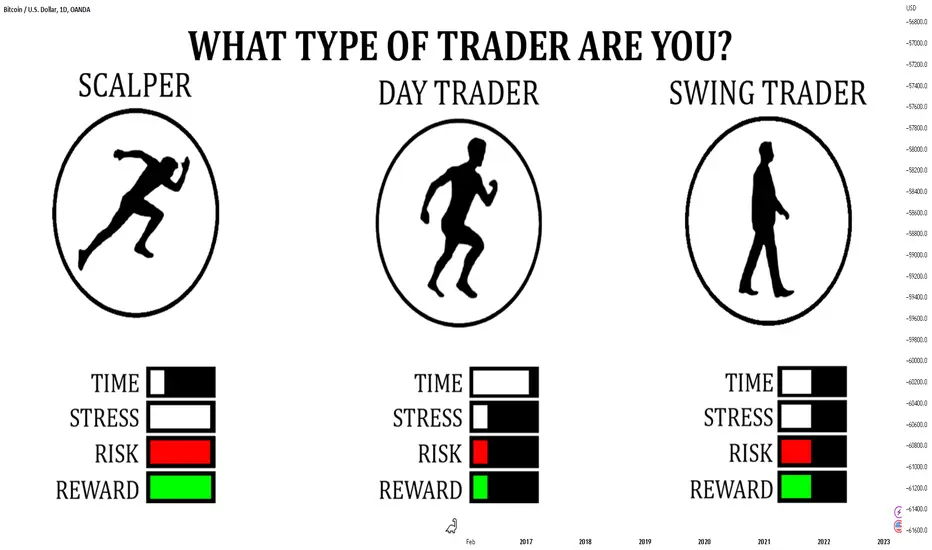
Scalping vs Day Trading vs Swing Trading | Learn What is Best
Knowing which trading style suits you best is a difficult question to answer, but the choice you make is not permanent. In fact, many novice traders will experiment with some or all of the various styles before settling on a method and strategy that suits their lifestyle and the funds they have to risk.
Scalping
The first trading style of this guide is called "scalping". Scalping is a form of trading where traders aim to achieve profits from relatively small price changes.
Scalpers enter and exit the financial markets within a short time-frame, which is usually a matter of a few seconds, or minutes (but the maximum is a few hours) and are known to use higher levels of leverage.
Day trading
Many traders think that day trading and scalping are similar. Although both trading styles do take place within one trading day, there are important differences that we need to highlight. Day traders open and close substantially less setups compared with scalpers. These traders sometimes open one setup a day, and often not more than a couple per trading day.
Although they both trade intraday, the day trader's strategy is to focus on the best opportunities of the day, and to hold on for a larger profit target. Therefore, a day trader usually holds on to a trade for several hours but not more than one full trading day.
Swing trading
The last trading style of our guide is called swing trading, which is a style in which traders enter and exit sporadically, holding trades over a few days or weeks. Swing trading is a system whereby traders are aiming for intermediate-term trading opportunities, and is significantly different to long-term trading.
Whichever trading style applies to you, it's important to find out, as the trading style you choose will have a profound effect on your trading outcomes and your ultimate profitability.
✅LIKE AND COMMENT✅
Please, like this post and subscribe to our tradingview page!👍
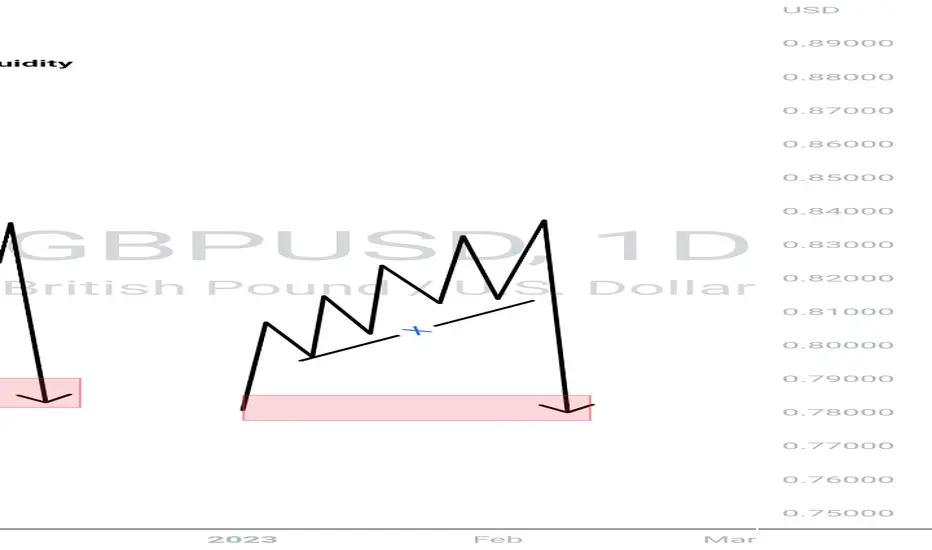
Liquidity concept pt2Always understand the liquidity concept...like I said before,the market moves from one pocket of liquidity to another... understanding where liquidity are ,will help you in your trading journey
#IamACE #ACE.the trader
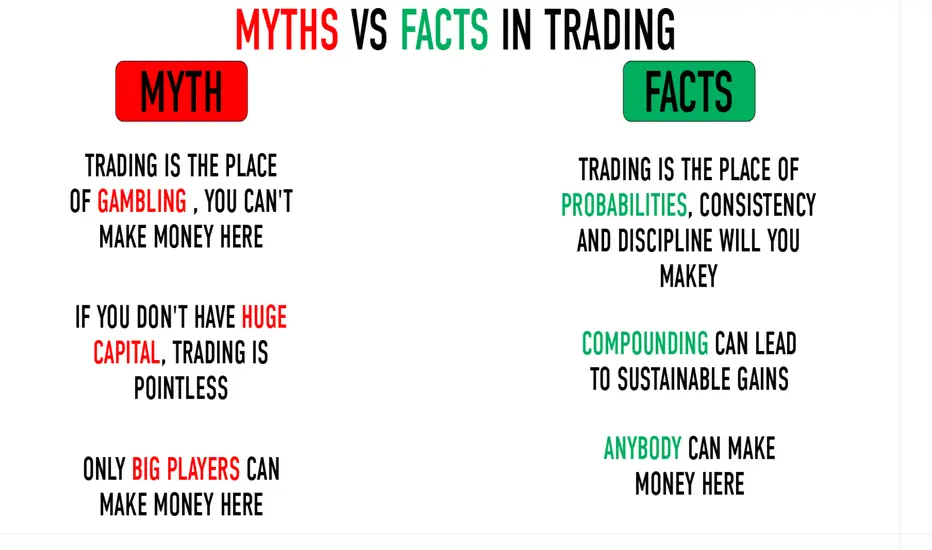
😎MYTHS ABOUT TRADING BUSTED😎
⚛️The world of trading is full of myths and misconceptions. We often hear stories of overnight successes and devastating losses. It can be difficult to separate truth from fiction when it comes to trading. In this article, we will debunk some of the most common trading myths and provide the facts to help you make better investment decisions.
❌Myth: Trading is Gambling
✅Fact: Trading involves analyzing market trends, researching companies and industries, and making informed decisions based on data. Successful traders do not simply rely on luck; they systematically evaluate risk and reward before making trades.
❌Myth: You Need to be a Financial Expert to Trade
✅Fact: While a basic understanding of the market is important, you do not need a degree in finance to be a successful trader. There are numerous resources available to help beginners learn the basics of trading, including online courses, tutorials, and mentorship programs.
❌Myth: Day Trading is the Best Way to Make Money Quickly
✅Fact: Day trading involves buying and selling assets within a single trading day in order to profit on short-term price movements. While it can be lucrative, it is also risky and requires significant time and effort. Many successful traders prefer to take a long-term approach, focusing on investments that will appreciate over time.
❌Myth: You Need a Lot of Money to Start Trading
✅Fact: While having a larger investment portfolio can certainly provide more opportunities for profit, you do not need a huge amount of money to start trading. Many online brokers offer low minimum account balances, making it easier for beginners to start investing.
❌Myth: Trading is Only for the Wealthy
✅Fact: Trading is accessible to anyone with an internet connection and a willingness to learn. While high net worth individuals may have more resources to invest, anyone can start trading with a little bit of research and a willingness to take calculated risks.
❌Myth: Technical Analysis is the Only Way to Predict Market Trends
✅Fact: Technical analysis involves analyzing charts and data to predict future market trends. While it can be a valuable tool, it is not the only way to make informed trading decisions. Fundamental analysis, which involves evaluating a company's financial health and growth potential, is equally important.
❌Myth: Trading is a Solo Endeavor
✅Fact: Trading can be a solitary activity, but it is important to take advantage of opportunities to learn from and collaborate with other traders. Online forums like Tradingview, mentorship programs, and networking events can all provide valuable insights and support.
✳️In conclusion, there are many myths surrounding trading that can prevent individuals from taking advantage of its potential benefits. By separating fact from fiction, traders can make informed decisions and increase their chances of success. Whether you are a seasoned investor or a beginner, knowledge and education are essential to achieving your financial goals.
Thanks for reading bro, you are the best☺️
Like, comment and subscribe to boost your trading!
Dear followers, let me know, what topic interests you for new educational posts?
ELON MUSK QUOTES FOR POWERFUL THINKING
Elon Musk is today's Nikola Tesla. Here are 11 Elon Musk quotes to make you start working on your dreams, no matter how impossible they might seem.
“I do think there is a lot of potential if you have a compelling product and people are willing to pay a premium for that. I think that is what Apple has shown. You can buy a much cheaper cell phone or laptop, but Apple’s product is so much better than the alternative, and people are willing to pay that premium.”
“When something is important enough, you do it even if the odds are not in your favor.”
“What makes innovative thinking happen?… I think it’s really a mindset. You have to decide.”
“I’ve actually not read any books on time management.”
“It’s OK to have your eggs in one basket as long as you control what happens to that basket.”
“The first step is to establish that something is possible; then probability will occur.”
“I wouldn’t say I have a lack of fear. In fact, I’d like my fear emotion to be less because it’s very distracting and fries my nervous system.”
“I say something, and then it usually happens. Maybe not on schedule, but it usually happens.”
“If you get up in the morning and think the future is going to be better, it is a bright day. Otherwise, it’s not.”
“As much as possible, avoid hiring MBAs. MBA programs don’t teach people how to create companies.”
“It’s very important to like the people you work with, otherwise life your job is gonna be quite miserable.”
Remember that your mindset is 80% of your future success, dear traders.
🌺Hope u like my article. Please let me know what you think💋
Love, Anabel❤️
Please, support my work with like and comment!
Love you, my dear followers!👩💻🌸

THE TYPICAL WEEK OF A TRADER 🗓
In this educational article, I will teach you how to properly plan your trading week.
Sunday.
While the markets are closed, it is the best moment to prepare the charts for next week.
First of all, charts should be cleaned after the previous trading week: multiple setups and patterns become invalid or simply lose their significance and their stay on the charts will only distract.
Secondly, key levels: support and resistance, supply and demand zones and trend lines should be updated. Similarly to patterns, some key levels become invalid after a previous week, for that reason, structures should be reviewed.
Monday.
Analyze the market opening, go through your watch list and check the reaction of the markets.
Flag / mark the trading instruments that you should pay a close attention to. Set alerts and look for trading setups.
Tuesday. Wednesday. Thursday.
If you opened a trading position, keep managing that.
Pay attention to your active trades, go through your watch list and monitor new trading setups.
Friday.
Assess the entire trading week. Check the end result, journal your winning and losing trades. Work on mistakes.
Decide whether to keep holding the active position over the weekend or look for a way to exit the market before it closes.
Saturday.
Stay away from the charts. Meditate, relax and chill while the markets are closed.
Trading for more than 9-years, I found that such a plan is the optimal for successful full-time / part-time trading. Try to follow this schedule and let me know if it is convenient for you
❤️Please, support my work with like, thank you!❤️

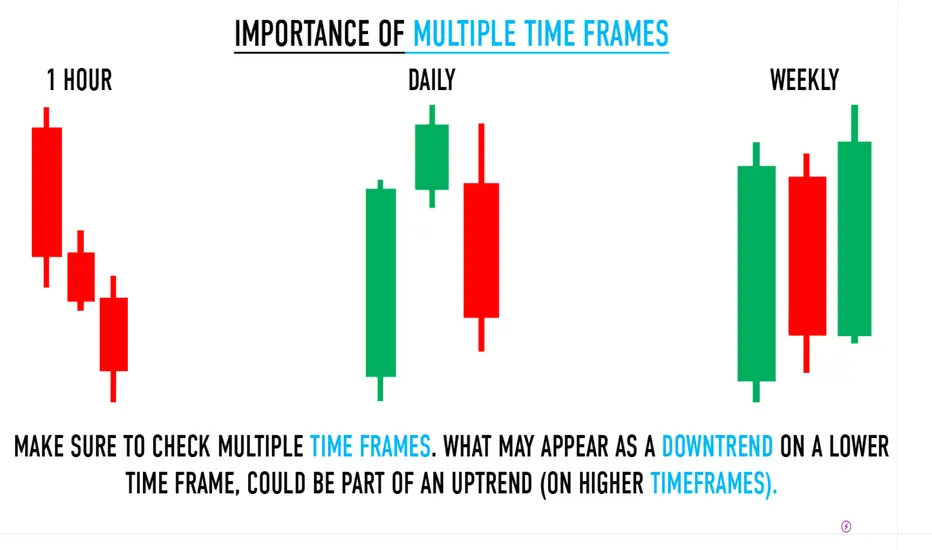
Multiple Time Frames Can Multiply Returns
In order to consistently make money in the markets, traders need to learn how to identify an underlying trend and trade around it accordingly.
Multiple time frame analysis follows a top-down approach when trading and allows traders to gauge the longer-term trend while spotting ideal entries on a smaller time frame chart. After deciding on the appropriate time frames to analyze, traders can then conduct technical analysis using multiple time frames to confirm or reject their trading bias.
Multiple time frame analysis, or multi-time frame analysis, is the process of viewing the same currency pair under different time frames. Usually the larger time frame is used to establish a longer-term trend, while a shorter time frame is used to spot ideal entries into the market.
HOW TO IDENTIFY THE BEST FOREX TIME FRAME?
Many traders, new and experienced, want to know how to identify the best time frame to trade forex. In general, traders should select a time frame in accordance with:
the amount of time available to trade per day
the most commonly used time frame utilized to identify trade set ups.
For example, day traders typically have the whole day to monitor charts and therefore, can trade with really small time frames. These range anywhere from a one-minute, to the 15-minute, to the one-hour time frame. Day traders that identify their trade set ups on the one-hour time frame can then zoom into the 15-minute time frame to spot ideal market entries.
Multiple time frame analysis usually produces high win rate, guaranteeing very limited risk.
Dear followers, let me know, what topic interests you for new educational posts?
Learn The Most Accurate Price Action Pattern
Hey traders,
If you are learning price action trading, you definitely must know a double bottom pattern.
Double bottom is a reversal pattern.
It is applied to spot early market reversal clues and catch the initiation of a new bullish trend .
Preconditions for a double bottom:
1️⃣ The market must trade in a bearish trend .
2️⃣ After a formation of the last lower high, the price must set equal low.
3️⃣ The price must return back to the last lower high level.
✅Once these conditions are met the pattern is considered to be completed.
The formation of the pattern is considered to be a ⚠️WARNING sign.
Even though many traders buy the pattern once it is completed,
for me it is not enough.
❗️Remember that the price can easily start to consolidate and form a horizontal channel for example.
The trigger that we will look for is the breakout (candle close above) the last lower high level (based on a wick and its highest candle close) - the neckline.
Being broken to the upside, the market sets a new higher high.
It signifies a violation of a current bearish trend .
⬆️Attempting to catch an initiation of a bullish trend , we will buy the market with a buy limit order on a retest of a broken neckline.
❌Safest stop will lie below the lows of the pattern.
💰Your reward must be at least 1.5 of your risk.
Following these simple rules, you will be impressed by how accurate this pattern is!
Let me know, traders, what do you want to learn in the next educational post?

How to use Fibonacci Retracements for Trading and InvestingIntroduction
The Fibonacci sequence is a series of numbers that starts with 0 and 1, and each subsequent number is the sum of the two preceding numbers. The sequence goes like this: 0, 1, 1, 2, 3, 5, 8, 13, 21, 34, 55, 89, 144, 233, 377, and so on.
The sequence is named after Leonardo of Pisa, an Italian mathematician from the Middle Ages who was also known as Fibonacci. He introduced the sequence to the Western world in his book Liber Abaci, which he wrote in 1202.
However, the sequence had already been discovered by Indian mathematicians several centuries earlier. It was used in ancient Indian mathematics to solve problems related to the breeding of rabbits, which is why the sequence is sometimes called the "rabbit sequence".
The Fibonacci sequence has since become a widely studied and applied concept in mathematics, science, and finance. It is used to model a wide range of natural phenomena, including the growth patterns of plants, the breeding habits of animals, and the structure of galaxies.
In trading and investing, Fibonacci retracements are used to identify potential levels of support and resistance in a market or investment. These levels are based on the percentage of a previous price movement that has been retraced. For example, if a stock price has risen from $50 to $100, and then retraces 50% of that move, the 50% retracement level is considered a potential level of support.
Understanding Fibonacci retracements
To create Fibonacci retracement levels, traders use the high and low points of a previous price movement. For example, if a stock has recently traded from $50 to $100, the high point is $100 and the low point is $50. Traders then draw horizontal lines at various levels between the high and low points, based on the Fibonacci sequence. The most common retracement levels are 38.2%, 50%, and 61.8%, although some traders also use 23.6% and 78.6%.
Calculating Fibonacci retracements is relatively simple. To calculate the 38.2% retracement level, for example, you take the difference between the high and low points and multiply it by 0.382. You then subtract this number from the high point to get the retracement level. For the 50% retracement level, you multiply the difference by 0.5, and for the 61.8% retracement level, you multiply by 0.618.
Using Fibonacci retracements for trading
Fibonacci retracements can be used to identify potential levels of support and resistance in a market. For example, if a stock price is in an uptrend and begins to pull back, traders may look for potential support levels based on Fibonacci retracements. If the price retraces to the 38.2% level, for example, this may be seen as a potential level of support. If the price continues to fall and reaches the 50% or 61.8% level, these levels may also be seen as potential support levels.
Similarly, in a downtrend, traders may use Fibonacci retracements to identify potential resistance levels. If the price is in a downtrend and begins to rally, the 38.2%, 50%, and 61.8% retracement levels may be seen as potential levels of resistance.
Fibonacci retracements can also be used in range-bound markets. If a stock price is moving sideways between a support and resistance level, traders may use Fibonacci retracements to identify potential levels within the range where the price may bounce.
Another way to use Fibonacci retracements for trading is in range-bound markets. In this type of market, prices may move up and down within a specific range, with no clear trend. In these cases, Fibonacci retracements can be used to identify potential areas of support and resistance within the range. Traders can use Fibonacci retracements to identify buy and sell signals at these levels.
It's important to note that Fibonacci retracements should not be used in isolation, as they can produce false signals. To confirm signals generated by Fibonacci retracements, traders often use other technical indicators, such as moving averages, momentum oscillators, or volume indicators. For example, if a trader sees a retracement to a Fibonacci level and the price is also above the 50-day moving average, this could confirm a bullish signal and increase the likelihood of a successful trade.
Using Fibonacci retracements for longer-term investments
In addition to trading, Fibonacci retracements can also be used for investing. Long-term investors can use Fibonacci retracements to identify potential entry and exit points for their investments. For example, if a stock has experienced a significant upward trend, and then pulls back to a Fibonacci level, this could indicate a potential buying opportunity. Conversely, if a stock has reached a resistance level at a Fibonacci retracement level, this could be a signal to sell.
Conclusion
ibonacci retracements are a popular technical analysis tool used by traders and investors to identify potential support and resistance levels. By understanding the Fibonacci sequence and how to calculate and plot retracement levels on a chart, traders and investors can use these levels to make more informed trading and investment decisions. However, it's important to remember that Fibonacci retracements should not be used in isolation and should be used in conjunction with other technical indicators and fundamental analysis. With a thorough understanding of how to use Fibonacci retracements, traders and investors can incorporate this tool into their overall strategy to increase the likelihood of successful trades and investments.

Top10 Mistakes to avoid as a New TraderIntroduction
When starting out as a trader or investor, it is important to be aware of the mistakes that can be made. Mistakes are common, and even experienced traders and investors make them from time to time. However, new traders and investors are particularly vulnerable to making mistakes, which can lead to significant losses. In this article, we will discuss the top 10 mistakes to avoid as a new trader or investor, and provide tips on how to avoid them.
Mistake 1: Lack of education
One of the biggest mistakes that new traders and investors make is not educating themselves about the markets they are investing in. It is important to have a basic understanding of the financial markets, including the stock market, foreign exchange market, and commodity markets.
Before making any trades or investments, new traders and investors should spend time learning about the different financial instruments, such as stocks, bonds, and options. They should also understand the basic concepts of fundamental and technical analysis, which can help them identify profitable trades.
There are many educational resources available to new traders and investors, including books, online courses, and seminars. Some of the most popular books on investing include "The Intelligent Investor" by Benjamin Graham, "The Little Book of Common Sense Investing" by John Bogle, and "A Random Walk Down Wall Street" by Burton Malkiel.
Mistake 2: Failure to set goals
Many new traders miss out on setting goals. Having clear and realistic goals is important in trading or investing because it helps traders and investors stay focused and motivated.
Some common goals for new traders and investors include building wealth, generating passive income, and achieving financial independence. Goals should be specific, measurable, achievable, relevant, and time-bound (SMART). For example, a SMART goal for a new investor could be to earn a 10% return on their investment within the next 12 months.
Mistake 3: Emotion-based decision making
Emotions can be a trader's worst enemy. Fear, greed, and hope can all cloud judgement and lead to poor decision-making. New traders and investors are particularly vulnerable to emotional biases, such as the tendency to hold on to losing trades for too long or to sell winning trades too quickly.
To avoid emotional biases, new traders and investors should develop a trading plan and stick to it. They should also set stop-loss orders, which are orders to automatically sell a security when it reaches a certain price, to limit their losses.
Mistake 4: Not having a plan
New traders and investors often make the mistake of trading without a plan. A trading plan is a written set of rules that outlines a trader's entry and exit criteria, risk management strategy, and other important factors.
A trading plan should include the trader's goals, risk tolerance, and trading strategy. It should also outline the types of securities the trader will invest in and the timeframe for holding those securities. A trading plan is important because it helps traders avoid impulsive decisions and stick to a consistent strategy.
Mistake 5: Lack of diversification
Another common mistake that new traders and investors make is failing to diversify their portfolio. Diversification involves spreading your investments across different asset classes and industries, which can help to mitigate risk and protect your portfolio against losses.
For example, if you invest all of your money in a single stock or industry, you run the risk of losing everything if that stock or industry experiences a significant downturn. However, by diversifying your portfolio, you can help to reduce your exposure to any one particular investment and increase your chances of long-term success.
There are many ways to diversify your portfolio, such as investing in a mix of stocks, bonds, and mutual funds, or investing in companies across different industries and sectors.
Mistake 6: Chasing trends
Chasing trends is a pitfall that many undisciplined traders make and this also happens to professionals. This can be dangerous and lead to significant losses. Chasing trends involves investing in a stock or asset solely because it has recently experienced a significant increase in price, without considering the underlying fundamentals of the investment.
While it may be tempting to jump on board with a hot trend, it's important to remember that these trends are often short-lived and can quickly reverse direction. As a result, investing in a trend without doing your due diligence can result in significant losses.
Instead of chasing trends, focus on identifying investments with strong fundamentals, such as a history of consistent earnings growth or a solid balance sheet. By investing in quality companies with a proven track record, you can increase your chances of long-term success.
Mistake 7: Overtrading
New traders and investors tend to 'overtrade'. Overtrading involves making too many trades or investments, often based on emotional impulses or a desire to make a quick profit.
While it may be tempting to try to make as many trades as possible, overtrading can be harmful to your portfolio. Each trade comes with associated fees and commissions, which can add up quickly and eat into your profits. Additionally, making too many trades can increase your exposure to risk and volatility, which can lead to significant losses.
Instead of overtrading, focus on making well-informed, strategic trades based on your plan and goals. By being patient and selective with your trades, you can increase your chances of long-term success.
Mistake 8: Ignoring risk management
One of the most common mistakes new traders and investors make is ignoring risk management. Risk management is the process of identifying, analyzing, and controlling potential risks associated with an investment or trade. This includes setting stop-loss orders, diversifying your portfolio, and understanding the potential risks associated with each investment.
Many new traders and investors focus on potential profits and forget to consider the risks involved. This can lead to significant losses and can quickly wipe out an entire investment account.
There are several ways to manage risk, including setting stop-loss orders, diversifying your portfolio, and conducting thorough research on each investment opportunity. Stop-loss orders are an effective tool to limit potential losses on any given trade. Diversification is also an effective way to manage risk by spreading your investments across different asset classes, such as stocks, bonds, and commodities.
By ignoring risk management, new traders and investors increase the likelihood of experiencing significant losses. It is important to be proactive in managing risk and to always be mindful of the potential downside of any investment.
Mistake 9: Focusing too much on short-term gains
New traders and investors are focusing too much on short-term gains. While it is natural to want to see immediate returns on your investments, it is important to keep a long-term perspective in mind. Focusing too much on short-term gains can lead to impulsive decision-making and can cause investors to overlook the potential long-term value of an investment.
Short-term gains are often associated with higher risk, and it is important to remember that high risk can lead to high losses. By focusing solely on short-term gains, new traders and investors may overlook quality investments that have the potential for long-term growth and stability.
It is important to balance short-term gains with a long-term perspective. This means taking the time to research potential investments, identifying investments that align with your overall investment goals, and being patient with the investment process.
Mistake 10: Lack of patience
Finally, one of the biggest mistakes new traders and investors make is a lack of patience. Patience is critical in trading and investing, as it takes time to see returns on your investments. It is important to remember that investing is a marathon, not a sprint.
Many new traders and investors are eager to see quick returns on their investments, and they often become impatient when they don't see immediate results. This can lead to impulsive decision-making and can cause investors to sell their investments prematurely, often at a loss.
It is important to remember that successful investing takes time and patience. By taking the time to research potential investments, setting realistic expectations, and being patient with the investment process, new traders and investors can avoid making hasty decisions that can lead to significant losses.
Conclusion
In summary, trading and investing can be a rewarding and lucrative endeavor, but it is important to avoid common mistakes that can lead to significant losses. By educating yourself, setting goals, managing your emotions, having a plan, diversifying your portfolio, avoiding trend chasing, avoiding overtrading, managing risk, focusing on the long-term, and being patient, you can increase your chances of success as a new trader or investor.
Remember, the key to success is to approach trading and investing with a long-term perspective and to be mindful of the potential risks and rewards associated with each investment opportunity. By avoiding these common mistakes and staying disciplined in your approach, you can achieve your financial goals and enjoy a successful trading and investing career.

6 Character Traits to Develop or Refine Your Day Trading Career
It may seem as if developing a career in forex day trading is about finding a strategy, practicing it regularly, and making bundles of money. Yes, it is about that. But, where are our characteristics on that list? To become a successful day trader, you need to develop specific features to implement an effective strategy that delivers results in all market conditions.
We may not be entirely aware, but we do use them daily, and maybe, at times, we notice that we should work more on developing these. These characteristics are innately a part of us. It is essential to work on developing these characteristics that guide you towards building a thriving day trading career.
It is good to know that not all successful day traders inherently have the ability to succeed without hard work. For most, it takes weeks, months, and years. By continuing to read, you will realize why you should develop the skills sooner rather than later.
1. Discipline
Discipline requires boundaries and mental acceptance. It’s one of the many characteristics used to achieve in day trading. Even though some beg to differ – they say that a well-developed trading plan was their way to success. But how disciplined are they to follow it?
Being disciplined is vital when deciding which products to trade. Thousands of products are traded throughout the day, and It is very overwhelming with infinite opportunities thrown to you at once. Devise a schedule that revolves around the best times for you to trade. Select a product to trade and stick to both the product and your plan.
2. Patience
If you haven’t started trading yet, you will soon realize that it is a “waiting game” with loads of patience needed – but with fantastic profit too. It can be challenging for beginner traders who don’t have enough patience and find it challenging to wait or watch the markets. If you enter the market at a time when nothing is happening, you may blame your luck and try to jump in or out of the tradestoo early. You may land up building resentment, and it will not suffice.
3. Adaptability
Change is a characteristic that is either always welcomed or never welcomed at all. When becoming a trader, you will accept that day trading as a career is ever-changing. To be a successful trader, you will have to work through some discomfort to adapt to fluctuations quickly. It is extremely rare to have two trading days that are the same or similar to one another, which means you must adjust to different scenarios in the market.
4. Mental Strength
Day trading is about gaining the mental strength that can withstand the losses that the market throws at you. Some days there can be no losses thrown at you, yet on other days, this is all you will see, and it can be soul-destroying. More positively, there will be times when you are on a losing streak, and it’s at this stage when the pro traders are looking for opportunities to bounce back. Do not be disheartened if you are disappointed after losing a trade or if your strategy isn’t delivering the results you expect.
5. Let Go
Preparations for your losses don’t mean that you should continue grinding it out on the market and continue to lose your capital. If your mental strength gives you the courage to walk away from the suffering of your continuous losses – do that! Walk away!
6. Independence
At the beginning of your trading career, it is a good idea to reach out to fellow traders and mentors to help you with the building blocks. These contacts will recommend trading videos, podcasts, books, forums, and articles to build your skills and confidence. However, if you want your trading career to take off smoothly, then learn some of the critical skills by yourself. Develop a sense of independence, where you do not rely on others. Having to rely on help or opinions all the time is tiresome.
Once you have developed a trading strategy that works, you should not listen to every opinion from others. Be focused on doing what works for you.
Thanks for reading bro, you are the best☺️
Like, comment and subscribe to boost your trading!
Hey traders, let me know what subject do you want to dive in in the next post

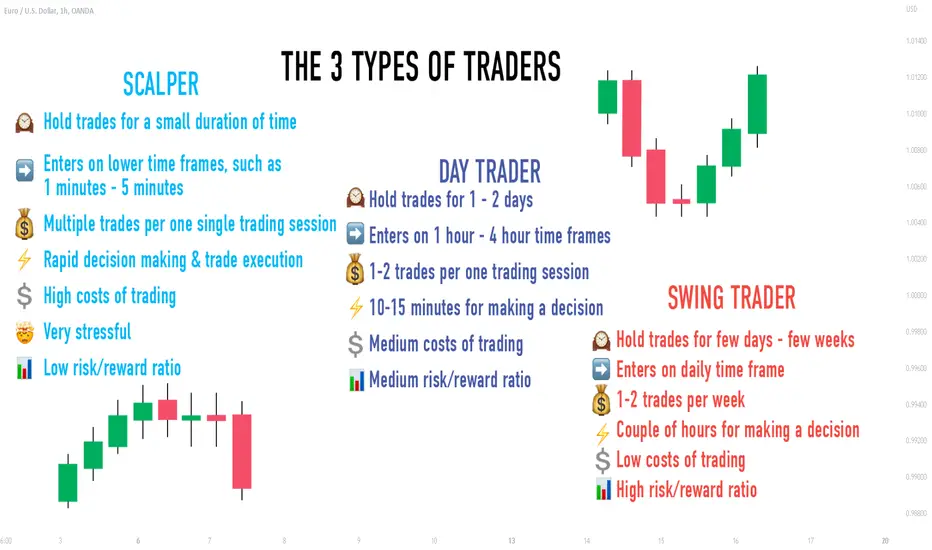
Scalper, Day Trader & Swing Trader | Choose Your Path
There are thousands of different ways to trade the market.
During the last 100 years, various trading strategies and techniques were invented.
One of the ways to categorize them is to split them by types of traders.
Such a category type will lean on 2 main elements:
trading frequency and time frame selection.
1️⃣ - Scalper
I guess 99% of newbie traders start from scalping.
Trying to catch quick market moves and become rich quick,
newbies are practicing different scalping strategies.
What is funny about scalping is the fact that such a trading style is considered to be the easiest by the majority while remaining one of the hardest in the view of pros.
The main obstacle with scalping is a constant focus and rapid decision-making.
Scalpers usually open dozens of trading positions during the trading session, most of the time being in front of the screen constantly.
Paying huge commissions to the broker and dealing with complete chaos on lower time frames, the majority simply can't survive the pressure and drop, leaving the pie to true gurus.
2️⃣ - Day Trader
Day trading or intraday trading is the most appealing to me.
Staying relatively active, the market gives some time for the trader for reflection & thinking.
Opening and managing on average 1-2 trades per trading session, the intraday trader is granted a certain degree of freedom.
However, with declining volatility , quite ofter intraday traders get a relatively low risk/reward ratio for their trades,
3️⃣ - Swing Trader
Swing trading is the best choice for traders having a full-time job.
Primarily being focused on daily/weekly time frames, swing trading is not demanding for a daily routine and aims at catching mid-term/long-term market moves.
With an average holding period being around 2 weeks and opening 1-2 trading positions per week, swing trading is considered to be the least emotional and involves low risk.
The main problem with swing trading is patience.
Correctly identifying the market trend and opening a trading position,
the majority tends to close their positions preliminary not being patient enough to let the price reach their target.
Which trading type do you prefer?
Let me know, traders, what do you want to learn in the next educational post?
The fastest area of wealth accumulation in the world-the forexAn investment field where one opportunity is enough to change one's destiny!
A market that works miracles every day!
Entering the new century, foreign exchange, an investment tool with infinite charm, is attracting the attention of more and more people. This market full of opportunities and challenges is changing our destiny all the time, so much so that it is loved by more and more people.
Advantages of the foreign exchange market:
1.Low threshold for investment amount;
2.The investment period can be long or short, buy and sell as you go, and the liquidity is extremely high.
3.The highest return on investment, you can get more than several times the amount of investment funds.
4.The transaction procedures are quick and easy. You only need to enter the transaction procedures, which can be completed in a very short time.
5.Trading flexibility is high, and there are many profit opportunities in the dual-track of buying long and selling short.
6.The impact environment is relatively fair, the information channels are smooth, and it will not be operated by large companies. The principles of fairness, impartiality, and openness are guaranteed. There are many factors that affect it, and the relationship between supply and demand has a great impact.
7.The degree of risk is relatively high, but foreign exchange trading operations are flexible, mobile, rapid, and risks can be controlled and prevented.
How to quickly accumulate wealth with small funds:
1. Survival first, development second.
2. Only do short-term intraday trading.
3. Operate no more than 5 times a day, and try not to place orders after the daily profit exceeds US 1,000.
4. Only 2-3 varieties are made every day.
In the trading process, at the same time, establish that opportunities are available every day, and you need to maintain the concept of waiting patiently for opportunities, and overcome the impatience of eager to win; at the same time, make rational use of stop losses, establish the concept of safety in the bag, and turn floating profits into real profits in a timely manner.After trading, find the time period when you make the most profit every day, try to give full play to your advantages in this time period, and summarize your experience every day to continuously improve your tactics.
The three most worthwhile potential coins to invest in in 2023Today, I will reveal what I think is the best cryptocurrency portfolio in 2023.I think this portfolio will be the best altcoin in 2023.
1.Arweave (AR)
Arweave is a Blockchain-based decentralized platform that provides a permanent and tamper-proof data storage solution.It was launched in 2017 by a group of developers led by Sam Williams.The platform aims to solve the problem of data persistence by providing a cost-effective permanent data storage solution that is accessible to everyone.
A key feature of Arweave is that it uses a new consensus mechanism called proof of access (PoA).This mechanism is designed to be more energy-efficient than traditional proof-of-work (PoW) or proof-of-stake (PoS) mechanisms, and also allows faster transaction times.The working principle of PoA is to require nodes to prove that they have stored a certain amount of data on the Arweave network in order to participate in the consensus process.
Arweave also has a unique economic model designed to motivate data storage on the network.The platform uses a local cryptocurrency called AR to pay for storage.AR is also used to reward nodes that participate in the consensus process, which helps ensure the security and reliability of the network.As of March 2023, AR has a market capitalization of more than 1.5 billion US dollars.
A significant use case of Arweave is the creation of a decentralized social media platform.Since the data stored on Arweave is permanent and immutable, it provides a feasible alternative to traditional centralized social media platforms that are vulnerable to censorship and data leakage.
In short, Arweave is a blockchain-based platform that provides a cost-effective permanent data storage solution.Its unique consensus mechanism and economic model have helped it gain attention in the blockchain community, and have the potential to revolutionize the way we store and access data in the future.
2.Chainlink (LINK)
Chainlink (LINK) is a decentralized oracle network designed to connect smart contracts to real-world data so that they can interact with the outside world in a safe and reliable way.Launched in 2017, Chainlink has quickly become one of the most popular blockchain projects, with a market capitalization of more than US10 billion as of March 2023.
The idea behind Chainlink is to solve the trust problem in smart contracts.A smart contract is a self-executing program that runs on the blockchain and is designed to be executed automatically when certain conditions are met.However, these conditions are usually based on data outside the blockchain, such as stock prices or weather data.In order to ensure the accuracy and immutability of this data, smart contracts need to rely on oracles.
The oracle is a third-party service that can provide the data required for the execution of smart contracts.However, these oracles can be centralized, which means they are vulnerable to manipulation or attack.Chainlink tries to solve this problem by creating a decentralized oracle network that can provide reliable and secure data for smart contracts.
Chainlink works by connecting smart contracts to multiple nodes in its network.These nodes are operated by independent operators, who are motivated to provide accurate data by earning LINK tokens (the native cryptocurrency of the Chainlink network).When a smart contract needs data, it sends requests to multiple nodes in the network.The node then provides its own data, which is aggregated and verified by the Chainlink protocol to ensure accuracy and consistency.
One of the key features of Chainlink is its ability to provide data from off-chain sources (such as APIs and Web services).This means that smart contracts can be connected to a wide range of data sources, including traditional financial markets, weather services, and social media platforms.
Chainlink is also very popular in the field of decentralized finance (DeFi), it is used to provide reliable and secure price information for various DeFi protocols.This price information is essential to determine the value of various assets and execute transactions in the DeFi ecosystem.
In addition to technical features, Chainlink also has a strong and active community of developers and supporters.The project is led by Sergey Nazarov and Steve Ellis, who have a long history in the field of blockchain and smart contracts.Chainlink has also established partnerships with many large companies, including Google, Oracle, and SWIFT, which has helped increase its visibility and adoption.
In general, Chainlink is a promising project that aims to solve an important problem in the blockchain field.Its decentralized oracle network has the potential to revolutionize the way smart contracts interact with the outside world, and its growing ecosystem of developers and supporters shows that it will continue to be a major player in the blockchain industry in the coming years.
3.Uniswap(UNI)
Uniswap is one of the most popular decentralized exchanges in the cryptocurrency market.Uniswap is a decentralized exchange (DEX) built on the Ethereum blockchain, allowing users to trade Ethereum-based tokens without the need for intermediaries or central institutions.It was created by Hayden Adams in November 2018 and has since become one of the most widely used DEX in the cryptocurrency space.
The core of Uniswap is the use of an automatic market maker (AMM) system, which means it relies on a set of algorithms to determine the price of a given asset.This is in stark contrast to traditional centralized exchanges, which usually use order books to match buyers and sellers and determine asset prices.
The Uniswap agreement has two main components: the liquidity pool and the Uniswap token (UNI).The liquidity pool is a place where users can deposit their tokens to provide liquidity to the exchange. In return, they can get a portion of the transaction fees generated by the platform.On the other hand, Uniswap tokens are used for governance and allow holders to vote on important decisions related to the agreement.
As of March 2023, Uniswap has been rated as one of the top decentralized exchanges, and the market capitalization of UNI tokens exceeds US 10 billion, making it one of the top 25 cryptocurrencies by market capitalization.
One of the main advantages of using Uniswap is its decentralized nature, which means that it will not be subject to the same risks as centralized exchanges, such as hacking or government intervention.In addition, since Uniswap is built on the Ethereum blockchain, it benefits from the security and reliability of the Ethereum network.
Having said that, there are also some risks in using Uniswap.For example, the value of tokens held in the liquidity pool may fluctuate significantly depending on market conditions, which may cause liquidity providers to suffer losses.In addition, since Uniswap is a decentralized platform, there is no central authority to supervise the platform, which means that users need to be careful to avoid fraud.
Overall, Uniswap is a powerful and popular decentralized exchange that provides a series of benefits for cryptocurrency traders and investors.However, as with any investment in the cryptocurrency space, it is important to conduct your own research and carefully consider the risks before investing.
In order to facilitate everyone to continue to follow up on my analysis and sharing, you can like and follow me; in addition, I will share the daily real-time strategy in the channel. If you can't follow up in real time, you may make operational errors.You can use the following methods to enter my channel for free to follow the latest news and follow up on market trends in real time.

Top 10 Technical Indicators for Successful TradingTop 10 technical indicators for successful trading
Introduction:
Technical indicators are essential tools for traders to analyze market trends, identify potential trading opportunities, and manage risk. These indicators are mathematical calculations based on past price and volume data that can help traders make informed decisions about buying or selling assets. In this article, we'll discuss the top technical indicators that traders can use to enhance their trading strategies.
Moving Average:
A moving average is a widely used technical indicator that helps traders identify market trends. A moving average is calculated by averaging the price of an asset over a specific period, such as 10 days or 50 days. This indicator smooths out the price data and makes it easier for traders to identify the direction of the trend. When the price is above the moving average, it's considered a bullish trend, and when the price is below the moving average, it's considered a bearish trend.
Relative Strength Index (RSI):
The Relative Strength Index (RSI) is a momentum oscillator that measures the strength of a price trend. The RSI is calculated by comparing the average gains and losses over a specific period, typically 14 days. The RSI value ranges from 0 to 100, with values above 70 indicating an overbought market, and values below 30 indicating an oversold market. Traders can use the RSI to identify potential trend reversals and overbought or oversold conditions in the market.
Bollinger Bands:
Bollinger Bands are another widely used technical indicator that helps traders identify potential trend reversals and price volatility. Bollinger Bands consist of three lines: a moving average in the center, and two outer bands that represent the standard deviation of the price data. When the price is within the bands, it's considered normal market volatility. However, when the price reaches the outer bands, it's considered an overbought or oversold condition, and a potential reversal may be imminent.
MACD (Moving Average Convergence Divergence):
The Moving Average Convergence Divergence (MACD) is a trend-following momentum indicator that helps traders identify changes in momentum and trend reversals. The MACD is calculated by subtracting the 26-day exponential moving average (EMA) from the 12-day EMA. A signal line, which is a 9-day EMA of the MACD, is also plotted on the chart. Traders can use the MACD to identify potential buy and sell signals, as well as divergences between the MACD and the price of the asset.
Fibonacci Retracements:
Fibonacci Retracements are a popular technical indicator that helps traders identify potential support and resistance levels. Fibonacci Retracements are based on the idea that prices tend to retrace a predictable portion of a move, after which they may continue in the original direction. Traders can use Fibonacci retracements to identify potential entry and exit points, as well as stop-loss levels.
Stochastic Oscillator:
The Stochastic Oscillator is another momentum oscillator that helps traders identify overbought and oversold conditions in the market. The Stochastic Oscillator is calculated by comparing the closing price of an asset to its price range over a specific period. The Stochastic Oscillator value ranges from 0 to 100, with values above 80 indicating an overbought market, and values below 20 indicating an oversold market. Traders can use the Stochastic Oscillator to identify potential trend reversals and overbought or oversold conditions in the market.
Average True Range (ATR):
Average True Range (ATR) is a technical indicator that measures the volatility of a stock or currency. Developed by J. Welles Wilder Jr., ATR calculates the average range of price movements over a specific period, taking into account gaps in price movements. ATR is typically calculated over a period of 14 days, but traders can adjust this period to fit their specific trading strategy.
To calculate ATR, traders first calculate the true range (TR), which is the greatest of the following:
Current high minus the current low
Absolute value of the current high minus the previous close
Absolute value of the current low minus the previous close
Once the true range is calculated, traders can calculate the ATR by taking an average of the true range over a specific period.
ATR can be used to measure volatility in the market, helping traders to identify potential trading opportunities. When ATR is high, it indicates that there is a lot of volatility in the market, which can present opportunities for traders to profit. Conversely, when ATR is low, it indicates that the market is relatively stable, and traders may want to avoid entering trades at that time.
Ichimoku Cloud:
The Ichimoku Cloud, also known as Ichimoku Kinko Hyo, is a technical indicator that provides a comprehensive view of potential support and resistance levels, trend direction, and momentum. The indicator was developed by Japanese journalist Goichi Hosoda in the late 1930s and has gained popularity among traders in recent years.
The Ichimoku Cloud consists of five lines, each providing a different view of the market:
Tenkan-Sen: This line represents the average of the highest high and the lowest low over the past nine periods.
Kijun-Sen: This line represents the average of the highest high and the lowest low over the past 26 periods.
Chikou Span: This line represents the current closing price shifted back 26 periods.
Senkou Span A: This line represents the average of the Tenkan-Sen and Kijun-Sen, shifted forward 26 periods.
Senkou Span B: This line represents the average of the highest high and the lowest low over the past 52 periods, shifted forward 26 periods.
The area between Senkou Span A and Senkou Span B is referred to as the "cloud" and is used to identify potential support and resistance levels. When the price is above the cloud, it indicates a bullish trend, and when the price is below the cloud, it indicates a bearish trend.
Traders can also use the Tenkan-Sen and Kijun-Sen lines to identify potential entry and exit points, with a bullish crossover of the Tenkan-Sen above the Kijun-Sen indicating a potential buying opportunity, and a bearish crossover of the Tenkan-Sen below the Kijun-Sen indicating a potential selling opportunity.
Conclusion:
In conclusion, technical indicators are valuable tools for traders in the financial markets. The Average True Range (ATR) can be used to measure volatility in the market, while the Ichimoku Cloud provides a comprehensive view of potential support and resistance levels, trend direction, and momentum. By using these indicators in combination with other technical analysis tools and market knowledge, traders can make informed trading decisions and improve their chances of success. It's important for traders to experiment with different indicators and find the ones that work best for their trading strategy.

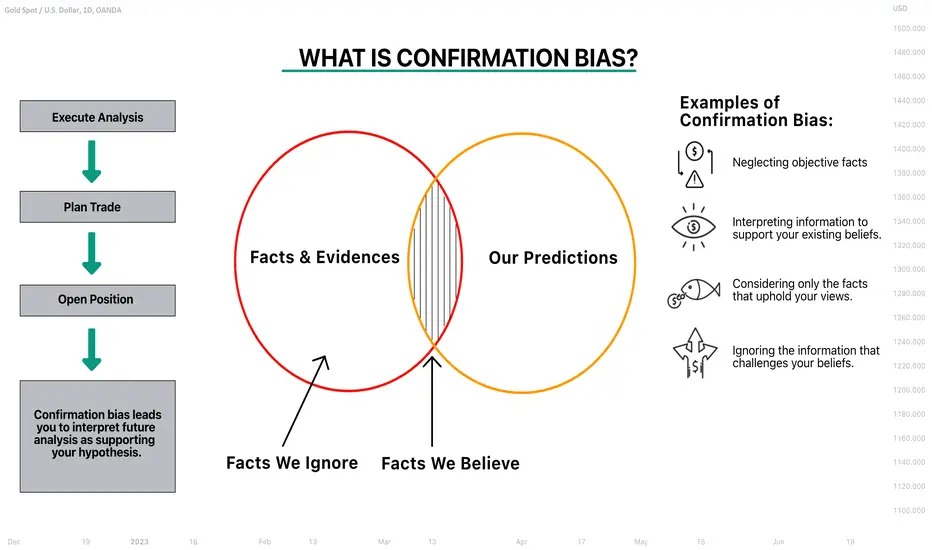
Learn What is Confirmation Bias | Trading Psychology 🧠
In this educational article, we will discuss one of the most common cognitive errors of newbie traders - a confirmation bias.
In order to better understand that term, I want to start with the example:
Let's say that after doing some research, you are highly convinced that Bitcoin is bullish and that it is a decent investment.
You decide to buy that from 50.000 level, expecting the exponential growth.
Instead of growing, however, the market starts falling rapidly.
Rather than closing your position in loss, you decide to do a new research and execute the analysis, you start looking for the proof of your pre-existing beliefs. You completely neglect the voices of Bitcoin sceptics and ignore bearish clues on the price chart.
You consider only the facts that support a bullish outlook, not letting you accept the other point of view.
You become a victim of a confirmation bias.
Unfortunately, such a psychological trap frequently prevents a closing of a trading position in time, leading to substantial losses.
Confirmation bias is a common psychological error that makes a subject overvalue the information that upholds his existing beliefs and undervalue the opposing one.
Here are the most common symptoms of that trap:
1️⃣One is neglecting the objective facts.
2️⃣One is interpreting information in a way to support the existing beliefs.
3️⃣One is considering only the facts that conform with his point of view.
4️⃣One is completely ignoring the information that challenges his beliefs.
The only way to beat a confirmation bias in trading, is to learn to analyze the market from sellers' and from buyers' perspective. Your task is to compare the view of the 2 sides, and pick the one that is stronger, holding in mind the fact that everything can change.
You should always remember of the changing nature of financial markets and be ready to always reassess your views.
❤️Please, support my work with like, thank you!❤️
The Role of ChatGPT in Algorithmic TradingThe Role of ChatGPT in Algorithmic Trading
1. Introduction
In recent years, algorithmic trading has become an increasingly important aspect of the financial markets. Algorithmic trading involves using computer programs to execute trades based on predetermined rules and algorithms, with the goal of maximizing returns and minimizing risk. The use of algorithms allows traders to make rapid, data-driven decisions and respond to market conditions faster than traditional human traders.
Natural language processing (NLP) is a field of computer science that focuses on the interactions between computers and human language. In the context of algorithmic trading, NLP techniques are used to analyze vast amounts of financial news, social media, and other sources of information to identify potential trading opportunities. By analyzing this data, traders can make informed decisions and gain a competitive edge in the market.
One of the key tools used in NLP for algorithmic trading is ChatGPT, a large language model trained by OpenAI. ChatGPT is a powerful tool that can analyze vast amounts of text data and generate human-like responses. Its capabilities include natural language understanding, machine translation, text summarization, and text completion.
With its ability to analyze and understand large amounts of text data, ChatGPT is an essential tool for traders looking to gain a competitive edge in the market. For example, ChatGPT can be used to analyze financial news articles and social media posts to identify companies that are likely to experience a significant change in their stock price. By analyzing the sentiment of these articles and posts, ChatGPT can determine whether there is a positive or negative outlook for a particular company, which can be used to inform trading decisions.
In addition to sentiment analysis, ChatGPT can also be used to generate summaries of news articles, which can save traders valuable time and allow them to quickly digest important information. ChatGPT can also be used to generate text responses to customer inquiries, freeing up traders to focus on more important tasks.
Overall, the use of NLP and ChatGPT in algorithmic trading is becoming increasingly important. As the amount of data available to traders continues to grow, the ability to quickly and accurately analyze that data will become essential for achieving success in the market. With its powerful NLP capabilities, ChatGPT is poised to play a significant role in the future of algorithmic trading.
2. NLP Techniques for Algorithmic Trading
Natural language processing (NLP) is an essential tool for algorithmic trading, enabling traders to quickly and accurately analyze large volumes of text data. In this section, we'll explore some of the key NLP techniques used in algorithmic trading, including analysis of financial news and social media, sentiment analysis, and identification of potential trading opportunities.
One of the most powerful applications of NLP in algorithmic trading is the analysis of financial news and social media. By analyzing news articles and social media posts, traders can gain insight into the market sentiment and identify emerging trends or potential trading opportunities. For example, if a large number of news articles and social media posts are discussing a particular company, it may be an indication that the company is about to experience a significant change in its stock price.
Sentiment analysis is another important NLP technique in algorithmic trading. Sentiment analysis involves using NLP algorithms to determine the emotional tone of a particular piece of text. By analyzing the sentiment of news articles, social media posts, and other sources of information, traders can gain insight into the market sentiment towards a particular company or industry. This information can then be used to inform trading decisions.
Identification of potential trading opportunities using NLP is another key application of this technology. By analyzing large volumes of data, including news articles, social media posts, and other sources of information, traders can identify emerging trends or potential trading opportunities. For example, by analyzing news articles and social media posts, traders may identify a new technology that is rapidly gaining popularity, indicating a potential investment opportunity.
Overall, the use of NLP techniques in algorithmic trading is becoming increasingly important. With the amount of data available to traders continuing to grow, the ability to quickly and accurately analyze that data will be essential for achieving success in the market. NLP techniques, including the analysis of financial news and social media, sentiment analysis, and identification of potential trading opportunities, are powerful tools that can help traders gain a competitive edge and achieve success in the market.
3. Predictive Models with ChatGPT
Predictive models are an essential tool for algorithmic trading, enabling traders to identify patterns and predict future market trends. In this section, we'll explore how ChatGPT can be used to develop predictive models and the advantages of using this technology.
At its core, predictive modeling involves using historical data to identify patterns and predict future trends. This process involves analyzing large volumes of data to identify patterns and trends that can be used to inform trading decisions. With the increasing amount of data available to traders, the ability to quickly and accurately analyze that data is becoming essential for achieving success in the market.
ChatGPT is a powerful tool that can be used to analyze large datasets and identify patterns that may be missed by other analytical tools. With its ability to understand natural language, ChatGPT can analyze vast amounts of financial news, social media, and other sources of information to identify patterns and trends. This information can then be used to develop predictive models that can be used to inform trading decisions.
One of the key advantages of using ChatGPT in developing predictive models is its ability to understand the context of the data it is analyzing. Unlike other analytical tools, which may only be able to identify patterns based on simple statistical analysis, ChatGPT can analyze text data to understand the context and nuances of the information being analyzed. This allows traders to identify patterns and trends that may not be immediately apparent using other analytical tools.
Another advantage of using ChatGPT in developing predictive models is its ability to learn from new data. As more data becomes available, ChatGPT can be trained to recognize new patterns and trends, improving the accuracy of its predictions over time.
4. Machine Learning with ChatGPT
Machine learning is a critical component of algorithmic trading, allowing traders to develop sophisticated models that can identify patterns and make real-time trading decisions. In this section, we'll explore how ChatGPT can be used in machine learning models for algorithmic trading, the advantages of using this technology, and some examples of its use.
Machine learning involves using algorithms to analyze large amounts of data, identify patterns, and make predictions. This process involves training the algorithm on historical data to recognize patterns that can be used to inform trading decisions. With the increasing amount of data available to traders, the ability to quickly and accurately analyze that data is becoming essential for achieving success in the market.
ChatGPT can be used in machine learning models to analyze text data and make real-time trading decisions based on that data. For example, ChatGPT can be used to analyze financial news and social media to identify patterns that may not be immediately apparent to other analytical tools. This information can then be used to inform machine learning models that make real-time trading decisions.
One of the key advantages of using ChatGPT in machine learning models for algorithmic trading is its ability to understand natural language. Unlike other analytical tools, which may only be able to analyze structured data, ChatGPT can analyze unstructured data such as news articles and social media posts. This ability to understand the context of the data being analyzed is essential for developing accurate machine learning models.
Another advantage of using ChatGPT in machine learning models is its ability to learn from new data in real-time. As more data becomes available, ChatGPT can be trained to recognize new patterns and trends, improving the accuracy of its predictions over time. This ability to adapt to changing market conditions is essential for achieving success in the algorithmic trading market.
There are several examples of machine learning models that use ChatGPT in algorithmic trading. For example, ChatGPT can be used to analyze financial news to identify patterns and inform machine learning models that make real-time trading decisions. ChatGPT can also be used to analyze social media sentiment to inform trading decisions based on public perception of a particular stock or market.
5. Limitations and Future Directions
While ChatGPT and NLP techniques have a lot of potential in algorithmic trading, there are also limitations to their use. In this section, we'll discuss some of the challenges associated with using ChatGPT and NLP in algorithmic trading, as well as potential future directions for these technologies.
One of the main limitations of using ChatGPT and NLP in algorithmic trading is the potential for bias in the data being analyzed. NLP techniques rely on training data to identify patterns and make predictions, but if that data is biased in some way, it can lead to inaccurate predictions. For example, if a machine learning model is trained on historical data that reflects biased trading practices, it may perpetuate those biases in future trading decisions.
Another limitation of using ChatGPT and NLP in algorithmic trading is the potential for the model to be fooled by fake or misleading information. As we've seen in recent years, social media platforms can be manipulated by bad actors to spread false information or manipulate public sentiment. If ChatGPT is trained on this misleading information, it can lead to inaccurate predictions and trading decisions.
Despite these limitations, there are several potential future directions for ChatGPT and NLP in algorithmic trading. One of these is the development of more sophisticated machine learning models that can better handle unstructured data. While ChatGPT has shown promise in this area, there is still much work to be done to improve the accuracy of these models.
Another potential future direction for ChatGPT and NLP in algorithmic trading is the use of natural language generation (NLG) to create more sophisticated trading strategies. NLG involves using machine learning to generate human-like language that can be used to describe trading strategies and other complex financial concepts. This can help traders better understand the decisions being made by their machine learning models and make more informed decisions.
In conclusion, while ChatGPT and NLP techniques have a lot of potential in algorithmic trading, there are also limitations to their use. By addressing these limitations and exploring new directions for these technologies, we can continue to improve the accuracy and effectiveness of algorithmic trading models. As the amount of data available to traders continues to grow, the importance of these technologies in the trading industry will only continue to increase.
6. Conclusion
In conclusion, ChatGPT and natural language processing techniques have become increasingly important in algorithmic trading. By analyzing large amounts of unstructured data from sources such as financial news and social media, ChatGPT can help identify potential trading opportunities and provide valuable insights to traders.
One of the key advantages of using ChatGPT in algorithmic trading is its ability to analyze and understand human language. By analyzing sentiment and other linguistic patterns, ChatGPT can provide valuable insights into public opinion and market trends, which can be used to inform trading decisions.
Another advantage of ChatGPT in algorithmic trading is its ability to analyze large datasets and identify patterns that may not be immediately apparent to human traders. By using machine learning models to analyze historical data, ChatGPT can identify trends and make predictions that can help traders make more informed decisions.
Looking to the future, it's likely that ChatGPT and other NLP techniques will continue to play a significant role in algorithmic trading. As the amount of data available to traders continues to grow, the importance of these technologies in the trading industry will only continue to increase.
However, there are also potential challenges and limitations associated with using ChatGPT and NLP in algorithmic trading. It's important to be aware of these limitations and to work to address them in order to ensure that these technologies are used in a responsible and effective way.
Overall, the use of ChatGPT in algorithmic trading represents an exciting development in the field of finance. By using machine learning and natural language processing techniques to analyze large amounts of data, traders can gain new insights and make more informed decisions. With continued research and development, the potential applications of ChatGPT and other NLP techniques in algorithmic trading are sure to grow and evolve in the years to come.

📖STOIC TRADING📖Stoic trading.
I bet stoics didn't trade, but they knew a lot about life in general. I suggest to cultivate stoic mindset in regards to trading, and negative expectation and negative visualization in particular. You can talk about it with ChatGPT and explore yourself, but here let me explain a bit.
So, instead of doing exactly what everyone else does - that is to expect your next trade to deliver big time, or to dream about a big runner, or huge profits in a day or a week, or to trade back all your recent losses with one overrisked entry - try to do something that's completely different. And by the way, that's a great overall approach to trading: find what doesn't work, and do the opposite (that's one of the main principles discussed widely by great Tom Dante).
To do this, when you come to the market, visualize and expect nothing🙀. Literally tell yourself this:
1️⃣..I showed up to the charts just to observe and analyze them (by the way, did you know that speculation, from latin "specio", means observation, with no judgement)
2️⃣..I expect my setup to NOT show up today, and so today I'm not expecting any trades to have
In case you'll find your setup, continue to keep the following negative mindset:
3️⃣..I followed my rules and entered a good setup, and I will follow my management rules, but right now I expect this trade to just end up as a loser
If you were able to protect at breakeven later, expect it to hit your breakeven and not your take profit.
For beginners, this all can sound stupid, even somewhat like a paradox🙄, but that's only because they don't understand how trading works. And trading really works in a way, that having LESS trades brings you MORE profit. Even if you're trading 1 sec. chart, and I'm not joking here.
This mindset practice I described above allows you to protect your emotional capital and also enter setups with a better quality. I will talk more about this and also why so called "overtrading" is actually pure gambling, and how it destroys people's accounts in the next post. Have a good day everyone, and keep the grind, even if there's no one to appreciate or believe in you!
P.S. I appreciate you and believe you will eventually do it and become consistent and profitable trader. 🙌
