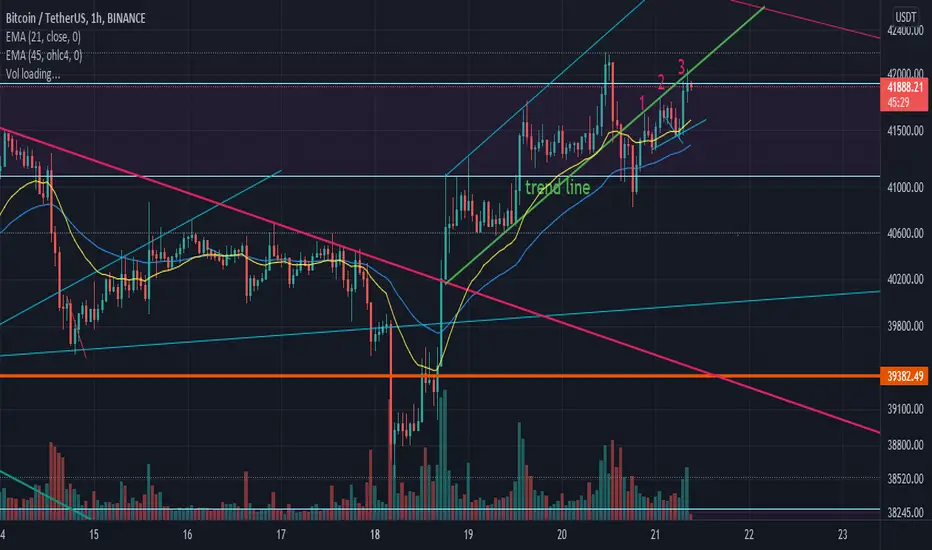
great setup for swing trading on #btc🔥hi there traders all around the world👋
one of the great setups that we can count on it is breaking the trend line and it simple.
when a trend line breaks spatially if that trend was a pullback in previous(we had a good bear trend line here) we must wait for price to reach and touch the trend line then we can enter.
tip: if price touches 2or 3 times its much better.
I hoper you enjoy the lessen I just teaches you, wish you all a great day with good profit.
cheers 🥂.
Trading Plan
The Dunning–Kruger effectAfter recently doing a review of my last 6 months of trading, I recognized that my portfolio value over this period looked very similar to the Dunning–Kruger effect curve. (a psychological phenomenon that suggests people are not always the best evaluators of their own performance). The theory is often applied to trading because most retail traders experience a similar effect.
After spending 3 months of a practice simulator, I deposited real funds into a trading platform. Within the first week I saw a 24% increase which was shortly followed by loosing half my account value in the coming months. I then decided to take two weeks out and reflect on my performance. It was in these two weeks where I stumbled across an article called "5 steps to becoming a trader" (which I have linked to this post). I came to realize that I was completely incompetent. I didn't follow my trading plans, I got caught up in emotions and I was almost gambling money away in the hopes of getting rich quick.
The harsh reality is trading is hard. After a total of 9 month, I have only just managed to see a net positive return. I have spent thousands of hours only to be outperformed by an Index fund. One article won't change your performance, but these are some things that I learnt which could get you closer to conscious competence:
1. Don't trade with emotions, trade with your plan
2. Keep your risk/reward >1.75
3. Never risk enough money to loose sleep (enter each trade as if you have already lost the money you placed)
4. Reflect on performance and learn from mistakes
5. You don't need to win lots, you just need a mathematical edge
As a trader gains more experience, they become increasingly confident and more likely to see positive returns.
Stay dedicated!!!

Not having a position is also a position - When trading is bad?Every day we start by choosing between long and short.
Sometimes you wake up, look at the btc chart - and clearly see your setup.
And sometimes you don't see it. But you still saw how many of your friends traded shorts successfully and decide to enter a hostile market.
Bottom line: Lost profit, exhausted nerves, stress, a blow to self-esteem.
Most traders forget that there is a third option - to stand aside.
Let's discuss when such position can be useful and why most people use it so rarely.
Pro traders can be split into 2 types:
Bulls and bears. They trade for profit only in one direction, because they have a trained eye to see only their kind of setups.
When a bull finds himself in a bear market, he either trades in the red or breakeven. The same true for the bear.
And yet, even knowing this, the trader continues to trade unfriendly setups. Fueled by success that he carries from his market, he is sure that just a little more, a LITTLE LITTLE more, and he will be able to trade profitably in this market as well. "And if I can trade for profit in both directions, then I will become an absolute terminator and even Warren Buffett himself will personally beg me to share my market forecast with him!" I don’t know if you woke up with such thoughts in the morning, but I definitely had a couple of times.
The answer to this phenomenon is GREED (for money or fame). And the easiest way to get rid of such incidents is to write the following rule in your trading algorithm (I hope you have it):
• Trading during correction is prohibited.
Just one sentence will save you a huge amount of money and help you increase your capital much faster.
Instead of losing money trading corrections, it is better to:
• Relax and spend part of your honestly earned profit on yourself and your loved ones.
• Patiently wait for your market and return to the game.
Do this - and trading will bring you much more pleasure, and you will earn even more and enjoy your life!
If this article was useful to you, please like and leave a comment so that I understand that it has value to you and will continue to write educational material in the future✌️
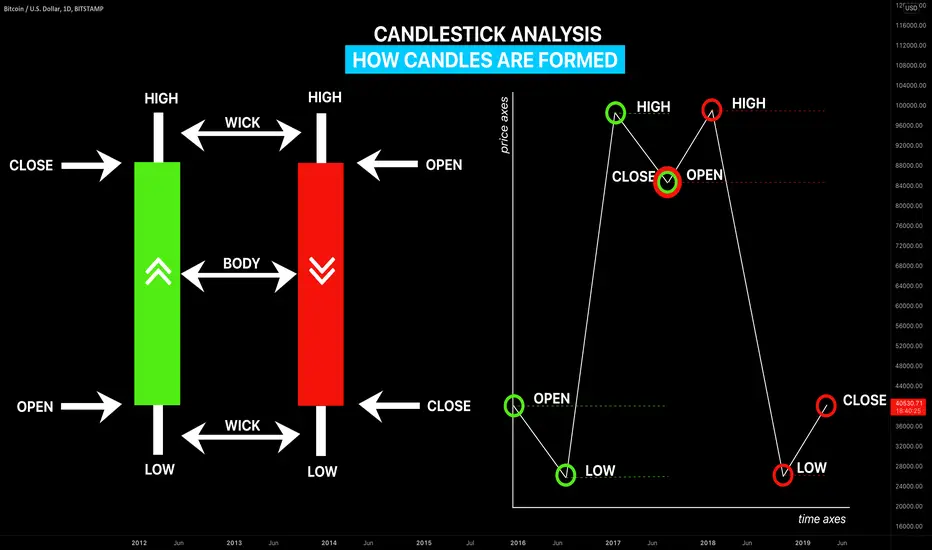
How to Read a Candlestick | Beginners Guide 🕯
Hey traders,
If you follow me for quite a while you probably noticed that I apply a candlestick chart for the market analysis.
In this post, we will discuss how to read an individual candlestick and we will outline its important elements.
🔰The candlestick reflects the price movement for a selected period of time.
An hourly candle will show you a price action within an hour and a daily candle within a day.
🔰The candlestick pattern has a very specific shape:
it is composed of a body and a wick.
The wick of the candle indicates the range of the price action within the candle. Its upper wick will show you the highest price during that time period and its lower wick will show the lowest price, while the body of the candle indicates its opening and closing price.
🔰From the color of the body of the candle, we identify its direction.
Green signifies a bullish candle while red signifies a bearish one.
🔰The lower boundary of a body of a bullish candle will show its opening price and its upper boundary its closing price.
🔰The upper boundary of a body of a bearish candle indicates its opening price and its lower boundary its closing price level.
With so many elements within a single candlestick, one can derive a lot of valuable information.
Some candlesticks have a very specific form and are called candlestick patterns. They are applied for predicted the future market behavior.
A proper reading of a candlestick chart may unveil a lot of insights about the market so it is very important for you to learn to work with that.
❤️Please, support this idea with like and comment!❤️
How to lose your deposit quickly? Easy to follow Step-By-Step🔥Why am I qualified enough to teach you this?
I lost 16 deposits and in 6 years I heard dozens of stories of people who lost their life savings in a couple of months by trading. I have personally tested many of these rules and confirmed that they work.
So what are we waiting for? Lets get it started!
1. Trade with maximum leverage
There is no need to trifle, the bigger leverage is, the greater your profit will be🤑
2. Don't use stop losses
SL’s are for the weak. You probably remember how many times your positions went in the right direction after you closed them by stop loss. Stop losses are evil🤮
3. Average losing positions
Everything is simple here - the more you average, the less you lose. That means you can keep going. Nothing ventured, nothing gained🥂
4. Use your last money and don’t be shy to borrow
The more money you put in, the more money you pull out. Since you are 100% sure that BTC will grow, take loans not only in banks, but also from shady organizations, do not look at interest - you will repay everything back in a month anyway, and your profit will cover any losses💵
5. Trade only when you have been fired from work, haven't slept all night, your girlfriend/wife has left, or you have quarreled with relatives
When everything is bad in your life, it is better to do what you do best - trading. Having earned a lot of money, you will not only be distracted from everyday problems, but also regain confidence and a smile on your face!😉
6. When you closed a losing position, immediately open a new one with double volume to recoup losses
You came into trading to win! So win and never admit defeat! You are Hercules and defeating everyone in the market - this is your 14th feat! No step back, only forward!✊
7. Prioritize Elon Musk's conspiracy theories and tweets over technical analysis
Do you already have the conviction that the Illuminati run the market and every time you open a position and the market goes in the opposite direction, the Illuminati move to harm you? If not, then quickly look at your lost trades. You did everything right, but you still lost money. Why is that? Just don't tell anyone...🤫
8. Believe that trading is luck and the odds are always 50/50
This makes it much easier to make decisions. If black has fallen out on the roulette wheel 2 times in a row, then the chances that red will fall out are much greater. Therefore, do not hesitate to go against the trend, probability theory is on your side 💪
9. Stop exercising your body and mind
You will need neither a healthy body nor a focused mind in trading. You only need your eyes to see “buy“ and “sell“ buttons, you don't need much intelligence for this. Being in the green zone? The green zone is a myth for suckers who engage in self-deception.😏
10. Quit your daily job
Since you already created an account on Binance a week ago, watched a couple of trading videos, sorry, I meant in-depth educational materials, and even have already made a couple of successful trades, then it's time to finally quit that boring job. The road to millions is open, it remains only to take the last step.🤩
11. Manage your friends money
Why getting rich alone? Take your friends and family with you. They will be grateful later.🙌
12. Don't look away from the screen until you've regained every last cent.
Winners don't walk away with losses. Make sure your deposit has at least doubled before ending a session.😎
13. Never fix profits. If it has grown a little, then it will grow more.
Do you remember how you closed the position when the coin grew by 5-10%, and then it rose another 200%? That’s what I’m talking about. Don't close too early, keep trades for the maximum profit.📈
14. Trade at night
If you don't have time, don't give up. There is always an opportunity to earn. Even after a hard day at work.🤜🤛
15. Analyze the market on a 5m timeframe and trade on the 1m.
Opportunities are always there - the main thing is to be open to them.🤞
I hope these tips will help you quickly drain your deposit down and return to a normal life. If you liked them or you are already using them, please click Like and leave a comment so that I understand that it is valuable to you and will continue to write educational materials in the future.✌️

The Element of Time - The Most Underrate Technical Analysis ToolMarket timing is an essential tool whether you're a day-trader, portfolio manager and/or long-term investor. I present to you the most underrated technical analysis tool in the space of retail trading. The purpose of this short educational webinar is to open your eyes to something you don't hear about abundantly because it is the most disregarded aspect of trading in my opinion.
As an intraday trader, my main focus is on the speculation of "the next daily candle". However, I first analyze and project on "the next weekly candle". Each weekly candle is broken into 5 individual daily candles, and each daily candle is broken down into 3 main market sessions - namely, Asia, London & New York Session.
You'll find that my main focus in this lesson is on the day in which you find a lower / upper wick being created on the weekly candle. More often than not, "Tuesday" typically forms the low of a bullish weekly candle, and the high of a bearish weekly candle.
Watch the lesson entirely, take notes, but most importantly, let it open up the opportunity for you to exponentially elevate your trading skillset.

How to analyze any market from scratch #3Hello everyone:
Many of you have asked me to continue making more of these analysing from scratch video, so I have prepared another one here for you today.
Not only will we refresh the previous 2 educational videos on this topic, I will go into a bit more details on the confirmation on the lower time frames with multiple examples in the chart.
Recall from the previous videos I made, when we want to analyze the chart from scratch, we always start:
1. From the higher time frames (HTF) to identify the impulse/correction phases of the market conditions so we can come up with a possible bias and direction of the current price.
2. Once we have a possible direction and bias, then we go down to the lower time frames (LTF) to also identify the impulse/correction phases which will lead to your confirmation and entry.
These are simple steps to follow, based on multi-time frame analysis, top down approach.
Many have told me it's not hard to identify the HTF’s impulse and correction, but what can be classified as a LTF confirmation before entry?
Let's take a detail look into a few examples:
A LTF confirmation is when the price is developing a few more price action structures/patterns that align with your HTF direction and bias.
These can be continuation/reversal corrections on the LTF; impulse phases on the LTF that go with your bias on the HTF; multiple corrections within the larger corrections (patterns within patterns)...etc.
The more of these LTF price actions you can identify, the more it strengthens your analysis and forecast on the HTF.
Thank you
Do check out my previous educational contents on this same topic to better learn my approach to analyse any market from scratch.
How to analyze any market from scratch #1
How to analyze any market from scratch #2

Trading in Books vs Trading in RealityWhat we study in the books is always different from what we have in real life. For example, French language that people learn and exercise in textbooks is slightly different from the French that we speak in France, as we tend towards using informal language and slang phrases. Same rule applies to trading, as the market is not 100% accurate with what we have in the books that educate us on trading. What we have in the books is absolutely crucial to learn the basics and even more. However, while applying the learned theorem in practice, in our case in the real-life markets, we notice that things are different. Thus, it is important to combine these two elements (on and off the market education) to master the craft.
Furthermore, beauty always lies within simplicity. What's written and illustrated in the books, is the most understandable language of trading. Hence, the expression "textbook stuff" exists. The more experience you gain in this field, the more you will realise that it is crucial to keep things super simplistic if we want to have a crystal clear vision of the market.

The Market is NOT the EconomyGood day, Traders! This week I came across the following headline from a major newspaper: "Stocks Suffer Worst Quarter in 2 Years Amid War, Inflation." It was a surprise to me, because, the majority of the traders that I know didn't miss a beat... March was a great month for trading, just as February was a great month, and so was January! Why is that?
Simply put, the Market is NOT the Economy .
It doesn't matter is there is a pandemic,
it doesn't matter if there is a recession,
it doesn't matter if there is a war,
it doesn't matter if the tech oligarchs are censoring free speech,
it doesn't matter who slaps who at some celebrity event.
The market is composed of people , groups , and institutions trading products in a market whose prices are governed by Supply and Demand .
Oil is at all time highs? Doesn't matter to us traders because we'll find opportunities to both buy and sell based on price action.
"The Euro is losing value?" they say? Again it doesn't matter to us traders because we will find opportunities to go both long and short when our system tells us to do so.
Should you Short the DOW because you think American Industrial companies are going to suffer the repercussions of the last 2 years of lockdowns? Again, it just doesn't matter to the experienced Trader - when the opportunity to go long or short presents itself, just like that proverbial fork in the road, we take it!
"But Captain, you Magnificent Maven of Market Manipulation" you say, "It's impossible to predict market movement. I might as well visit my local casino and go all in on Red on the Roulette Wheel!"
That's what the so-called "experts" want us all to think - Give the "experts" your money and you will be taken care of in your retirement, right? How many professionally managed funds routinely beat the market? According to the New York Times, ZERO. According to a recent report by Business Insider, 90% of actively managed funds failed to beat the market.
If these Ivy League "professionals" spending their entire day trying to beat the market consistently FAIL, Why is it that consistently profitable traders succeed? Because we traders are following those who MOVE the market.
When we traders follow a system that works , and we then develop the ability to "work the system" we get to do what very few people get to do: consistently generate reliable income in the market regardless of economic conditions, regardless of who is in the White House, regardless of what society tells you can or cannot do based on your age, race, or economic status... that's the beauty of being a trader... Freedom.
Until we meet again, Trade well!
The Most Underrated Technical Analysis Tool - Element of Time !Market timing is an essential tool whether you're a day-trader, portfolio manager and/or long-term investor. I present to you the most underrated technical analysis tool in the space of retail trading. The purpose of this short educational webinar is to open your eyes to something you don't hear about abundantly because it is the most disregarded aspect of trading in my opinion.
As an intraday trader, my main focus is on the speculation of "the next daily candle". However, I first analyze and project on "the next weekly candle". Each weekly candle is broken into 5 individual daily candles, and each daily candle is broken down into 3 main market sessions - namely, Asia, London & New York Session.
You'll find that my main focus in this lesson is on the day in which you find a lower / upper wick being created on the weekly candle. More often than not, "Tuesday" typically forms the low of a bullish weekly candle, and the high of a bearish weekly candle.
I encourage you to mark out the Open of your week, and highlight the swing point on the Tuesday of each week. I promise, you'll start implementing the "Element of Time" in your trading toolbox.
Of course this is not a standalone tool, however is helps greatly with the determination of your weekly directional bias. It will also assist with your trade and risk management.
It is to up to you to put the work in and infer whatever information you can from this little teaser of an illustration.
Let this open up the opportunity for you to exponentially elevate your trading skillset.

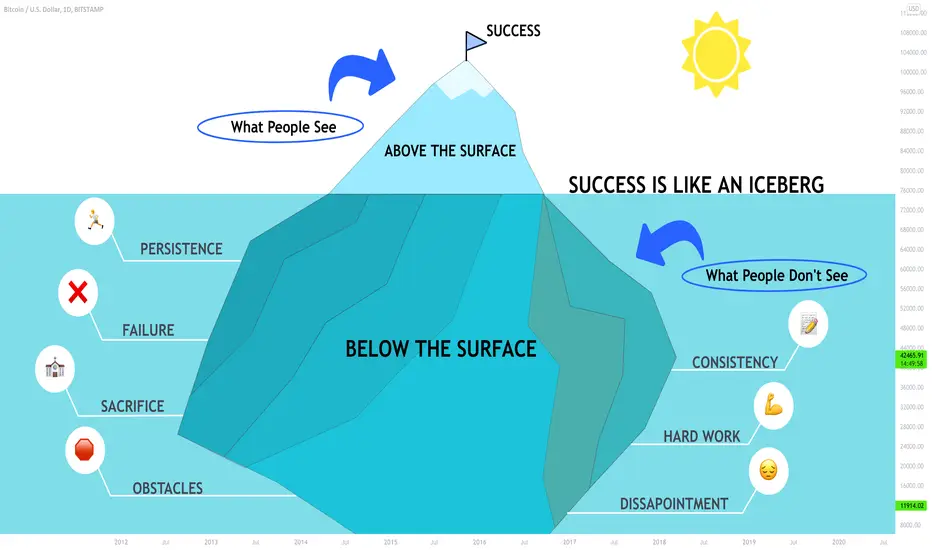
The Iceberg Illusion of Success in Trading 🏔️
When people see a consistently profitable trader they do not consider all the costs a successful trader has paid overtime (below the surface) to get to what they see (above the surface).
So many things happen below the surface that nobody can see.
Here are some of the below the surface things that compose the top of the iceberg that everyone sees:
🔰Dedication – you need to be loyal to your dream of becoming a pro trader. Your belief must be that strong so no one could dissuade you. You need an iron discipline to make it happen.
🔰Hard work – you should work day after day not letting yourself give up. Charts must be in front of you as much as it is possible. Trading terminal must become your best friend.
🔰Good habits – follow your trading plan, do not break your rules of risk management, avoid FOMO, etc. This is the set of habits that will be your satellite in your trading journey. Do them consistently and they will become a natural part of your life.
🔰Disappointment – it does not matter how hard you try. Occasionally things will fall apart anyway: you will face losing streaks and a strategy will refuse to work. It will hurt. "Stand up straight with your shoulders back". Treat disappointments as temporary things.
🔰Sacrifice – to become a consistently profitable trader you should pay the price. Losses, time, nerves. Your prosperous future will have a tremendous cost.
🔰Failure – while you are learning how to trade you will inevitably blow a couple of trading accounts, you will spend time on strategies and techniques that do not work. Occasionally you will fall. If so, stand up and keep going.
🔰Persistence – keep doing what you are doing no matter what. Do not let others persuade you that you can't make it. Even if things get tough, stay strong.
🔰Focus – always know what is your end goal, know where are you going, and what is your end destination.
🔰Flexibility – be prepared for sudden changes in the environment. Keep your focus on the goals that you set learning to adjust to the changing circumstances.
🔰Consistency – you will not get the desired results immediately. Be ready to do the same again and again, hundred times until the goal is achieved.
Overnight success does not exist. If you want to become a consistently profitable trade be prepared for years of struggling and pain. And do not be afraid, it is worth it.
❤️Please, support this idea with like and comment!❤️
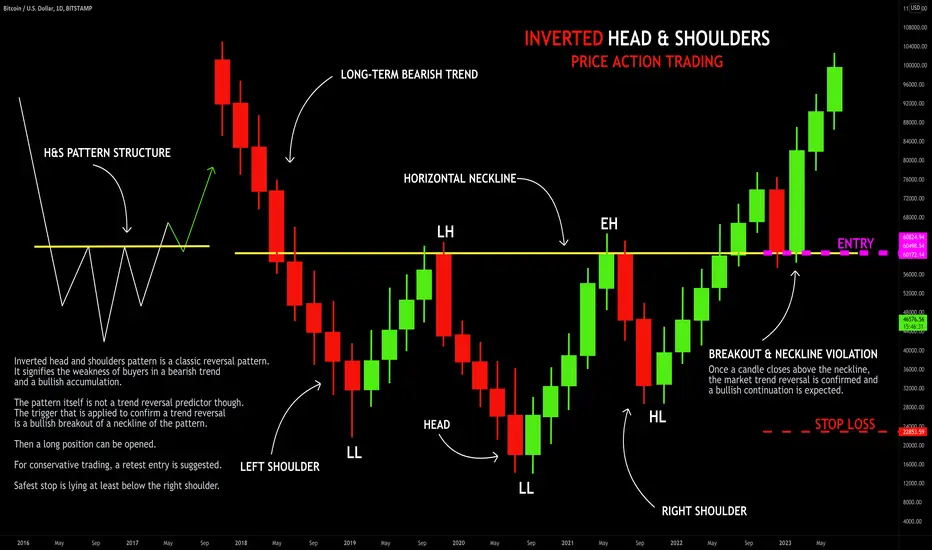
PRICE ACTION TRADING | INVERTED HEAD & SHOULDERS PATTERN 🔰
Hey traders,
Inverted head and shoulders pattern is a classic reversal pattern.
It signifies the weakness of buyers in a bearish trend and a bullish accumulation.
⭐️The pattern has a very peculiar price action structure:
Trading in a bearish trend the price sets a lower low and retraces setting a lower high (left shoulder),
then the market goes lower setting a new low but instead of setting a new lower high, the price returns back to the level of a previous lower high setting an equal high (head).
After that bears start pushing again but with an amplifying bullish pressure, the market sets a higher low and returns back to equal highs setting a new one (right shoulder).
🔔Equal highs form a horizontal structure called a neckline.
Once the pattern is formed it is still not a trend reversal predictor though.
The trigger that is applied to confirm a trend reversal is a bullish breakout of a neckline of the pattern.
📈Then a long position can be opened.
For conservative trading, a retest entry is suggested.
Safest stop is lying at least below the right shoulder.
However, in case the heights of the right shoulder and head are almost equal it is highly recommendable to set a stop loss below the head level.
🎯For targets look for the closest strong structure resistances.
What pattern do you want to learn in the next post?
❤️Please, support this idea with like and comment!❤️
How to continue in trading during uncertainty timeHello traders:
Recently I received many messages from traders about taking many losses during this uncertain time.
What's going on globally right now may have a different impact on all the different markets.
Many have told me of your frustration, stress, and negative emotion on losing money and continue to feel defeated.
Today I will explain a few things that you can implement into your current trading plan,
approach and perspective during this period of time.
First, you must acknowledge risk management.
Too many traders ignore this key important aspect of trading.
Especially during this time where the market can be volatile and irregular.
It's in your best interest to understand how to manage your risk. You should have a plan that lists out how your approach would be.
For example for my risk management right now:
-1% per trade of account capital.
-No more than 1 trade on the same currency, unless the first trade is secure in profit.
-No more than 2 trades open during a day, max drawdown 2% per day
-10-15 trades per month
-3 trades maximum per week
-Minimum 3:1 RR allow before entry
-Will Take profit on average when in profit 3:1 RR.
Second, learn to control your mindset and emotions.
More often when traders approach me these days, they are telling me they are taking too many trades, chasing profits and revenge trading their losses.
All these arise from the mistakes of FOMO, get rich quick mindset, enter multiple trades.
IF a trader can truly understand the fact that the market will always be there tomorrow, next week, next month..etc, then it's an easier thing to deal with on a psychological level.
You will no longer stress about trying to enter too many trades, worry that the market may not be available tomorrow.
Third, less social media exposure.
In today’s world, unfortunately in trading, most of the things you see on social media are fabricated and fake.
Their sole purpose is to sell you a dream, lifestyle, and easy money concept.
ITs always during this uncertain time, you will see more and more of these “gurus” who will show you how much $ they made during this time.
Now, I am not saying all are fake or scam, I am sure small # of them are doing well.
But, most of the things you will see in your social media feed, are likely to be photoshopped, faked, fabricated to make you believe whatever you are doing is wrong, and you tend to “compare” your result with these people.
This ended up becoming very negative and stressful to continue.
ITs important to understand trading is one of the toughest professions out there.
IT requires so much emotion control, clear mindset, and proper psychology on a regular basis.
If you are struggling, it's usually not to do with your trading strategy, but rather your approach, perspective, and perception.
So, eliminate as many unrealistic things you might see, and focus on yourself and your journey.
Any questions, comments or feedback welcome to let me know.
Thank you

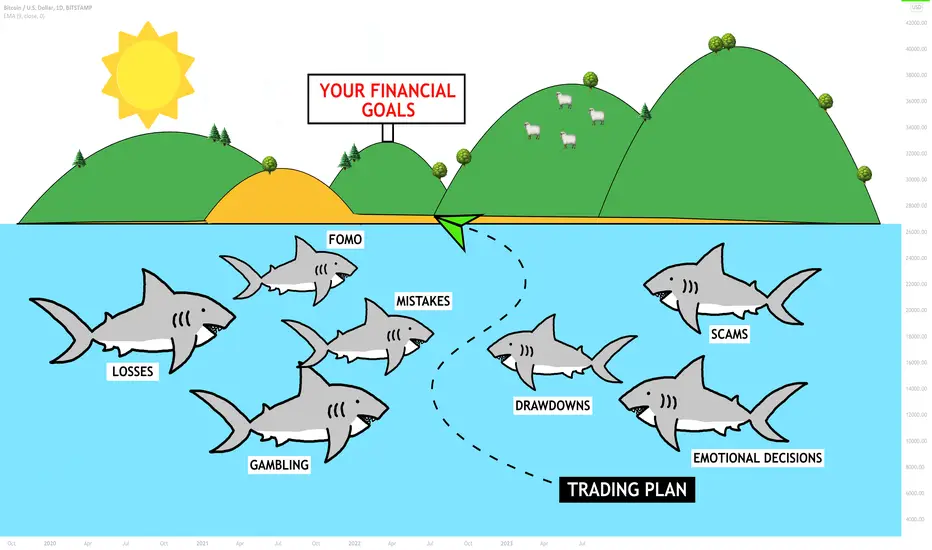
Why Do You Need a Trading Plan?📝
If you want to become a consistently profitable trader you have two choices:
1️⃣strictly follow your trading plan
or
2️⃣fail.
Trading plan is essential for achieving your financial goals.
It is a set of actions to follow for making trading decisions
guiding you on how to react to certain events.
It reflects your personality and characteristics.
Moreover, its entire structure and content are primarily based on them.
Your way to success will be full of obstacles.
A lot of things will come in your way:
losses, drawdowns, and losing streaks;
mistakes, scams, and emotional decisions.
Only your trading plan will show you a correct path, it ensures you will stay on track on your journey to your desired destination.
When you make a wrong turn, it knows to make adjustments, and it points you back in the right direction.
It is your guard from making any hurried decisions you could later regret.
Trading without a trading plan wouldn’t be a smart idea. You wouldn’t know how to get to your destination and it’s highly likely that you get lost.
Most importantly, if you suck at trading (and you certainly will in the beginning), you will know it is down to one of only two reasons: either there’s a problem in your trading plan or you are not sticking to your trading plan.
Stick to your plan traders. "If you fail to plan, you plan to fail".
❤️Please, support this idea with like and comment!❤️
How to trade by using EMA Ribbon ?Hello traders 🐺 .
this is an educational idea and it's about the EMA Ribbon .
In this idea I want to talk about how to using EMA Ribbon in trading so make sure to read this idea until to the end if you are one of the Moving averages fans .
I like to start with an example of trading by using the EMA Ribbon , then I explain more about the EMA Ribbon and how it's work :
in the chart above we have 3 different examples of trading by using the EMA Ribbon ; as you can see in the chart above , we have 3 different pattern and the last one which is the symmetrical triangle is actually the current pattern of the BTC and I want to ask you about your prediction for it so leaves your comments below this idea and share your view about the BTC , after learning of how we can trade or in the other words how we can use the EMA Ribbon in our trading .
let's start with the ( first example ) :
my first example is rising wedge pattern , I try to cover all 3 types of the market conditions in this idea , because it's important to learn to trade in the any direction ; the first example is a bearish pattern :
As you can see in the chart above , BTC price after creating the rising wedge pattern started a very long down trend , by how we can trade it ?
if you look at the chart you will notify that the every line of the EMA Ribbon acts as a support or a resistance and the more deeps price can penetrate to the Ribbon , the chance of the reversal is higher .
For example , look at the rising wedge , during the pattern when the EMA Ribbon was in the bullish mode or in the other word , when short term EMA is above the long term EMA , when price finally success to penetrate to the last line of the EMAs which is the long term EMA ; price was faced to the more stronger support and this is shows us that if price can break below the all of the EMAs , there is strong chance for the changing the trend .
but finally when price break below the Ribbon , BTC was started a very long term bear trend , if you are a trader you must know that this bearish pattern after the very long bullish trend could indicate the bear market signs , and if you want to use EMA Ribbon for trading this is good chance , so let's see how we can use it ?
first of all when price break below the EMA Ribbon you must wait for the confirmation signs , this is means that you must wait for the EMA Ribbon to flip from bullish to the bearish mode which means that the short term EMAs goes below the long term EMAs , and after the retest of the Ribbon you can say that , thing are looking bearish from the EMA Ribbon sight ; and you can set your short trade based on your trading strategy .
but what's the problem of the EMA Ribbon ?
let's talk about the EMA Ribbons problem after checking all of the examples , until that please think about it and imagine how we can fix this problem if you find out the problem , if you can't , wait for the end of this idea and also don't forgot to support me with your likes and comments .
let's combine the example 2 and 3 together for better understanding :
as you might know , the moving averages are trend chaser indicator which means that they are work perfectly when market have a specific trend , for example in the chart above when BTC created a falling wedge pattern and break above the EMA Ribbon and retest it as a new support start a bullish trend , and as you can see when market started to retracement , BTC created a bull flag pattern and after the break out BTC continue the bullish trend .
in the bull flag , you can see that price break below the EMA Ribbon and also retest it as a resistance , but price can't continue the bearish trend ; so why this happen ?
did you remember that in the example one , I asked you about the EMA Ribbon , could you find the problem yet or not ? if you can't find it wait for the end 🙄🤷♀️ .
now we arrive to the last example which is the symmetrical triangle , but I gonna talk about it in the next idea because this is an educational idea and not for the analysis purpose , so make sure to follow me to find out what gonna happen for the BTC in the next coming weeks .
now it's time to show you the EMA Ribbons advantages and problem in one clear picture :
Did you remember that in the example 3 (bull flag) I said that the EMA Ribbon flipped to the bearish and also the price retest it as a resistance but price didn't break below again and after that BTC was breaked to the upside , this is what I mention the reason in the problem number 3 :
3_Moving average ribbons are best used in conjunction with other forms of analysis, such as price action, other technical indicators, and fundamental analysis for longer-term traders.
you must know that it's better to use EMA Ribbon in conjunction with other indicators for example , personally like to use it in conjunction by the RSI and TSI and also the price actions .
in the example number 3 , the overall trend is still bullish and price is above the support structure and also it's on the bullish pattern , so there is strong chance for goes above the Ribbon again .
now it's seems to we reach to the end of the idea and I must appreciate you my friends to read my idea , don't forgot to leaves your idea about this symmetrical triangle and help me with your likes and comments ; thank you for reading my idea .

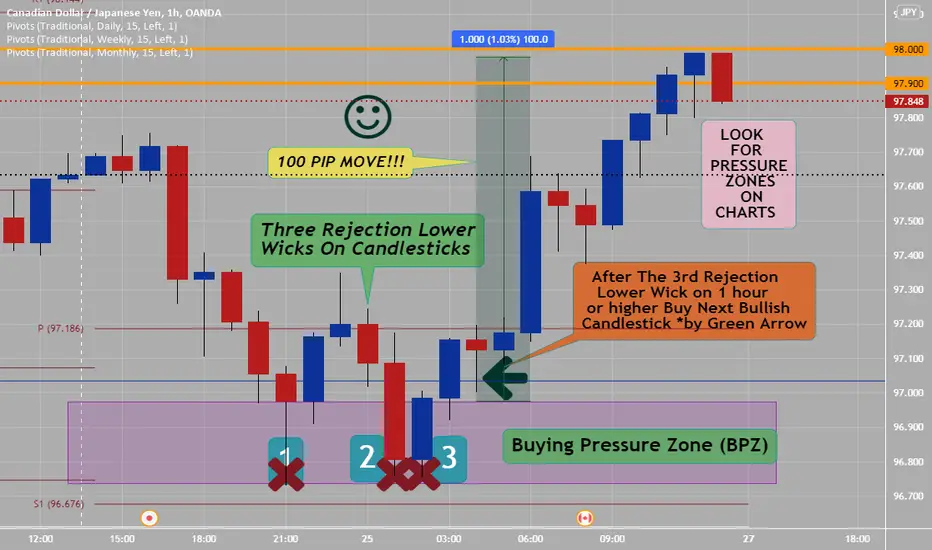
Price Pressure Zones :Bearish & BullishTrade Plan:
Locate Buying and selling pressure zones implied by the lower and upper shadows/wicks of candlestick price bars.
These areas have THREE rejection shadows or wicks in a relatively close area or time period.
These pressure zones can be done on 15 minute time frames, but 1 hour, 4 hour or daily charts are stronger and more reliable.
Look at attached chart ( do you see numbers 1, 2 and 3? rejection lower shadows or wicks)- this suggest future bullish or buying trading.
* Buy next 1 hour candlestick bar (blue on chart) after the three rejection lower shadows or wicks, with right risk management under your strategy and plan.
Pro Tip:
A strong pressure zone is not defined just by one pin bar!!! These need a minimum of three rejection shadows and/or wicks, which make these zones ones which the big money or big banks have a wall up that they do not want price action to go thru at this time. Never fight big money/banks- trade with them.
Bullish Pressure Zones- Multiple price bars with lower wicks
Bearish Pressure Zones- Multiple price bars with higher wicks
Common Mistake: The buying or selling pressure found on a single price bar might not be sufficiently reliable for a trading setup. Instead of a single bar, look for at least three consecutive bars with overlapping upper or lower shadows. When multiple shadows overlap the create a price zone that is more likely to exhibit the buying or selling pressure you anticipate.
How To Trade Divergence
Divergence simply means separation.. When two similar things things---get separated and start going different directions, you have to consider which direction to follow. That's exactly the concept of divergence. When trading, and you spot a divergence, you want to be sure to understand what they are trying to tell you. In this video, I explain the concept of divergences, how to trade them and what to do when you sight one. Be sure to like, follow and comment.
I want to see those div trades!

Trading Mountain: How to reach the top step-by-stepHey, family! Good time of the day and welcome on another educational post.
As we all know, the road that leads to successful and consistently profitable trading is a pretty difficult and long one. It takes years of hard work, patience, dedication, and experience to reach the top of the trading mountain. Many beginners make similar mistakes before starting their journey. They tend to have false expectations and a distorted vision of the big picture.
As it can be inferred from the graphical illustration, the mountain pattern connects dots and shows a realistic path of a successful trader to the top of the hill.
We all start somewhere, right? We start taking our first steps and making ourselves familiar with the thing we are interested in. In the example of trading, it can be the first YouTube video that we watch, a chapter of a book related to investments that we read, first chart analysis that we make and many more.
What comes next? We decide on the type of a trader that we are. Do you have enough time to sit in front of the charts for several hours and press BUY/SELL buttons, or you are busy 90% of the time and prefer having a portfolio full of long-term positions?
After we have decided what our strategy will look like, we build a trading plan around it and make it a part of our lifestyle. We identify our trade entry criteria, risk management plan and so forth.
Backtesting our trading plan is a vital part for the journey. It can take days, weeks or even months. However, it will be worth it at the end of the day, as it is crucial to link our strategy with the trading plan and find out how profitable it will be.
Executing, optimising, journaling. Where did I make a mistake? What could have been done better? What should I change in my trading plan? It is important to stick to one single trading plan and optimise it along the way.
Before trading with real money, it is recommended to open positions on a demo account with virtual money. Getting a hand of things, practising the market and gaining experience is important.
After having traded on a demo account for several consecutive weeks, months or even years, we can move to a real trading account. Demo account is completely different from a real account, both psychologically and mentally. Putting real money on the line is much harder than playing around with fake simulation money. Thus, it is advised to start with a small amount and get used to it before moving to larger sums of money and increasing the trading capital.
After everything is went through and all hills are climbed, the top of the mountain will be reached. Of course, being a professional trader does not necessarily signify that there will be no failing trades and the win rate will always be above 90%. Losing days, weeks and even months will always happen. However, as long as you diversify your portfolio, stay cold-blooded, disciplined, and follow risk management principles, you will be profitable in the long-run.

The importance of confirmationsHey Traders,
How many times in your trading career have you had a set up that you are so confident in and is so clean that you just enter it without checking for confirmations? How many times have you seen price retract into a demand or supply area with so much force that you simply think it cannot go wrong? This trade setup right here is a prime example of why it is so important to check for confirmations and ensure that the lower time frames are indicating exactly what you want to see prior to entering a trade and not entering a trade out of fear of missing out and buying as soon as the price dips into a demand zone. Let me know in the comments if this relates to you or you've ever had an issue like this.
The analysis on the four hour had me very confident once we had broken over the recent highs. We indicated after a very long and steady downtrend that we could potentially start seeing a movement to the upside. Once we did get a clear structure break, it was followed by a strong push to the downside in which I like to call The Archers pullback. Price retraced straight back down into our demand area, which means we ticked step one and now we were looking for step 2 and Step 3.
As you can see, looking at the one hour chart, we had a steady downtrend formed prior to having a strong news release which pushed price down into the demand zone. Once we had this trendline formed, what I simply wanted to see was an area of consolidation, potentially a descending channel. Then a break of this trend line followed by a pull back followed by a break of structure down on the 15 minute. But what you can notice is as we have this trendline drawn an we dip into the demand zone, that price didn't break the trend line. It simply went sideways and did form a descending channel, but to the point where we broke the recent demand and set a lower low. In turn, it made this analysis invalid.
It is highly important that with all trade setups like this, especially trading the higher time frames, that we dive into the lower timeframes to ensure that the demand or the supply is entering the market the way we're anticipating so we can trade the distance with confidence. If we do not wait for confirmations then we are sitting blind and entering what you would call FOMO trades. Entering with much higher risk. As we can see here, price can just rip straight through these areas and we must be prepared to not take trades. If we were to enter blindly into these areas, this trade would of resulted in a loss on the account.
Do you find this analysis helpful? Should we chat more about this in the future?

Busy Signal - Gamblertrading is not gambling and gambling is not trading , but like expert gamblers the best traders must think of trading as a numbers game and probability to produce consistent results. Probability may suggest inconsistency but it can still produce consistent results over a large sample of trades if the edge is good enough and is applied consistently.
there is no such thing as ''prefect science'' in trading but there are occurrences in the market that are critical to understand and these can only be discovered by research and experience.
It just takes practice and a lot of screen time to master this art, so be patient, your mind and eye need training, and lots of screen time till it
becomes second nature to you.
“"Easy money" means only one thing when it means money that has come easy: It means money goes even more easily than it came.”
Edwin Lefevre
Being a weekend trading warriorYour results on Monday will be influenced by the work that you do on the weekend, specifically Sunday.
As an intraday trader I constantly think about my trading.
Here are a few points which every trader should focus on,
1 - Mapping our mental weaknesses
We all have mental challenges, some of us have a lot of FOMO,
while others oversize and over trade, you know what is holding
you back as a trader... FIND IT AND WORK ON IT!
2 - Reviewing trades (winners & losers)
Search for the plays where you can add size,
search for patterns that you can exploit next week,
review your best trades. What trades worked best for you?
more of these on Monday. What trades are not working for you? Eliminate them.
3 - Checking for key levels & patterns
The best in every industry practice and train... yet probably 90% of traders never
really do any kind of practice, they search for a strategy and then cannot wait to apply
it to the markets... real traders work on their trading hence they create REAL SKILLS!

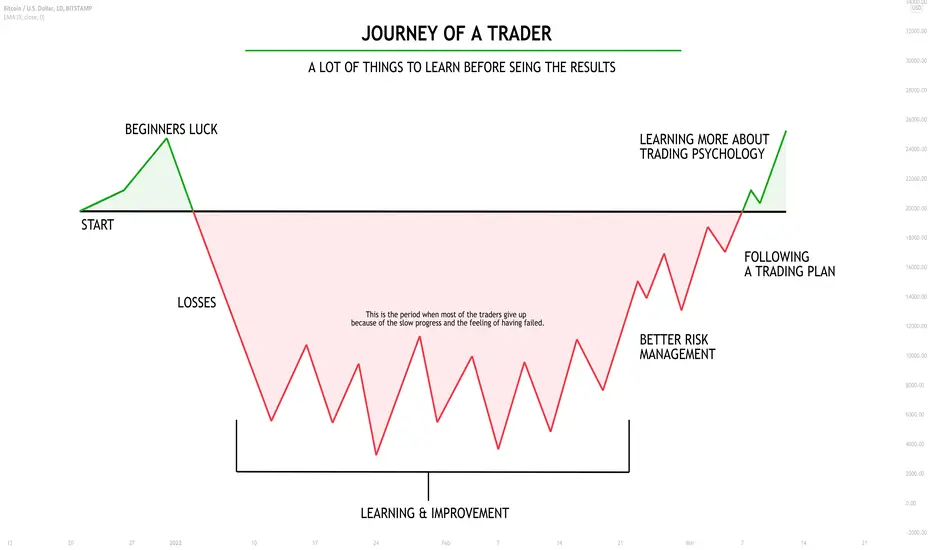
The Journey of a Trader 🛣🚶
Hey traders,
Why 95% of traders fail?
In this post, we will discuss the trader's road to success and why most of the traders give up at the halfway point.
On the chart, I was trying to portray the journey of a trader:
most of the traders start this game with gambling.
They randomly buy and sell the market relying on their intuition and with a high degree of probability end up with nice cush.💰
However, as they proceed they realize that the profits that they made were the product of luck, not skill. 🍀
The more they trade, the less they win.
At some moment losing trades start to outperform winners.
Trying different things, jumping from one strategy to another, one comes to the conclusion that nothing seems to work.🙅♂️
He goes broke, he is panicking.
At that stage, the majority blame the market for their failure.
Forex, stocks, gold trading is complete scam.
Making profits on the market is not possible.
They give up and leave.👣
Only 5% are persistent. Only 5% are blaming themselves not the market for their failure.
They start following a strict trading plan, they follow risk management recommendations of pro traders and at some moment they start making 0.📝
Buying and selling the market, at the end of the day, they don't lose anymore.
That is the most important milestone in a trader's journey.
Realizing that the one stopped losing, a trader starts polishing and improving his rules in order to achieve better results.
He trains and works with his psyche.💪
After years of struggling, one finally contemplates a consistent account growth.
He became a pro trader.🏆
I wish you to be persistent, traders and don't give up.
Patience pay and at the end of the day winners win.
❤️Please, support this idea with like and comment!❤️
How To Trade Hey guys, I created a system that would allow you to trade better. I call it the 3-way. This is when the market leaves signs and expects you to spot them. The first is: Pattern. For pattern, you can decide which is it for you.. P.S: You don't have to use my pattern. However, only use it of that's the common pattern in the instrument you're trading. Secondly, Divergence. Divergences are my go-to anytime, any day. Reason is because, divergences show up as a warning. Pay attention. Lastly, Structure. Even after finding a pattern and divergence, the structure has to be in-line with the confluences.
watch to digest!
leave a like, follow and comment if you found this useful.
Cheers,
Lazyluchi
