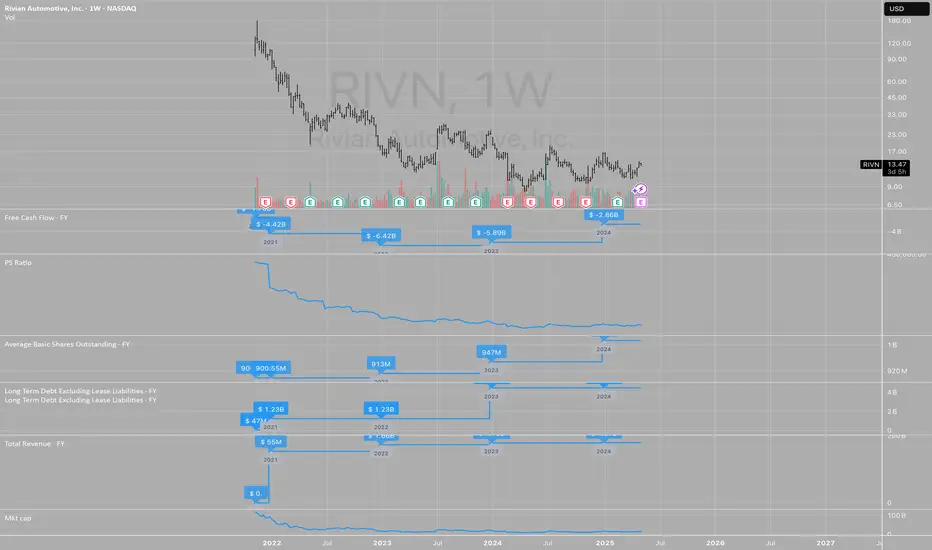
Tim's Fundamental View LayoutHere is the way that I view any stock for an initial analysis to get an idea of what the market is valuing and viewing the company.
I first look at the free cash flow, so that is directly under the price chart. Free cash flow is the life-blood of the company and can be used to pay dividends and to reinvest in the company to grow the top line or to buy back stock.
Next I look at the PSR or Price-To-Sales-Ratio. This ratio is paramount for me since the top line shows up first for companies and is the starting point for analysis. Companies with low or no sales growth get priced very differently from companies with high growth. Start with sales growth in your analysis. There are many great books on the topic written by Kenneth L. Fisher, the creator of the tool.
Next "Avg Basic Shares Outstanding" to see if the company is constantly diluting investors and raising capital or hiding expenses by giving out stock options each year. Old companies in slow growth industries tend to buy back stock and growth companies grow shares outstanding and is a strong headwind for investors.
Next is "Long Term Debt"... which is another extremely important variable to look at with any company. In the long run, debt is the cheapest capital since you can pay it off cheaply but it can also drag down a company when the future is uncertain and unpredictable. Companies with predictable sales and growth often load up on debt which enhances returns for equity owners, but increases the risk long term. Jet Blue NASDAQ:JBLU is case in point for this as in 2000 before the pandemic it had a $5 billion market cap with $1 billion in debt and now it has over $8 billion in debt and the market cap is down to $1.5 billion. It is very difficult to get out from under such a heavy debt load. Debt can be "death" for any company if overused.
Next is "Revenue" graphed annually. Essential to see if inflation impacts sales growth or if it can't keep up with inflation. The last 5 years was between 20%-50% inflation depending on the industry so if a company doesn't have higher revenues by at least 20% since 2019, then this reveals a weakness in their pricing power which is a very competitive market with likely declining or low margins.
Last is "Market Cap". It is always good to know the market capitalization of any stock that you own. It is the foundation for understanding if any investor would ever want to buy the whole company and what would it cost to buy it and what are the "returns" from owning the whole company.
I hope you can copy this layout for your own so you too can have a one-page view of the history of a company to help you get your mind around its valuation and potential along with understanding the risks all in one, easy picture.
Community ideas
Bitcoin Stabilizes at $94,000 — What's Next?Following a strong rally in early 2025, Bitcoin is now showing signs of stabilization, hovering around the $94,000 mark. For a notoriously volatile asset, this steady price movement might seem unusual. However, this calm may be the calm before the storm—either a breakout or a pullback. So, what’s behind this current phase of Bitcoin’s price?
Firstly, all eyes are on the U.S. Federal Reserve. Investors are nervously anticipating its next interest rate decision. As always, monetary policy acts as a major catalyst for risk assets. A rate cut could boost inflows into the crypto market, while a hike might lead to capital outflows and dampen sentiment.
Secondly, retail investor activity appears to be cooling. Trading volumes have declined compared to the high levels seen in February and March, when the market was filled with euphoria. Now, we are witnessing a period of cautious waiting. The "Fear and Greed Index" reflects this, hovering around neutral territory, indicating market indecision.
From a technical standpoint, analysts identify two key levels: strong resistance near $100,000 and a support zone around $90,000. As long as Bitcoin remains within this range, short-term traders are operating in a sideways market while longer-term investors remain on standby.
Beyond macroeconomic factors, crypto-specific developments will also influence BTC’s price. Important upcoming events—such as Ethereum’s upgrade, potential regulatory changes in the UK and Japan, and global crypto conferences—could all act as catalysts.
Institutional investors are another major factor. Companies like MicroStrategy continue to accumulate Bitcoin, adding confidence to the asset’s long-term outlook. If more institutions follow suit, Bitcoin could see increased demand and stronger bullish momentum.
In the near term, market participants are advised to stay cautious. Bitcoin may continue consolidating until a clear macro or market-specific catalyst emerges.
All in all, $94,000 is more than just a number. It represents a temporary equilibrium of forces—bullish and bearish. The question is not whether Bitcoin will move again, but when and in which direction.

Why Financial Clarity Comes Before Any Forex Trade?Before any strategy or setup, I ask one thing: is my personal financial foundation strong enough to support this trade?
In this reflection, I explore the direct impact that personal finance management has on trading performance — not as an abstract idea, but as a daily reality. When financial clarity is missing, emotional decision-making creeps in. When it’s present, I trade with more patience, discipline, and perspective.
This is not trading advice. It’s a caution to those who see trading as a way out, rather than something built upon stable ground.
Guess what? I am on a Demo Account. I will keep on trading on a Demo Account until I know that I have a solid risk management plan and a trading methodology that both will give me consistent profits.
The whole Idea with personal finance management in forex trading is to know whether you can afford trading and once you know the answer to that what is your game plan.
Just a quick hint.. If your answer is no; meaning that today you cannot afford trading, don't be discouraged, there is still a plan that can be designed. Actually, I think the ones who cannot afford trading are in a better positions than those who can.
The ones who cannot afford trading today, can easily start learning without having the itch to open a live account.
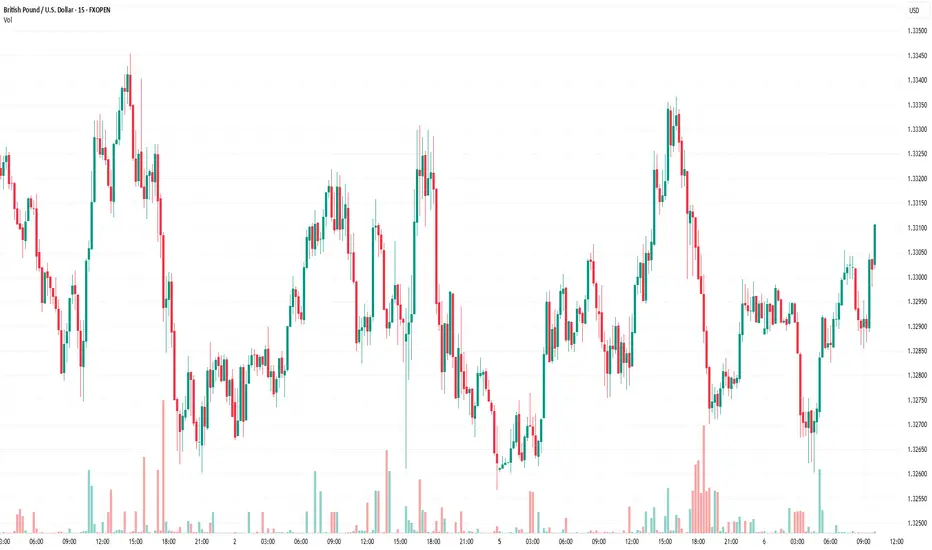
Why Volume Bar Colors Can Mislead You█ The Truth Behind Volume Bars — What Do Green and Red Actually Mean?
Most traders learn early on that green volume bars mean bullish activity, and red bars mean bearish pressure. But is it really that simple? What does volume truly reflect, and are we making assumptions that can mislead us?
█ What Volume Actually Is
Volume represents the number of shares/contracts traded during a specific time interval. Every transaction includes both a buyer and a seller. So, volume itself doesn’t distinguish whether a trade was bullish or bearish. Instead, platforms color volume bars based on price movement:
Green: If price closed higher than it opened.
Red: If price closed lower than it opened.
Some platforms, like TradingView, allow you to color volume based on whether the price closed higher or lower than the previous candle’s close.
So YOU, as a trader, have the chance to decide whether to assign volume bars either bullish or bearish! It’s a setting parameter anyone can change. Traders around the globe might look at the same volume bar, but some interpret it as bearish, while others interpret it as bullish. What is the most correct way?
█ The Assumption Behind the Color
This coloring assumes that:
A rising price means buyers were more aggressive (lifting the ask).
A falling price means sellers were more aggressive (hitting the bid).
This is a proxy — an approximation. It simplifies market pressure into a binary outcome: if price goes up, it's bullish volume; if it goes down, it's bearish. But the market isn't always so binary.
However, the assumption is only an approximation of buying vs. selling. In reality, every single trade involves both a buyer and a seller, so volume itself isn’t inherently “buy” or “sell” – what matters is who initiated the trades. As one trading expert explains, talking about “buying volume” vs “selling volume” can be misleading: for every buyer there is a seller, so volume cannot be literally split into purchases and sales. Instead, what traders really mean by “bullish volume” is that buyers were more aggressive (lifting offers) and drove the price up, whereas “bearish volume” means sellers were more aggressive (hitting bids) and drove the price down. The colored volume bar is essentially a proxy for which side won the battle during that bar.
█ Why This Can Mislead You
Price might close higher, not because there were more buyers than sellers (there never are — every trade has both), but because buyers were more urgent. And sometimes price moves due to other forces, like:
Short covering.
Stop-loss runs.
Liquidity vacuums.
This means a green bar might not reflect strong demand, just urgency from the other side closing their positions.
⚪ Example:
Take the well-known GameStop short squeeze as an example. If you looked only at the volume bars during that rally, you’d see a wall of strong green candles and high volume, which might suggest aggressive bullish buying.
However, that interpretation would be misleading.
Under the surface, the surge wasn't driven by fresh bullish conviction — it was massive short covering. Traders who were short were forced to buy back shares to cover their positions, which drove prices even higher. The volume was categorized as bullish, but the true intent behind the move had nothing to do with new buying pressure.
This demonstrates why relying solely on volume color or candle direction can lead to false conclusions about market sentiment.
Does this simple up/down volume labeling truly reflect buying vs. selling pressure? To a degree, yes – it captures the net price outcome, which often corresponds to who was more aggressive. For example, if many buyers are willing to pay higher prices (demand), a bar will likely close up and be colored green, reflecting that buying interest. Conversely, if eager sellers are dumping shares and undercutting each other, price will drop, yielding a red bar that flags selling pressure. Traders often use rising volume on up-moves as confirmation of a bullish trend’s strength, and high volume on down-moves as a warning of distribution, which indeed aligns with traditional analysis
That said, the method has important limitations and nuances, documented both anecdotally and in research:
⚪ Volume is not one-dimensional: Since every trade has both a buyer and seller, one cannot literally count “buy volume” vs “sell volume” without more information. The green/red coloring is a blunt classification based on price direction, not an actual count of buys or sells. It assumes the price change direction is an adequate proxy for the imbalance of buying vs. selling. This is often true in a broad sense, but it’s not a precise measure of order flow.
⚪ Intrabar Dynamics Are Lost: A single bar’s color only tells the end result of that interval, not the story of what happened during the bar. For instance, a 4-hour candle might be red (down) overall, but it could have contained three hours of rally (buying) followed by a steep selloff in the final hour that erased the gains. The volume bar will be colored red due to the net price drop, even though significant buying occurred earlier in the bar. In other words, a large red bar can mask that there were pockets of bullish activity within – the selling just happened to win out by the close of that period. Without looking at smaller time frames or detailed data, one can’t tell from a single color how the buying/selling tug-of-war progressed within the bar.
⚪ Gap Effects and Criteria Choices: The choice of using open vs. close or previous close can alter the interpretation of volume. As discussed, a day with a big gap can be labeled differently under the two methods. Neither is “right” or “wrong” – they just highlight different perspectives (intraday momentum vs. day-over-day change). Traders should be aware that colored volume bars are an approximation. A green volume bar under one method might turn red under the other method for the same bar. This doesn’t mean volume changed – it means the classification scheme changed. For example, a stock that closes below its open but still higher than yesterday will show a red volume bar by the intraday method but would be considered an “up-volume day” in OBV terms (previous close method).
⚪ No Indication of Magnitude or Commitment: A single color also doesn’t convey how much buying or selling pressure there was, only which side won. Two green volume bars might both be green, but one could represent a modest uptick with tepid buying, whereas another could represent an aggressive buying spree – the color alone doesn’t distinguish this (other than one bar likely being taller if volume was higher). Traders often need to consider volume relative to average (e.g. using volume moving averages or looking for volume spikes) to judge the significance of a move, not just the color.
█ Summary
The coloring of volume bars is a visual shortcut, not an exact science. It’s a guess based on price direction — useful, but imperfect. Understanding this helps traders avoid reading too much into what a green or red volume bar actually means.
-----------------
Disclaimer
The content provided in my scripts, indicators, ideas, algorithms, and systems is for educational and informational purposes only. It does not constitute financial advice, investment recommendations, or a solicitation to buy or sell any financial instruments. I will not accept liability for any loss or damage, including without limitation any loss of profit, which may arise directly or indirectly from the use of or reliance on such information.
All investments involve risk, and the past performance of a security, industry, sector, market, financial product, trading strategy, backtest, or individual's trading does not guarantee future results or returns. Investors are fully responsible for any investment decisions they make. Such decisions should be based solely on an evaluation of their financial circumstances, investment objectives, risk tolerance, and liquidity needs.

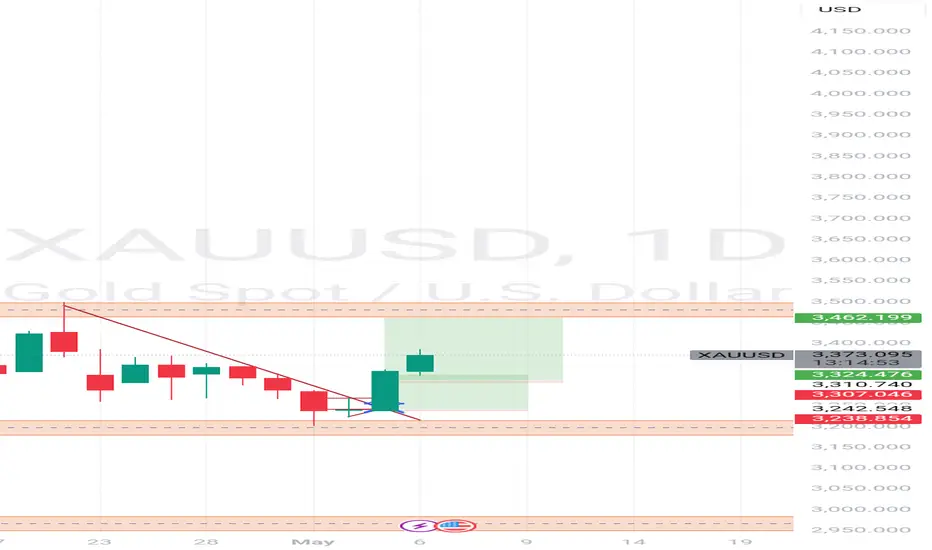
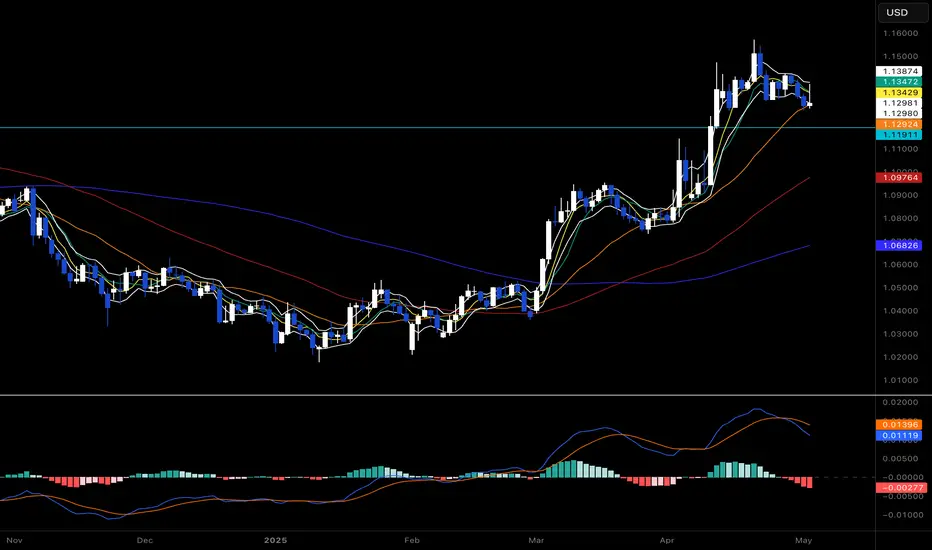
Weekly analysis confirmation and continuation!!!Top-Down Analysis of the Image.
1. Macro Context: Asset Classes & Instruments
- USD & XAUUSD. The image focuses on two key financial instruments:
- USD.l Likely tracking the US Dollar Index (DXY) or a USD-paired asset.
- XAUUSD**: Gold priced in USD, a critical safe-haven commodity.
- Bearish Sentiment**: Both sections show descending price levels, indicating a broader market expectation of dollar strengthening and gold depreciation.
---
2. USD Section: Price Structure & Anomalies*
- Key Levels**:
- Starts at 3,500.000 (potential resistance) and trends downward to 3,375.845*l (support).
- Notable mid-level dip at 3,462.199 , possibly a liquidation zone or failed breakout at 33:46
- Hypothesis : Time notation (e.g., 33 minutes and 46 seconds) for a specific trading session or chart timeframe.
- Hypothesis 2. Ratio (e.g., 33:46) for risk-reward or position sizing.
---
3. XAUUSD Section: Gold’s Downward Trajectory
- **Declining Values**: From **3,324.476** to **3,238.854**, reflecting a **bearish technical breakdown**.
- **Purpose**: Likely marks **resistance levels** or **liquidation clusters** where sellers dominate.
---
#### **4. Gold-Short/Un-Subtotal: Strategic Short-Selling Plan**
- **Uniform Decrements**: Values decrease by **40.000** increments (e.g., 3,160 → 3,120 → 3,080).
- **Interpretation**: Predefined **profit-taking levels** or **trailing stop-loss zones** for a short position.
- **Risk Management**: Structured steps suggest a disciplined exit strategy to lock in gains or mitigate losses.
---
#### **5. Final Line: "May 4 7 9"**
- **Possible Meanings**:
- **Dates**: May 4, 7, and 9 could mark:
- Economic events (e.g., Fed meetings, NFP data).
- Expiry dates for options/futures contracts.
- Planned trade execution days.
- **Code**: Numeric shorthand for order IDs, time intervals (e.g., 04:07:09), or technical indicators.
---
### **Key Takeaways**
1. **Strategic Trade Setup**: The image outlines a **short-selling strategy for gold (XAUUSD)** with explicit price targets and risk parameters.
2. **Technical Focus**: Emphasis on descending levels highlights reliance on **technical analysis** (e.g., trendlines, Fibonacci retracements).
3. **Date-Driven Execution**: "May 4 7 9" suggests alignment with external catalysts or time-bound trade management.
4. **Risk Control**: Uniform decrements in the Gold-Short section reflect systematic profit-taking, reducing exposure to volatility.
---
### **Recommendations for Further Analysis**
- Cross-reference the dates (May 4, 7, 9) with economic calendars to identify relevant events.
- Validate the "33:46" notation against historical price action or trading session hours.
- Assess whether the USD levels correlate with DXY or a specific USD pair (e.g., EURUSD).
This structured approach aligns with a trader’s playbook, combining technical levels, time-based triggers, and disciplined risk management.
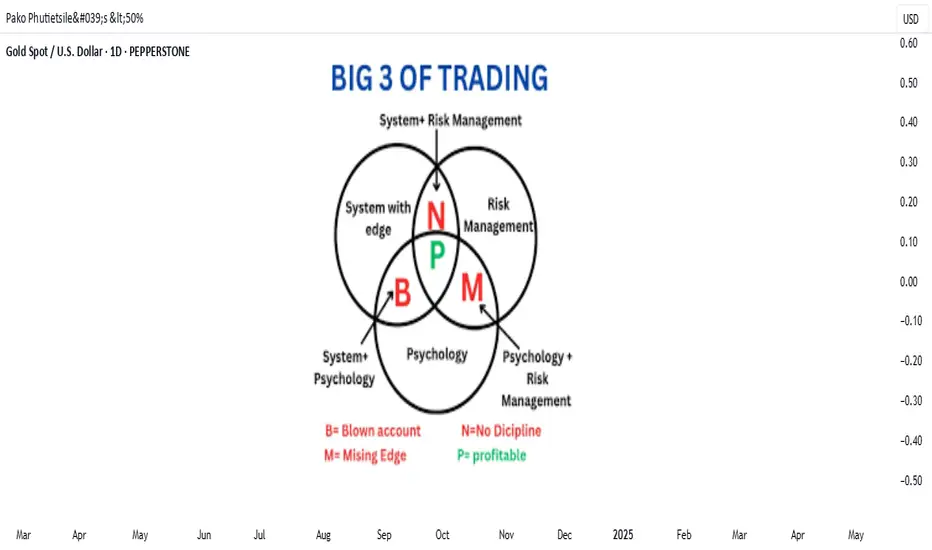
The Trader’s Trinity: THE BIG 3 OF TRADING!Everyone talks about strategies, indicators, and secret setups.
But if you strip trading down to its core, three pillars separate the winners from the quitters.
me @currencynerd , i call them The Big 3:
✅ Mindset/ Psychology
✅ Risk Management
✅ Strategy/ System with edge
You master these — you grow.
You neglect even one — you stay stuck, or worse, blow up.
Let’s dig in.
🧠 1. Mindset: Your Inner Edge
Markets aren't just math — they’re emotion, fear, greed, and uncertainty.
Successful traders:
Stick to plans during volatility
Stay calm after wins or losses
Manage ego (no "I must be right!" trades)
Key mindset habits:
Journaling trades (and emotions)
Setting realistic expectations
Accepting losses as part of the game
🔔 Reminder:
The market doesn't owe you anything. Stay humble, stay focused.
💣 2. Risk Management: Your Lifeline
Risk management isn't sexy — until you realize it's the reason you survive long enough to succeed.
Never risk more than 1–2% of your account on a single trade
Use stop-losses religiously
Understand position sizing — bigger conviction doesn’t mean "bet the farm"
Be comfortable being wrong — because you will be, often
Quote to live by:
"Amateurs focus on returns. Professionals focus on risk."
You don’t need to win every trade. You just need to protect your downside.
📈 3. Strategy: Your Playbook
Strategy gets all the attention — but it's only powerful if Mindset and Risk are already in place.
Your strategy should answer:
When do I enter?
When do I exit?
How do I manage trades in between?
Good strategies:
Are tested (backtested and forward tested)
Are simple (complexity often kills execution)
Fit your timeframe and personality
Trend following, mean reversion, breakout trading, scalping — it doesn’t matter.
What matters is consistency and execution.
🚀 Why the Big 3 Matter More Than Anything Else
Mindset keeps you stable.
Risk Management keeps you in the game.
Strategy gives you direction.
Neglect one and your trading will eventually collapse — no matter how good the other two are.
Successful trading isn’t a magic trick.
It’s mastering boring basics, executed relentlessly.
Final Thoughts from @currencynerd
You don’t need to find the Holy Grail.
You just need to respect the Big 3:
Master your mind.
Respect your risk.
Stick to your strategy.
Most traders are searching for the secret.
Elite traders are perfecting the fundamentals.
Which group are you going to be in?
put together by : @currencynerd
courtesy of : @TradingView
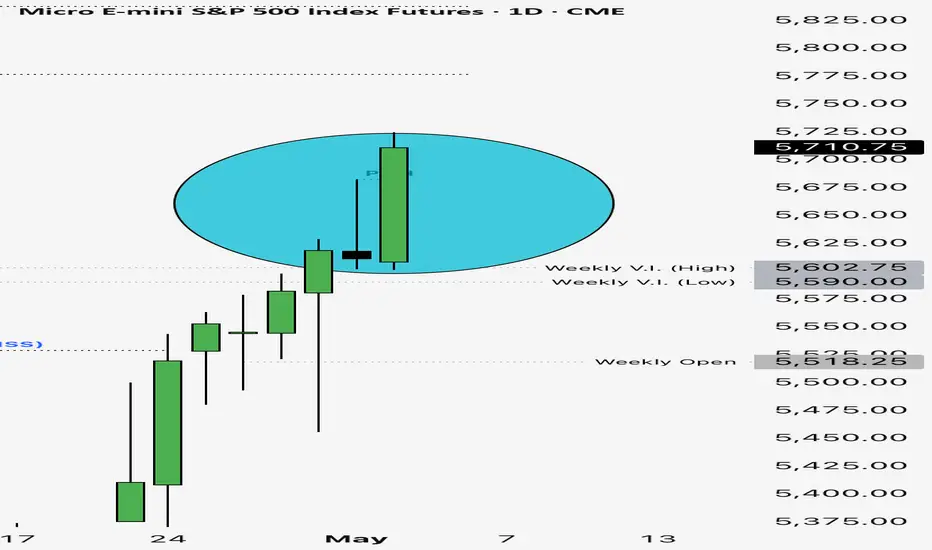
Understanding the Inverted Cup and Handle Chart PatternUnderstanding the Inverted Cup and Handle Chart Pattern
Understanding chart patterns is fundamental for market participants. This article delves into the inverted cup and handle formation, a bearish signal indicating a potential downward movement. Explore its identification, trading strategies, psychological underpinnings, common pitfalls, and more to boost your trading knowledge.
What Is the Inverted Cup and Handle Pattern?
The inverted cup and handle, sometimes called an upside-down cup and handle pattern, is a bearish chart pattern that may appear during up- and downtrends. It is the opposite of the traditional cup and handle pattern, which is bullish. The inverse formation consists of two main parts: the "cup," which is an inverted U-shape, and the "handle," a small upward retracement following the cup.
Identifying the Inverted Cup and Handle Pattern
Identifying the inverse cup and handle pattern involves recognising a specific sequence of market movements that signal a potential bearish move. Here's a step-by-step overview of identifying this formation:
Cup Formation
- Shape: The pattern begins with an inverted U-shaped "cup." The price gradually rises, consolidates, and then begins to decline, reflecting a shift from bullish to bearish sentiment.
- Depth: The cup should have a rounded top, not a sharp V-shape, indicating a gradual reversal. The depth of the cup can vary but typically represents a significant portion of the preceding movement.
Handle Formation
- Upward Retracement: After the cup's formation, prices usually experience a minor upward retracement or consolidation, forming the "handle." This movement should be relatively short and not exceed the initial high of the cup.
- Shape and Duration: The handle often appears as a small flag or pennant and should be brief in duration compared to the cup. An optimal handle retraces no more than half of the cup’s depth.
Breakout Confirmation
- Neckline Break: The pattern is confirmed when prices break below the neckline, the lowest point of the handle. This breakout often leads to a significant decline in prices, signalling a bearish trend.
- Volume Surge: Volume typically decreases during the formation of the cup and increases as prices decline, especially during the handle formation. A substantial increase in volume during the breakout can validate the pattern and minimise the risk of false signals.
The Psychology of the Inverted Cup and Handle
The psychology behind the inverse cup and handle pattern is rooted in market sentiment and behavioural finance. This bearish pattern reflects a shift from optimism to pessimism among traders.
- Initial Uptrend: The formation starts with an upward movement, where traders are generally bullish, driving prices higher. This phase is marked by growing confidence and increasing demand.
- Formation of the Cup: As prices peak, consolidate, and start to decline, some traders begin to take profits, leading to reduced buying pressure. The rounded decline of the cup signifies a gradual shift in sentiment from bullish to bearish as traders become cautious and selling pressure mounts.
- Handle Formation: The minor upward retracement forming the handle indicates a brief period of consolidation where the market tests the resolve of buyers. It can be considered a dead cat bounce. This phase often traps optimistic traders who expect the uptrend to resume, but the overall sentiment remains fragile and cautious.
- Breakout and Decline: The decisive break below the neckline represents a culmination of bearish sentiment. At this point, selling pressure overwhelms any remaining bullishness, leading to a sharp decline. The volume surge during this breakout confirms the shift in market psychology from hopeful to bearish as traders rush to exit their positions or initiate short sales.
Trading the Inverted Cup and Handle Pattern
Trading the inverted cup and handle pattern involves careful identification and strategic decision-making to maximise potential returns. This pattern presents two primary entry points for traders: during the handle formation or after the neckline break.
Entry on the Break of the Handle
- Risk-Reward Advantage: Entering on the breakout of the handle’s lower boundary offers a better risk-to-reward ratio but requires more skill and confidence in pattern recognition.
- Technical Tools: Traders often use a medium-term moving average (like 21 periods) to confirm the downward leg of the handle. A decisive close below the moving average indicates a continuation of the downward handle leg.
- Momentum Indicators: Using momentum indicators like the RSI (Relative Strength Index) or stochastic oscillator helps confirm downward movement. Bearish divergence suggests that the bearish trend is likely to continue.
- Volume Analysis: Increasing volume during the handle's breakout indicates strengthening seller control. High volume often validates the pattern and potentially reduces the risk of false signals. Note that volume data may be less reliable in a decentralised forex market.
- Stop Loss and Profit Target: Traders typically place a stop loss above the handle's high to potentially protect against upward spikes. The reverse cup and handle pattern target is usually set at a distance equal to the cup's height, projected downward from the handle's breakout point, although it can be greater if the retracement is particularly shallow.
Entry After the Neckline Break
- Confirmation Advantage: Waiting for the neckline break offers greater confirmation of the formation but may provide a less favourable risk-to-reward ratio.
- Price Action: A decisive close below the pattern's low, ideally with a strong candlestick and minimal wicks, indicates a reliable breakout. This typically confirms the bearish trend and provides a clear entry signal.
- Volume Confirmation: Higher volume during the neckline break can further validate the pattern and indicate that the breakout is genuine and not a false signal.
- Stop Loss and Profit Target: In this scenario, the stop loss is typically set above the handle's high. The profit target remains the same, projecting the cup's height downward from the breakout point.
Common Mistakes to Avoid
When trading the upside-down cup and handle pattern, avoiding common mistakes is key for maximising potential returns. Some of the more common mistakes traders make include:
- Premature Entry: Entering a trade too early, before the handle completes or the neckline breaks, can lead to false signals and losses. Most traders wait for clear confirmation, such as a decisive close below the neckline with increased volume.
- Ignoring Volume: Volume is a critical component in confirming the pattern. Low volume during the breakout phase may indicate a fakeout. Traders typically look for a substantial increase in volume to validate the pattern.
- Incorrect Pattern Identification: Misidentifying the pattern is a common error. The cup should have a rounded bottom, not a sharp V-shape, and the handle should be relatively short. Accurate identification requires practice and attention to detail.
- Overlooking Market Conditions: External factors, such as news events or broader market trends, can impact the pattern’s reliability. Traders consider these conditions when planning their trades.
Advantages and Disadvantages
As with all chart patterns, the inverted cup and handle pattern comes with its pros and cons. Here are some key advantages and disadvantages of using this pattern:
Advantages
- Clear Signal: The pattern provides a clear signal of a potential bearish movement, helping traders anticipate market declines.
- Risk Management: With defined entry and exit points (handle high for stop loss and cup depth for profit target), it aids in effective risk management.
- Flexibility in Analysis: Several forms of analysis, from support/resistance and momentum indicators to volume and price action, can be used to trade the pattern.
- Versatility: Applicable across various timeframes and markets, including stocks, forex, and commodities, making it a versatile tool for different trading strategies.
Disadvantages
- Complex Identification: Accurately identifying the pattern can be challenging, requiring significant experience and skill.
- Rarity: The pattern doesn’t occur frequently, limiting trading opportunities.
- False Breakouts: Like all chart patterns, it is susceptible to false breakouts, especially if not confirmed with volume and other technical indicators.
- Timing Sensitivity: Entering too early during the handle formation can result in premature positions, while waiting for the neckline break might reduce the risk-to-reward ratio.
The Bottom Line
The inverted cup and handle pattern is one of the most popular chart patterns among traders of all levels. However, like any technical formation, it should be used alongside other indicators and sound risk management to potentially increase its effectiveness. By mastering patterns like the inverted cup and handle, traders can gain deeper insights into market psychology and price action to navigate volatile markets with greater confidence.
FAQ
What Is the Inverse Cup and Handle Pattern in Forex?
The inverse cup and handle pattern in forex is a bearish chart pattern. It features an inverted U-shaped cup followed by a small upward retracement (the handle). This pattern suggests that sellers are gaining control, and prices are likely to decline further once the neckline is broken.
How Can You Trade the Inverse Cup and Handle?
Traders can enter positions either on the break of the handle’s lower boundary or after the neckline break. Entering during the handle might offer a better risk-to-reward ratio, while waiting for the neckline break provides greater confirmation. Key tools to validate the breakout include moving averages, momentum indicators like RSI or stochastic oscillator, and volume analysis.
What Happens After the Reverse Cup and Handle Pattern?
After the reverse cup and handle pattern is completed, the price typically moves downward strongly. This bearish movement is often confirmed by a strong breakout below the neckline with increased volume, signalling a sustained decline in prices.
What Is the Opposite of the Cup and Handle?
The opposite of a cup and handle is the inverse cup and handle pattern. While the cup and handle indicates a bullish movement, the inverse version signals a bearish trend.
Is the Inverted Cup and Handle Bullish or Bearish?
The inverted cup and handle pattern is bearish. It indicates that the price will move downwards, suggesting that traders may open short trades.
This article represents the opinion of the Companies operating under the FXOpen brand only. It is not to be construed as an offer, solicitation, or recommendation with respect to products and services provided by the Companies operating under the FXOpen brand, nor is it to be considered financial advice.
A 3-Step Process For Analytical SuccessIn this video I go through the 3-step process of implementing a Bias, Narrative, and Model.
This process was a game-changer for me when it came to analysis, as well as taking actual trades. It considered high-probability targets, patience in waiting for traders to coming for me, and the calm of being prepared when it was time to take an entry. It filters out pointless trades, because if I don't have Bias, then I can't have a Narrative, and if I don't have a Narrative, then I don't have a Model.
I use ICT concepts, but this process works equally well for most other methodologies that aren't completely mechanical and algorithmic.
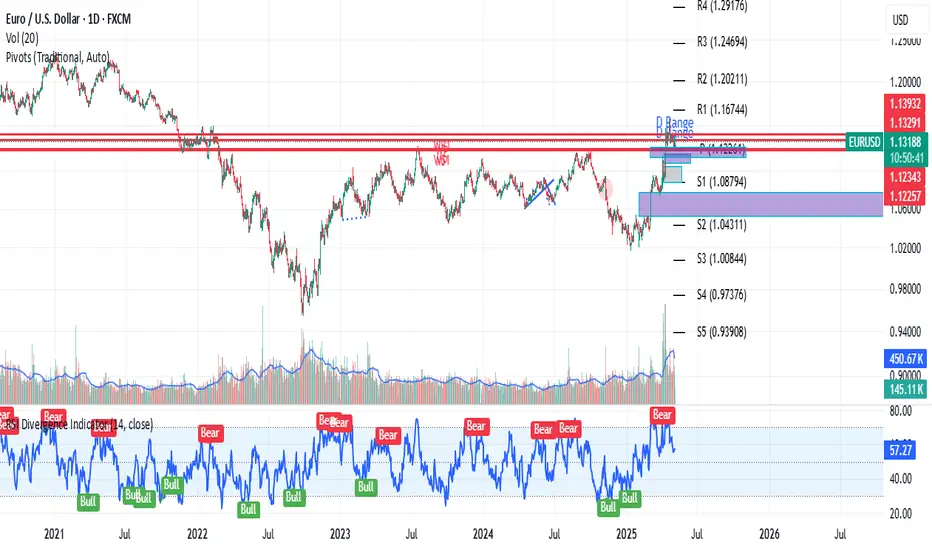
I give a real example of a trade I took yesterday on EURUSD where I utilized this 3-step process to frame a trade.
I hope you find this video insightful and gives you more clarity in your trading!
- R2F Trading

Session Realtime BarJust an idea for better visuals, use 2 of the SessionBar indicator on the chart use the spacing setup with the active bar to the left of the overnight bar in the other indicator...
One indicator for the Active Session Bar: indicating the current session bar.
2nd indicator for the Overnight Session Bar: indicating the overnight session bar.

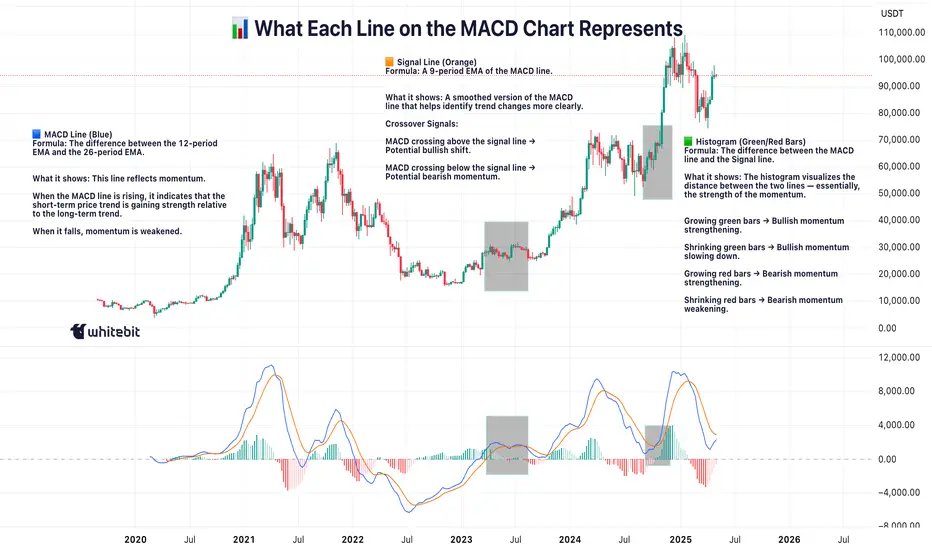
MACD: More Than Just a Crossover ToolHello, traders! 🔥
The MACD (Moving Average Convergence Divergence) indicator is one of the most trusted tools in technical analysis — but often one of the most oversimplified. While many traders focus on signal line crossovers, the real power of MACD lies in its ability to visualize market momentum, subtle shifts in trend strength, and early signs of potential reversals.
Let’s unpack how MACD behaves using the weekly BTC/USDT chart ✍🏻.
🔧 Understanding the Mechanics
At its core, MACD is the difference between two exponential moving averages — typically the 12-period EMA and the 26-period EMA. The result is the MACD line (blue). The orange line represents a 9-period Exponential Moving Average (EMA) of the MACD line, commonly referred to as the signal line. The histogram reflects the distance between them, helping to visualize when momentum is building or fading.
📊 MACD in Action — Weekly BTC Chart Breakdown
Looking at the BTC/USDT weekly chart, several notable MACD behaviors stand out:
1. The Bullish Acceleration in Early 2023
In early 2023, MACD crossed above the signal line, accompanied by a sharp rise in the histogram. This indicated strong positive momentum, as the price began recovering from the 2022 lows. The histogram’s expansion confirmed increasing divergence between the short- and long-term EMAs — a classic sign of trend acceleration.
2. Peak Momentum in Late 2023
Around late 2023, the MACD line peaked while the histogram also reached maximum height. This wasn’t just a confirmation of strength — it also hinted that momentum may have reached a climax. Despite price continuing to rise slightly, the MACD curve started to flatten — an early warning of potential exhaustion in trend strength.
3. Bearish Convergence into Q1 2025
In early 2025, the MACD line turned downward and eventually crossed below the signal line, while the histogram flipped to red. This reflected a cooldown in bullish momentum rather than an immediate reversal. What’s notable is how price didn’t collapse sharply, but moved into a pullback phase — illustrating how MACD can show momentum softening before price visibly reacts.
📌 What This Can Tells Us
The MACD indicator on this weekly BTC chart shows how momentum often shifts before the trend itself breaks. Each crossover, divergence, or histogram change is not a guarantee, but a cue to pay closer attention.
Key takeaways:
Strong Histogram Expansion = Confidence in the Current Move.
Peaks in MACD Without Price Making New Highs = Potential Divergence.
Shrinking Histogram + Converging Lines = Momentum Stalling.
🧠 Final Thought
MACD isn’t just about “buy when it crosses” or “sell on red bars.” It’s a narrative tool, showing how the story of the price develops beneath the surface. On higher timeframes, such as the weekly chart, it can potentially highlight macro momentum shifts long before they become apparent in price action alone.
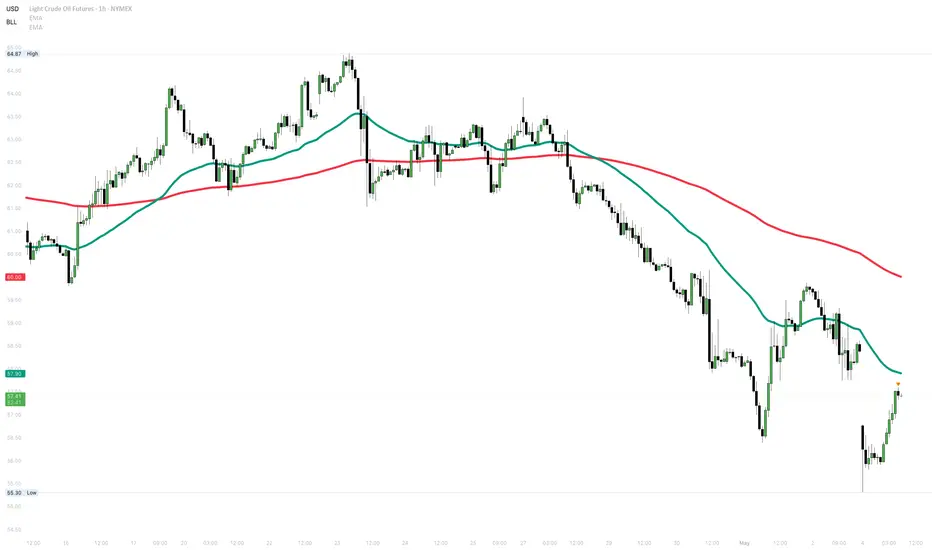
Using Moving Averages Like a ChaseHow Institutions May Be Using Moving Averages to Align Technicals with Fundamentals
Are moving averages just for retail traders and chart watchers? Not if you're JPMorgan Chase.
While many associate moving averages (MAs) with simple trading strategies, institutional giants like JPMorgan Chase likely use them very differently. Instead of relying on MAs to chase trends, they may use them as confluence tools—where technical signals meet macroeconomic insight, risk models, and long-term strategy.
Here’s how JPMorgan might be using moving averages across their medium- to long-term investments—and what you can learn from it.
📊 1. Moving Averages as Investment Benchmarks
At the institutional level, MAs aren’t just "buy/sell" triggers. JPMorgan likely treats the 50-day and 200-day moving averages as dynamic references that help answer broader questions:
Is this trend aligned with the macro picture?
Is this a real shift, or just short-term volatility?
How do fund flows behave around these levels?
Rather than acting on the average itself, JPMorgan probably uses it to validate investment theses and smooth out the noise.
⚙️ 2. Confluence: Where Technicals and Fundamentals Align
In large portfolios, confluence is king. It’s not just about one indicator—but about multiple factors aligning to strengthen conviction.
MAs might be used alongside:
Macro trends (GDP growth, inflation, interest rates)
Sector momentum (e.g. financials vs. tech rotation)
Earnings growth and valuation models
Liquidity flows and volatility data
When a stock reclaims its 200-day MA and fundamentals improve, that’s a green light. When everything lines up, JPMorgan can move with more confidence.
📈 3. A Probabilistic (Not Predictive) Approach
Institutions don’t deal in absolutes—they deal in probabilities. JPMorgan’s quant teams likely test how often certain MA setups lead to favorable outcomes under different market regimes.
So instead of reacting to a crossover, they may ask:
"How often does this setup succeed, given current economic conditions?"
If the odds are strong, they’ll scale in. If not, they’ll wait or hedge. It’s a measured, data-driven approach to timing.
🛡️ 4. Risk Management and Strategic Timing
Moving averages are also incredibly useful for managing portfolio risk. They offer:
Clarity in volatile markets
Timing cues for rebalancing
Visual structure for entries/exits
MAs help JPMorgan place guardrails around long-term positions—keeping strategy in check while avoiding overreactions to noise.
🔍 Final Thought: JPMorgan Isn’t Chasing Trends—They’re Refining Them
The lesson for investors? Don’t treat moving averages as magic lines. Used well, they become tools of confirmation and control, not prediction.
For JPMorgan Chase, MAs are likely just one piece of a much larger puzzle—blending technicals with fundamentals, data science, and market context to execute with precision.
💡 Pro Tip: You can apply the same idea to your own strategy—use moving averages to validate your thesis, not to drive it. Confluence is the key.
From Tulips to Tech: The Evolution of Financial Bubbles 🎯 Introduction:
financial/economic bubbles are a recurring theme in economic history, this is often when a particular financial asset goes to unrealistic price levels often making money for early investors but usually these high price levels do not match their fundamental value this is then followed by a large public participation who also want a piece of the pie eventually with the price collapsing or sharply declining blowing or living investors in a large financial loss..
From 17th-century tulip gardens to 21st-century crypto manias, one thing has remained constant: Humans never learn.
Every generation thinks this time is different — but the pattern of bubbles keeps repeating.
Here's the crash course in 400 years of financial euphoria, panic, and pain.
🧠 Section 1: 1637 — Tulip Mania 🌷
The original bubble.
In the Netherlands, rare tulip bulbs were worth more than houses.
Prices exploded... then collapsed 90% in a matter of weeks.
Lesson: Speculation + FOMO is not new. Humans were flipping flowers before they flipped crypto.
Mini Nerd Tip:
"When people stop caring about value and only care about price rising, watch out."
🧠 Section 2: 1720 — South Sea Bubble 📜
Britain’s South Sea Company promised massive profits trading with South America (but barely did any business).
Politicians and aristocrats pumped the stock price.
Collapsed spectacularly → ruined many fortunes (including Isaac Newton himself:
"I can calculate the motion of heavenly bodies, but not the madness of men.")
Mini Nerd Tip:
"If a bubble needs government help to stay alive, it's already dying."
🧠 Section 3: 1929 — Wall Street Crash 🏛️
Roaring 20s: endless optimism, cheap margin loans, "stocks only go up!"
1929: Stock market crashed, triggering the Great Depression.
People were buying stocks with 10% down and gambling recklessly.
Mini Nerd Tip:
"When leverage is everywhere, the smallest panic causes waterfalls."
🧠 Section 4: 2000 — Dotcom Bubble 💻
Everyone thought the internet would change everything (it did — but slower and differently).
Companies with no profits were valued in billions.
"Eyeballs" were treated as real revenue.
NASDAQ lost 78% from top to bottom.
Mini Nerd Tip:
"Innovation creates real value... but hype inflates fake value faster."
🧠 Section 5: 2008 — Housing Bubble 🏡
Banks handed out mortgages to anyone.
Financial engineering (CDOs, synthetic MBS) created the illusion of safety.
US housing prices collapsed → global financial crisis.
"Too Big to Fail" became the famous phrase.
Mini Nerd Tip:
"If everyone is getting rich easily, someone is lying or blind."
🧠 Section 6: 2017/2021 — Crypto & Meme Stocks 🚀
Gamestop, Dogecoin, NFTs, Shiba Inu — the wildest "everyone’s a genius" market since the 1920s.
Social media + free apps = amplified bubble speed.
Massive rises, insane collapses.
Mini Nerd Tip:
"Technology changes, human emotion doesn’t."
🧠 Final Section: Why Bubbles Will Never End
Greed, fear, and FOMO are timeless.
Every era dresses up bubbles in new clothes (flowers, sea companies, internet, crypto).
Smart traders understand this pattern — and use it to survive and thrive.
"**Bubbles don't pop because of bad assets. They pop because confidence disappears
put together by : Pako Phutietsile as @currencynerd
courtesy of : @TradingView
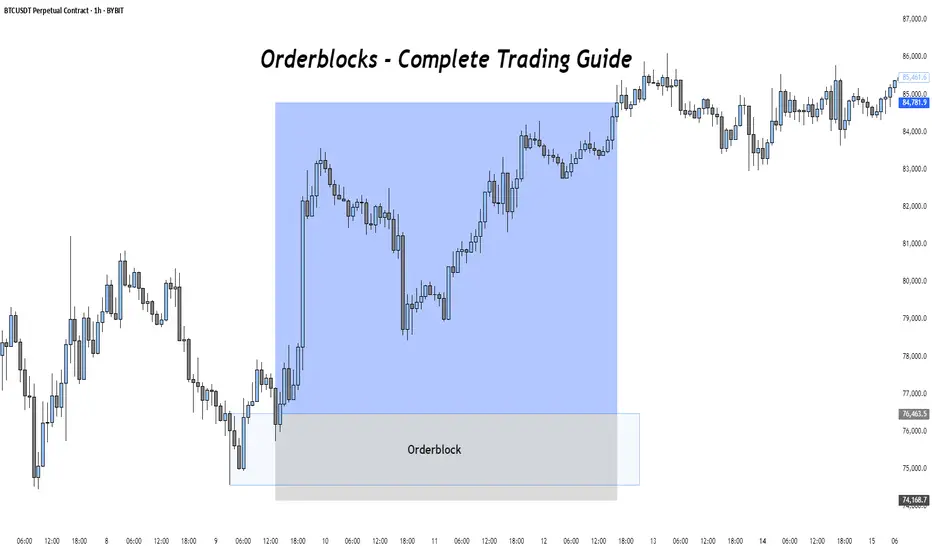
Mastering Order Blocks: How to Trade Like Smart MoneyIntroduction
Order Blocks (OBs) are one of the most critical concepts in Smart Money trading. They represent areas where institutional traders have entered the market with significant volume, typically leading to strong price movements. Identifying and trading Order Blocks gives traders an edge by aligning with the footprints of Smart Money.
What is an Order Block?
An Order Block is the last bearish candle before a bullish move for bullish OBs, or the last bullish candle before a bearish move for bearish OBs. These candles represent areas where institutions accumulated or distributed large positions, leading to a market shift.
Types of Order Blocks
A Bullish Order Block appears at the end of a downtrend or during a retracement just before the price moves sharply upward. It is typically represented by the last bearish candle prior to an impulsive bullish move. Price will often return to this level to mitigate institutional orders before continuing upward.
A Bearish Order Block, in contrast, forms at the end of an uptrend or retracement where price begins a downward reversal. It is characterized by the last bullish candle before a strong bearish move. Price tends to revisit this level to mitigate before continuing lower.
How to Identify a Valid Order Block
The key to identifying a valid Order Block is first observing a strong impulsive move, also known as displacement, that follows the OB candle. The move must also result in a break of market structure or a significant shift in direction. Order Blocks that produce Fair Value Gaps (FVGs) or Market Structure Shifts (MSS) tend to be more reliable. Another important sign is when price returns to the OB for mitigation, offering a potential entry.
Entry Model Using Order Blocks
After locating a valid OB, the next step is to wait for price to return to this area. The ideal entry happens within the OB body or near its 50% level. For extra confirmation, look for a Market Structure Shift or Break of Structure on a lower timeframe. Entries are more powerful when combined with additional elements like Fair Value Gaps, liquidity grabs, or SMT Divergences. The stop-loss should be placed just beyond the OB’s high or low, depending on the direction of the trade.
Refinement Techniques
To increase precision, higher timeframe OBs can be refined by zooming into lower timeframes like the 1M or 5M chart. Within a broad OB zone, identify internal market structure, displacement candles, or embedded FVGs to determine a more precise entry point. One effective refinement is the Optimal Trade Entry (OTE), which is often found at the 50% level of the Order Block.
Order Blocks vs. Supply and Demand Zones
While they may seem similar, Order Blocks are more narrowly defined and specifically related to institutional order flow. Supply and Demand zones are broader and typically drawn around areas of price reaction, but OBs are derived from the final institutional candle before a large move and are often confirmed by structure shifts or displacement. This makes OBs more precise and actionable in the context of Smart Money concepts.
Target Setting from Order Blocks
Targets after entering from an OB should align with liquidity objectives. Common targets include internal liquidity like equal highs or lows, or consolidation zones just beyond the OB. External liquidity targets such as previous major swing highs or lows are also ideal, especially when they align with imbalances or Fair Value Gaps. It's important to adjust targets based on the current market structure and trading session.
Common Mistakes to Avoid
A frequent mistake is treating any candle before a move as an OB without verifying key signals like displacement or a Break of Structure. Entering without other confirmations, such as an MSS or liquidity sweep, can lead to poor trades. Another common error is placing the stop-loss too tightly within the OB, instead of just beyond it, increasing the chance of premature stop-outs. Traders should also avoid executing OB trades during low-liquidity sessions where price action can be unpredictable and wicky.
Final Thoughts
Order Blocks are foundational to Smart Money trading. They allow you to enter where institutions have placed large positions and offer clear invalidation and entry logic. With practice, you can identify high-quality OBs and combine them with other concepts like FVGs, MSS, and SMT for powerful, precise trades.
Practice on different timeframes and assets, and always look for clean displacement and structure confirmation. Mastering OBs is a big step toward becoming a consistently profitable trader.
Trust the Blocks. Trade with Intention.
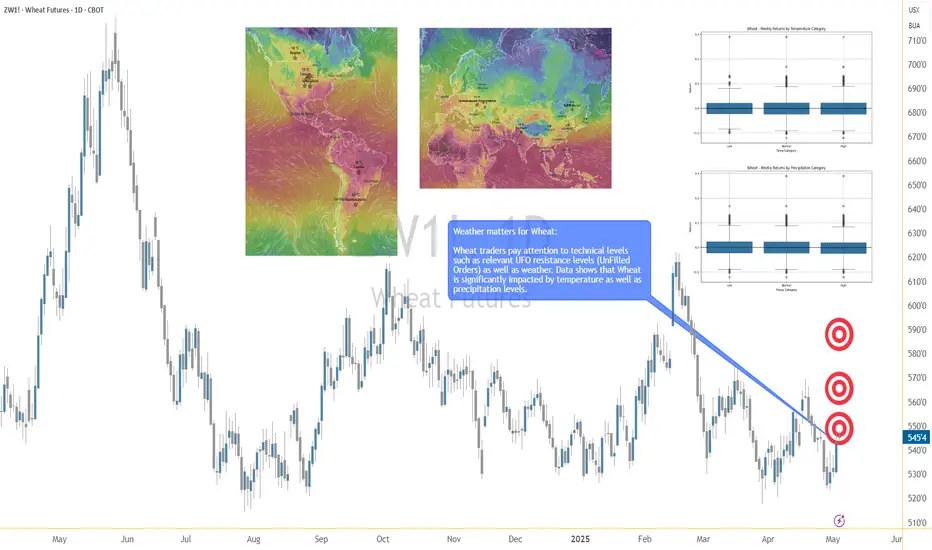
Breadbasket Basics: Trading Wheat Futures🟡 1. Introduction
Wheat may be a breakfast-table staple, but for traders, it’s a globally sensitive asset — a commodity that reacts to geopolitics, climate patterns, and shifting demand from dozens of countries.
Despite its critical role in food security and its status as one of the most traded agricultural commodities, wheat is often overlooked by traders who focus on corn or soybeans. Yet wheat offers a unique combination of liquidity, volatility, and macro sensitivity that makes it highly attractive for both hedgers and speculators.
If you’re new to trading wheat, this guide gives you a solid foundation: how the wheat market works, who the key players are, and what makes wheat such a dynamic futures product.
🌍 2. Types of Wheat and Where It Grows
One of the first things traders need to understand is that wheat is not a single, uniform product. It’s a diverse group of grain types, each with its own characteristics, end uses, and pricing dynamics.
The major classes of wheat include:
Hard Red Winter (HRW): High-protein wheat grown in the central U.S. — used in bread and baking.
Soft Red Winter (SRW): Lower protein, used for pastries and crackers.
Hard Red Spring (HRS): Grown in the Northern Plains; prized for high gluten content.
Durum Wheat: Used for pasta, grown mainly in North Dakota and Canada.
White Wheat: Grown in the Pacific Northwest; used for noodles and cereals.
Each class responds differently to weather, demand, and regional risks — giving traders multiple ways to diversify or hedge.
Major global producers include:
United States
Russia
Canada
Ukraine
European Union
Australia
India
These regions experience different planting and harvesting calendars — and their weather cycles are often out of sync. This creates trading opportunities year-round.
🛠️ 3. CME Group Wheat Contracts
Wheat futures are traded on the Chicago Board of Trade (CBOT), part of the CME Group.
Here are the two key contracts:
o Standard Wheat
Ticker: ZW
Size = 5,000 bushels
Tick = 0.0025 = $12.50
Margin = ~$1,750
o Micro Wheat
Ticker: MZW
Size = 500 bushels
Tick = 0.0050 = $2.50
Margin = ~$175
Keep in mind that margins are subject to change — always confirm with your broker. Micro contracts are ideal for scaling in/out of trades or learning market structure without large capital risk.
📅 4. Wheat’s Seasonality and Supply Chain
Unlike corn or soybeans, wheat is planted and harvested across multiple seasons depending on the variety and geography.
In the U.S., winter wheat (HRW and SRW) is planted in the fall (September–November) and harvested in early summer (May–July). Spring wheat (HRS) is planted in spring (April–May) and harvested late summer.
Globally, things get even more staggered:
Australia’s wheat is harvested in November–December
Ukraine and Russia harvest in June–August
Argentina’s crop comes off the fields in December–January
This scattered global schedule means news headlines about one country’s weather or war (think Ukraine in 2022) can quickly shift sentiment across the entire futures curve.
📈 5. Who Trades Wheat and Why
Wheat is traded by a wide range of participants — each with their own objectives and strategies. Understanding their behavior can give you an edge in anticipating market moves.
Commercial hedgers:
Farmers lock in prices to protect against adverse weather or market crashes.
Grain elevators and exporters use futures to manage inventory risk.
Flour mills hedge their input costs to protect profit margins.
Speculators:
Hedge funds and CTAs trade wheat based on global macro trends, weather anomalies, or technical setups.
Retail traders increasingly use micro contracts to gain exposure to agricultural markets with lower capital risk.
Spread traders bet on pricing differences between wheat classes or harvest years.
🔍 For retail traders especially, micro contracts like XW open the door to professional markets without oversized exposure.
🧠 6. What Makes Wheat Unique in Futures Markets
Wheat is often considered the most geopolitically sensitive of the major grains. Here’s why:
Price can spike fast — even on rumor alone (e.g., export bans or missile strikes near ports).
Production risks are global — the market reacts not just to the U.S. crop, but to conditions in Russia, Ukraine, and Australia.
Storage and quality matter — protein levels and moisture content affect milling demand.
Unlike corn, wheat doesn’t have a single dominant industrial use (like ethanol). This means food demand is king, and food security often drives policy decisions that affect futures pricing.
📌 7. Summary / Takeaway
Wheat may not get as much media attention as corn or soybeans, but it’s a deeply important — and deeply tradable — market. Its global footprint, class differences, and sensitivity to weather and politics make it a must-know for serious agricultural futures traders.
Whether you're just starting out or looking to diversify your trading playbook, understanding wheat is an essential step. Learn its rhythms, follow its news, and respect the fact that every crop cycle brings a new story to the market.
🧭 This article is part of an ongoing educational series exploring futures trading in agricultural commodities.
📅 Watch for the next release: “Soybeans: The Global Protein Powerhouse.”
When charting futures, the data provided could be delayed. Traders working with the ticker symbols discussed in this idea may prefer to use CME Group real-time data plan on TradingView: tradingview.sweetlogin.com - This consideration is particularly important for shorter-term traders, whereas it may be less critical for those focused on longer-term trading strategies.
General Disclaimer:
The trade ideas presented herein are solely for illustrative purposes forming a part of a case study intended to demonstrate key principles in risk management within the context of the specific market scenarios discussed. These ideas are not to be interpreted as investment recommendations or financial advice. They do not endorse or promote any specific trading strategies, financial products, or services. The information provided is based on data believed to be reliable; however, its accuracy or completeness cannot be guaranteed. Trading in financial markets involves risks, including the potential loss of principal. Each individual should conduct their own research and consult with professional financial advisors before making any investment decisions. The author or publisher of this content bears no responsibility for any actions taken based on the information provided or for any resultant financial or other losses.
PineScript v6: Conditional Expressions from Libraries
I thought it appropriate to make some quick notes on calling conditional expressions from PineScript v6 libraries, seeing as I have recently updated all of my libraries to v6 and most of my function exports output booleans or values that are ultimately derived from other functions that output booleans.
When calling functions in v6 that output booleans or values derived from other functions that output booleans, it is best practice to first declare the function return globally before you use said output as input for anything else.
For example, instead of calling my swing low and uptrend functions (which both return booleans) as part of a broader conditional expression:
//@version=6
indicator('Example Conditional Expression 1')
import theEccentricTrader/PubLibSwing/3 as sw
import theEccentricTrader/PubLibTrend/2 as tr
uptrend = sw.sl() and tr.ut()
plotshape(uptrend)
I would first declare the function returns as global variables and then call the broader conditional expression using said variables:
//@version=6
indicator('Example Conditional Expression 2')
import theEccentricTrader/PubLibSwing/3 as sw
import theEccentricTrader/PubLibTrend/2 as tr
sl = sw.sl()
ut = tr.ut()
uptrend = sl and ut
plotshape(uptrend)
This demonstrates different behaviour from v5, where you could combine functions that output booleans in conditional expressions without error or warning.
The same also applies to functions that output values derived from other functions that output booleans. In the example below, my swing low price and bar index functions output float and integer values, respectively, but these values are derived from the swing low function, which is a function that returns a boolean. So these return values should also be first declared globally for later use, just like the swing low and uptrend functions:
//@version=6
indicator('Example Conditional Expression 3', overlay = true)
import theEccentricTrader/PubLibSwing/3 as sw
import theEccentricTrader/PubLibTrend/2 as tr
sl = sw.sl()
ut = tr.ut()
slp_0 = sw.slp(0)
slpbi_0 = sw.slpbi(0)
slp_1 = sw.slp(1)
slpbi_1 = sw.slpbi(1)
if sl and ut
line.new(slpbi_1, slp_1, slpbi_0, slp_0, color = color.green)
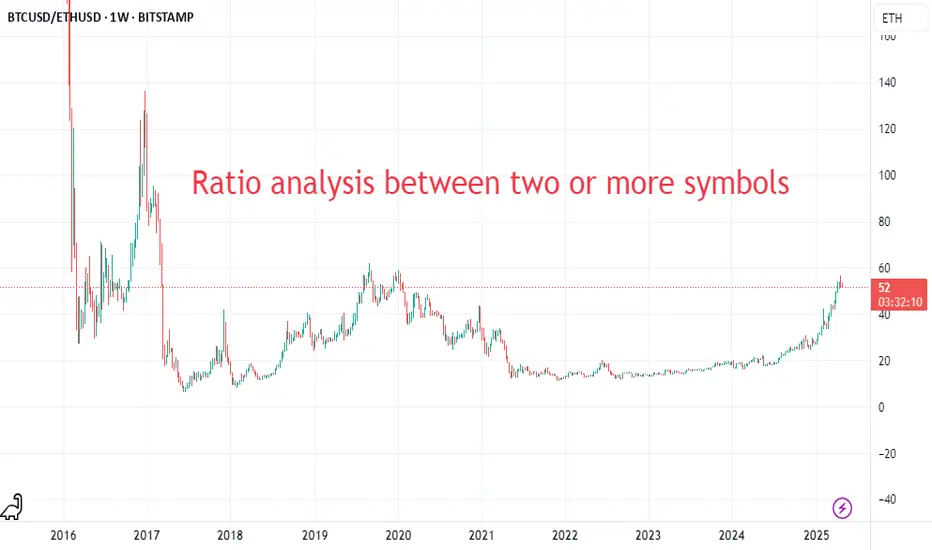
Ratio Charts in TradingView and IAAbove you can see the Bitcoin to Ethereum ratio chart. Ratio analysis between two or more symbols is a critical method for comparing the strength and weakness of assets relative to each other. TradingView offers basic capabilities for this task, but with the help of artificial intelligence (AI) and custom scripts, much more advanced and creative analyses can be conducted.
Here are some practical ideas:
1. Creating Conditional Ratio Scripts
2. Comparing Relative Averages and Issuing Smart Signals
3. Calculating Composite Ratios of Multiple Assets
4. Smart Alerts Based on Price Pattern Breakouts
For more information, search Google for "How to Use Ratio Charts in TradingView: A Hidden Gem for Traders."
Why Being Delusional Might Be Your Greatest Asset in TradingIf you think you’re going to make a full-time living trading financial markets you’re completely delusional!... and that's a good thing.
It was 1997, and two friends—let’s call them Reed and Marc—thought it would be fun to have a movie night and rent Apollo 13 from their local Blockbuster store.
For those of you who might need some context, Blockbuster was a video rental store where you’d go to rent a movie you’d like to watch.
This was shortly after discovering fire and the wheel, and it was revolutionary. At its peak, Blockbuster was worth approximately $5 billion and had over 80,000 employees across 9000 stores worldwide.
Their business model was very simple, and although they generated revenue in various ways, their core revenue was generated through a combination of rental fees, video sales and late fees.
You see, it just so happened that our two friends who thought it would be fun to rent Apollo 13, chill at home, and eat popcorn would essentially have to pay the $40 late fee, and they were admittedly, not too happy about that.
As they sat in frustration, one of them came up with the idea to start a website and rent movies to people without charging a late fee.
Instead people would just pay a monthly subscription of around $19.95 per month and they could rent up to three movies of their choosing and keep it for as long as they wanted, no rental fee, no video sales, no late fees, just a monthly subscription of $19.95.
If people wanted to rent a new set of DVD’s then all they’d need to do is return the DVD’s they’d initially rented and the new set was mailed to them within a day or two.
Now it is important to mention that all this occurred toward the end of the third industrial revolution and the internet was not nearly as advanced as it is today. People would use a dial-up connection which only produced 56 kbps or slower.
Streaming was near impossible unless you enjoyed watching a movie in three-minute increments before it loaded the next three minutes. Downloading a movie could take an entire day or even longer.
It’s fair to say that our two friends Reed and Marc were throwing stones at giants, but they had very good aim.
I’m sure you heard the story where a boy aimed at a giant's head and threw him with a stone. Turns out the boy won that fight, and ultimately claimed victory for his people, but I digress.
You see Reed had a background in computer science and software development, and at the time he co-founded a software company called Pure Software. Marc had a background in marketing and product development.
It’s safe to say that they made a very good team, but they were still going up against giants, they were challenging a system that was working with a system that was not even established yet. Essentially, they either had to be very confident or extremely delusional. Turns out they were both.
They decided to brainstorm a few names for their little startup, everything from Kibble to TakeOne, and even DirectPix and none of it seemed to stick. Eventually, they decided to combine the words “internet” and “film” to make “Netflix”.
Today Netflix is the most popular streaming platform, with its annual revenue peaking at 33.7 Billion back in 2023.
I share this story with you because it really takes more than just experience, skill, and luck to take on giants, I would argue you need to have a healthy amount of delusion as well.
So, if you think you're going to make a full-time living trading financial markets, you're completely delusional—and that might be the best thing going for you.
Because the truth is, every breakthrough, every disruption, every world-changing idea begins with someone who dares to believe in something that doesn’t quite make sense to the rest of the world—yet.
Reed and Marc didn’t just challenge a system; they challenged what was possible at the time. They bet on a future that didn’t exist—on a slower internet, a skeptical audience, and an unproven model. What looked like delusion was a vision in disguise.
In trading, as in business and life, it’s not the most logical or the most experienced who wins—it’s often those who are bold enough to stay in the game when everyone else calls it crazy. You’ll need skill, yes.
Strategy, of course. But you’ll also need the unreasonable belief that you can beat the odds, learn the rules, and then rewrite them entirely. So go ahead—be delusional.
Just make sure you’ve got the grit, the patience, and the aim to back it up.
What “giant” are you bold enough to challenge next?
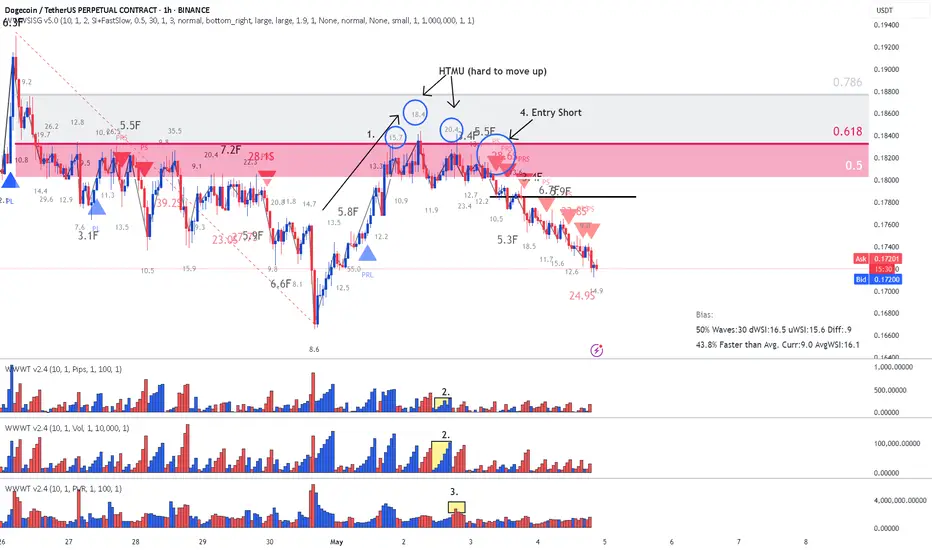
This is how to read the chart using Weis Wave with Speed IndexReading the chart:
1. We have bottom down and we pull back with high up volume waves, approaching the Fib area. Notice how SI is increasing on the up waves as we are reaching Fib from 13.3 to 15.7 to 18.4 and last not able to break previous resistance at 20.4. This means sellers are absorbing all buy orders of people entering long thinking that the trend will continue.
2. Notice the up volume wave with SI 20.4 and respective pip move right above it which is small compared to the amount of volume used - This is absorption.
3. The highest PVR bar at the beginning of the down wave - more sellers
4. Entry Short on the Plutus Short signal
Notice all the Short signals following confirming the continuation of the down move!
Simple as that, if you are able to read the chart and not just following signals from an indicator.
Enjoy!
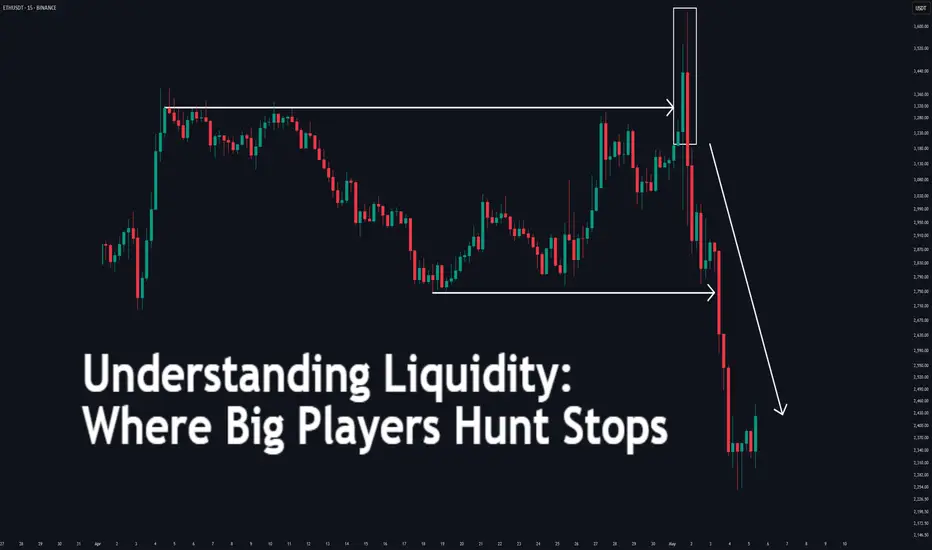
Understanding Liquidity: Where Big Players Hunt Stops
Understanding Liquidity: Where Big Players Hunt Stops
Ever wondered why price suddenly spikes through your stop-loss and reverses moments later? That’s not a coincidence—it’s liquidity at play. This article will teach you how liquidity zones work, why stop hunts happen, and how to avoid getting trapped like the crowd.
🔵 What Is Liquidity in Trading?
Liquidity refers to how easily an asset can be bought or sold without drastically affecting its price. But in practical trading, liquidity is more than just volume—it’s where traders *place* their money.
Large players—institutions, market makers, or big accounts—need liquidity to fill orders.
They target areas where many retail stop-losses or pending orders are stacked.
These areas are often just above resistance or below support—classic stop-loss zones.
To move large positions without slippage, smart money uses stop hunts to trigger retail orders and create the liquidity they need.
🔵 Where Do Liquidity Zones Form?
Liquidity often builds up in predictable areas:
Above resistance: Where shorts place stop-losses.
Below support: Where longs place stop-losses.
Swing highs/lows: Obvious turning points everyone sees.
Round numbers: e.g., 1000, 10,000, 50,000.
Breakout zones: Where breakout traders place entries or stops.
These zones act like magnets. When price approaches them, it accelerates—seeking the liquidity pool behind the level.
🔵 What Is a Stop Hunt?
A stop hunt happens when price moves just far enough to trigger stop-losses before reversing. This isn’t market noise—it’s an intentional move by big players to:
Trigger a flood of stop orders (buy or sell).
Fill their own large positions using that liquidity.
Reverse price back to fair value or the prior trend.
Example: Price breaks above resistance → stops get hit → institutions sell into that liquidity → price drops sharply.
🔵 Signs You’re in a Liquidity Grab
Look for these clues:
Fast spike beyond key levels followed by rejection.
Wick-heavy candles near highs/lows.
Price touches a level, then sharply reverses.
High volume on failed breakouts or fakeouts.
These are signs of a liquidity event—not a real breakout.
🔵 How to Trade Around Liquidity Zones
You can use liquidity traps to your advantage instead of becoming their victim.
Avoid obvious stops: Don’t place stops directly below support or above resistance. Instead, use ATR-based or structure-based stops.
Wait for confirmation: Don’t chase breakouts. Let price break, reject, then re-enter inside the range.
Watch for wick rejections: If price quickly returns after a level is breached, it's often a trap.
Use higher timeframe confluence: Liquidity grabs are more powerful when they align with HTF reversals or zones.
🔵 Real Example: Liquidity Sweep Before Reversal
In this chart, we see a textbook liquidity grab:
Price breaks below support.
Longs get stopped out.
Candle prints a long wick.
Market reverses into an uptrend.
This is where smart traders enter— after the trap is set, not during.
🔵 Final Thoughts
Liquidity is the invisible hand of the market. Stop hunts aren’t personal—they’re structural. Big players simply go where the orders are. As retail traders, the best thing we can do is:
Understand where traps are set.
Avoid being part of the crowd.
Trade the reaction, not the initial breakout.
By thinking like the smart money, you can stop getting hunted—and start hunting for better trades.
Trading Performance Review🎯 April 4 – May 3 | Trading Performance Review
Over the past 30 days, I executed 146 trades with a data-driven strategy focused on risk-adjusted returns and quantitative consistency.
🔍 Performance Metrics:
Total Trades: 146
Win Rate: 70.55%
Winning Trades: 103
Losing Trades: 43
Profitable Days: 22 / 30
No-Trade Days: 2
Winning vs Losing Trade Ratio:
✅ Winning Trades: 70.5%
❌ Losing Trades: 29.5%
Daily Outcome Distribution:
🟢 Profitable Days: 73.3%
🔴 Loss Days: 20%
⚪ No Trade: 6.7%
📈 This outcome reflects a strategy rooted in structured risk management, discipline, and probability-based execution — not impulsive decisions. Each trade was placed with purpose, not emotion.
With every data point, my trading edge sharpens. The goal remains the same: consistent performance through controlled risk and strategic action.
Progress is not measured by the number of trades, but by the quality of each decision.

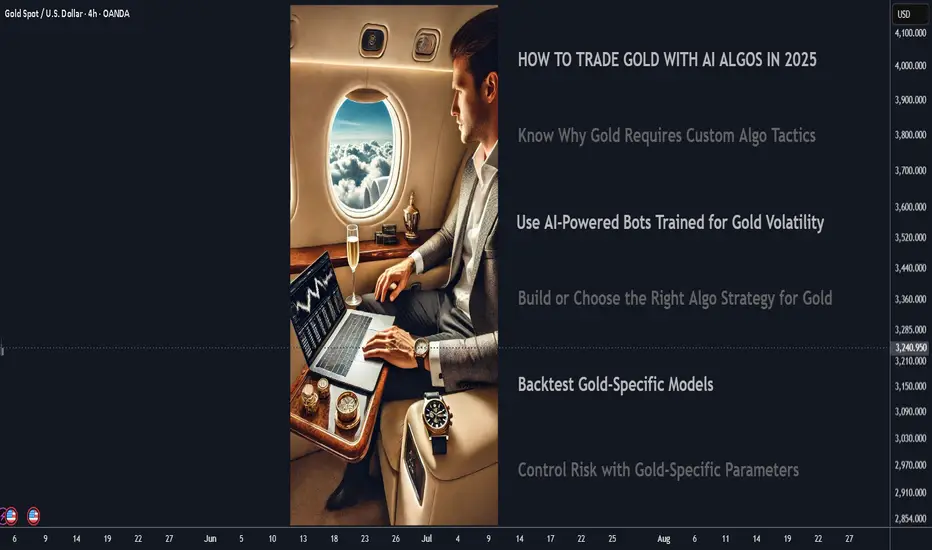
How to Trade Gold with AI-Powered Algos in 2025📊 How to Trade Gold with AI-Powered Algos in 2025
A practical action plan for serious gold traders
🔍 1. Know Why Gold Requires Custom Algo Tactics
Gold is volatile, news-sensitive, and driven by macro events like Fed policy, geopolitics, and inflation. Generic stock or crypto bots fail here — gold needs precise, event-aware automation.
🧠 2. Use AI-Powered Bots Trained for Gold Volatility
Deploy bots that adapt to real-time data like CPI releases, bond yields, and geopolitical headlines. Use machine learning models that detect gold breakouts, consolidations, and safe-haven flows.
Top AI algos for gold traders: Multiple systems based on MT4/MT5
Fully-automated, AI-based gold bot with breakout detection, precision entries, and built-in risk control.
⚙️ 3. Build or Choose the Right Algo Strategy for Gold
Trend-Following: Use 21/50 EMA crosses on H1 and H4
Mean Reversion: Bollinger Band fades in range-bound sessions
Breakout Algos: Trigger trades on CPI or FOMC event volatility
Volume-Based AI: Analyze volume spikes vs. historical patterns
🧪 4. Backtest Gold-Specific Models
Always test your bot using historical gold data, especially during NFP weeks, Fed meetings, and geopolitical escalations. Use data from 2018 to 2024 for high-volatility periods.
Tools: TradingView for Pine Script testing, MetaTrader 5 for EA deployment
🛡️ 5. Control Risk with Gold-Specific Parameters
Max drawdown: Keep under 15 percent
Stop-loss: Always use hard stops (not just trailing)
Position sizing: 0.5 to 1 percent of capital per trade
Use volatility filters: Avoid entries during thin liquidity hours
🔄 6. Automate Monitoring and Adaptation
Run multiple bots for breakout, momentum, and reversal setups
Use dashboards to track gold-specific metrics like VIX, USDX, DXY, and 10Y Treasury yields Integrate AI that adjusts parameters after major data releases
🚀 7. Prepare for 2025 Market Structure
Gold is increasingly driven by
Central bank digital currency rollouts
USD de-dollarization risks
Global stagflation or recession themes
DeFi and tokenized gold products
Your algo must factor in these macro narratives using real-time data feeds
📌 Gold Algo Trading Success Plan 2025
Use AI bots built for gold volatility
Trade high-probability breakouts post-news
Backtest with gold-specific macro filters
Maintain strict risk limits with max 15 percent drawdown
Monitor global news and macro data with bot triggers
Continuously optimize and adapt
Gold is not just a commodity — it’s a signal of global risk. Automate smartly, manage risk tightly, and use AI to stay one move ahead.
How to Enter Trades the RIGHT Way!In this video, we're tackling an important question from our community member who's been crushing it in paper trading but faces the common challenge of entering trades blindly based on alerts, fearing they'll miss out otherwise.
We'll discuss:
Why blindly following signals can hurt your long-term success
The power of context in market structure: Why waiting for price to hit key support/resistance levels drastically improves your entries
A practical approach to manage FOMO: How scaling into trades can balance quick reaction times with better entries and tighter stops
Real examples of good vs. rushed entries, highlighting the impact on your risk-to-reward

This daily pattern can change your view on price!Dear Community,
How many patterns do you know?
<5?
<20?
>20?
How many of them actually work with GREAT accuracy?
Patterns are something that we often use in trying to predict the markets….BUT I dear to say pattern alone won’t work?
THE PATTERN NEED A FRAMEWORK!
let’s discuss this “pattern” highlighted on your screen.
Why is the candle after that “doji “ higher?
Often you try to “call tops” in the market place.
And after seeing this “doji”…. WE SELL RIGHT?
if the maker is going up why do we try and call a top?
Why do we try and not “follow the trend?”
On your daily chart examine this.
IF THE MARKET IF BULLISH AND I SEE A DOJI!
Study the candle that formed just after. YOU WILL BE AMAZED BY THE FINDINGS 😃.
No I will not share the stats. If an “homework” for your own development. Let’s discuss this further in the comments below.